


 |
市場調查報告書
商品編碼
2073587
半導體裝置:市場佔有率分析、產業趨勢與統計、成長預測(2025-2030)Semiconductor Device - Market Share Analysis, Industry Trends & Statistics, Growth Forecasts (2025 - 2030) |
||||||

※ 本網頁內容可能與最新版本有所差異。詳細情況請與我們聯繫。
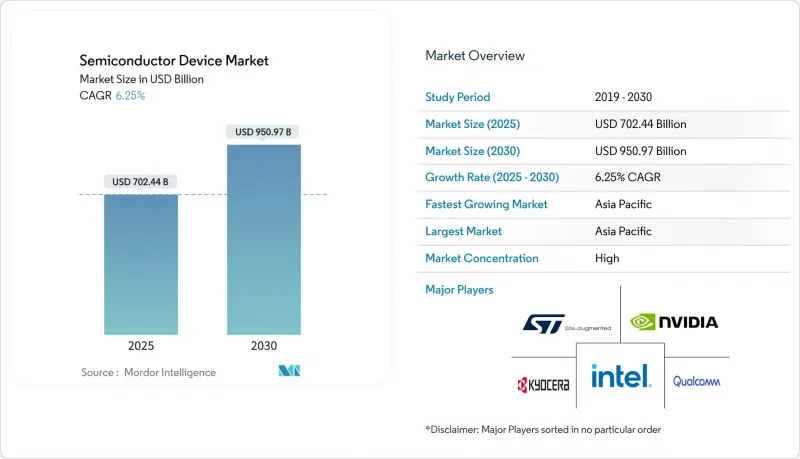
根據 Mordor Intelligence 預測,半導體裝置市場規模預計將在 2025 年達到 7,024.4 億美元,到 2030 年達到 9,509.7 億美元,在此期間的複合年成長率為 6.25%。
本報告按元件類型(離散半導體[二極體等]、光電子元件、感測器和MEMS、積體電路)、經營模式(IDM、設計/無晶圓廠供應商)、最終用戶產業(汽車、通訊、消費性電子、工業、運算/資料儲存、資料中心、人工智慧、政府)和地區(北美、歐洲、亞太、消費性電子、中東和非洲)進行分類。
全球半導體裝置市場趨勢及洞察
超大規模資料中心對人工智慧加速器的需求
美國和中國的超大規模資料中心營運商正在維修其伺服器機房,以容納單張功耗超過1千瓦的加速卡。這項措施導致2029年資本支出計畫將超過1兆美元。這種轉型需要客製化的高頻寬記憶體和先進封裝技術的半導體,目前最先進的晶圓代工製程運轉率已超過90%。由此產生的訂單積壓清楚地顯示了半導體市場為何持續超越先前的預測。先進基板和溫度控管材料的供不應求進一步增強了供應商的定價權。
每輛電動車中安裝的電力電子元件數量正在迅速增加。
從內燃機到電動驅動系統的轉變將使每輛車的半導體成本從約600美元增加到超過2000美元。碳化矽(SiC)MOSFET可將逆變器效率提高3個百分點,進而直接延長續航里程。歐洲汽車製造商在800V架構方面處於領先地位,加速了對寬能隙帶裝置的需求。半導體市場也受益於充電基礎設施的同步發展,因為充電基礎設施也採用了相同的功率模組。
微影術設備的前置作業時間為 18 個月或更長。
高數值孔徑偏振紫外光刻機,每台造價約3.8億美元,正面臨生產瓶頸,交貨週期超過18個月。儘管對3奈米以下製程的需求不斷成長,但設備供應有限制約了產能擴張。率先購置設備的公司可獲得暫時的價格優勢,而行動遲緩的公司則面臨將設計訂單拱手讓給競爭對手的風險。長期供不應求正在拖累原本強勁的半導體市場成長前景。
細分市場分析
2024年,積體電路(IC)佔半導體市場的86.1%,預計到2030年將以7.9%的複合年成長率成長。邏輯和類比電路子領域受益於人工智慧推理引擎、電動車控制和工業自動化的日益普及。高頻寬記憶體和3D NAND快閃記憶體仍然是支撐人工智慧加速器效能的基礎,這也推高了它們的價格。分離式功率裝置、光電子裝置和感測器雖然銷量較小,但卻為電動車逆變器和光纖通訊模組提供了至關重要的系統級功能。碳化矽(SiC)MOSFET和氮化鎵(GaN)HEMT的出貨量實現了兩位數的成長,反映了驅動系統電壓不斷上升的趨勢。 MEMS慣性感測器和環境感測器在工業4.0專案中日益普及,確保了整個裝置類別的均衡成長。這些趨勢共同作用,使積體電路處於半導體市場擴張的前沿,而特種元件則能夠培育新興的利基市場。
區域分析
預計到2024年,亞太地區將佔全球銷售額的63.2%,並在2030年之前以7.1%的複合年成長率成長,這主要得益於台灣在先進工藝節點領域的領先地位以及韓國投資4710億美元建設的超級產業叢集。中國當地雖然在尖端製程節點方面存在不足,但正大力投資於擁有成熟製程技術和本土設備供應商的產業園區,以提高在地採購率。日本正投資3.9兆日圓(約261億美元)成立合資企業,將國內材料技術與海外鑄造技術結合;而印度則在組裝、測試和設計服務領域加速發展。
北美地區在以金額為準位居第二,這主要得益於《晶片創新與生產法案》(CHIPS Act)提供的520億美元獎勵資金,該資金支持在亞利桑那州、俄亥俄州和德克薩斯州建設新的晶圓廠。英特爾已獲得78.65億美元、台積電66億美元和三星47.45億美元的資金,用於擴大在美國的業務。該地區聚集了大量無廠半導體公司人工智慧和網路晶片設計公司,這推動了對先進晶圓的持續需求。密西根州和加州的汽車電氣化計畫進一步豐富了收入來源,並確保半導體市場在家用電子電器市場週期性波動中保持穩健。 2023年《國防授權法案》(NDAA)第5949條將從2027年開始逐步實施採購限制,鼓勵國防相關工作負載的供應鏈轉向國內製造地。
儘管歐洲的市佔率仍低於10%,但它透過嚴格的汽車和環保法規影響全球晶片規格,進而左右著技術發展方向。歐盟的「晶片法」旨在透過獎勵計劃,扶持德累斯頓和埃因霍溫等地專注於電力電子和特種模擬裝置的項目,力爭2030年實現20%的市場佔有率。德國支持豪華汽車對半導體的需求,而北歐國家的電網則正在採用寬能隙帶裝置來滿足可再生能源的需求。產學研合作研發聯盟充分利用了大學與產業界的夥伴關係,以及半導體市場高度認可的可靠性和安全認證優勢,使歐洲成為半導體領域的技術中心。
其他好處:
- Excel格式的市場預測(ME)表
- 3個月的分析師支持
目錄
第1章:引言
- 研究假設和市場定義
- 調查範圍
第2章:調查方法
第3章執行摘要
第4章 市場狀況
- 市場概覽
- 市場促進因素
- 美國和中國超大規模資料中心對人工智慧加速器的需求
- 每輛電動車中安裝的電力電子元件數量正在迅速增加。
- 下一代汽車ADAS半導體技術的採用率
- 工業邊緣物聯網感測器的普及(歐洲)
- 5G射頻前端的複雜性(韓國和中國)
- 美國和歐盟基於《晶片製造法案》的支持措施
- 市場限制因素
- 微影術設備前置作業時間> 18 個月
- 對先進節點出口的限制(中國)
- 對製造設備和能源強度的高投入
- 工程師短缺
- 科技趨勢
- 產業價值鏈分析
- 半導體代工廠的現狀
- 各公司代工收入及市場佔有率
- IDM公司與無晶圓廠半導體公司銷售額比較
- 晶圓廠已安裝的晶圓生產能力
- 公司及節點技術的晶圓產能
- 監理與貿易政策展望
- 波特五力分析
- 投資分析
- 宏觀經濟因素的影響
第5章 市場規模與成長預測
- 依設備類型分類(依設備類型分類的出貨量為補充資料。)
- 離散半導體
- 二極體
- 電晶體
- 功率電晶體
- 整流器和閘流體
- 其他分立元件
- 光電子學
- 發光二極體(LED)
- 雷射二極體
- 影像感測器
- 光耦合器
- 其他設備類型
- 感測器和微機電系統
- 壓力
- 磁場
- 執行器
- 加速度和偏航率
- 溫度和其他
- 積體電路
- 依積體電路類型
- 模擬
- 微
- 微處理器(MPU)
- 微控制器(MCU)
- 數位訊號處理器
- 邏輯
- 記憶
- 依技術節點分類(出貨量不適用)
- 小於3奈米
- 3nm
- 5nm
- 7nm
- 16nm
- 28nm
- 大於28奈米
- 依積體電路類型
- 離散半導體
- 按經營模式
- IDM
- 設計/無晶圓廠供應商
- 按最終用途行業分類
- 車
- 通訊(有線和無線)
- 消費者
- 產業
- 計算/數據存儲
- 資料中心
- AI
- 政府(航太/國防)
- 按地區
- 北美洲
- 美國
- 加拿大
- 墨西哥
- 南美洲
- 巴西
- 墨西哥
- 阿根廷
- 其他南美國家
- 歐洲
- 德國
- 法國
- 英國
- 北歐的
- 其他歐洲國家
- 亞太地區
- 中國
- 台灣
- 韓國
- 日本
- 印度
- 其他亞太國家
- 中東和非洲
- 中東
- 沙烏地阿拉伯
- 阿拉伯聯合大公國
- 土耳其
- 其他中東國家
- 非洲
- 南非
- 其他非洲國家
- 中東
- 北美洲
第6章 競爭情勢
- 市場集中度
- 策略趨勢
- 市佔率分析
- 公司簡介
- Intel Corporation
- Taiwan Semiconductor Manufacturing Co. Ltd.(TSMC)
- Samsung Electronics Co. Ltd.
- Nvidia Corporation
- Qualcomm Incorporated
- Texas Instruments Inc.
- SK Hynix Inc.
- Micron Technology Inc.
- Broadcom Inc.
- Advanced Micro Devices Inc.(AMD)
- Analog Devices Inc.
- NXP Semiconductors NV
- Infineon Technologies AG
- STMicroelectronics NV
- ON Semiconductor Corp.
- Renesas Electronics Corp.
- Wolfspeed Inc.
- GlobalFoundries Inc.
- United Microelectronics Corp.(UMC)
- ASE Technology Holding Co. Ltd.
- ROHM Co. Ltd.
- Kyocera Corp.
- Toshiba Corp.
- Fujitsu Semiconductor Ltd.
- Marvell Technology Inc.
第7章 市場機會與未來展望
According to Mordor Intelligence, the semiconductor device market size reached USD 702.44 billion in 2025 and is forecast to attain USD 950.97 billion by 2030, translating into a 6.25% CAGR over the period.
This report is Segmented by Device Type (Discrete Semiconductors [Diodes, and More], Optoelectronics, Sensors and MEMS, and Integrated Circuits), Business Model (IDM, and Design/ Fabless Vendor), End-Use Industry (Automotive, Communication, Consumer, Industrial, Computing/Data Storage, Data Center, AI, and Government), and Geography (North America, Europe, Asia-Pacific, South America, and Middle East and Africa).
Global Semiconductor Device Market Trends and Insights
AI accelerator demand in hyperscale data centers
Hyperscale operators in the United States and China are retrofitting server halls to support accelerator cards that draw over 1 kW each, prompting capital-expenditure plans topping USD 1 trillion by 2029. The shift requires custom silicon with high-bandwidth memory and advanced packaging, pushing foundry utilization above 90% at leading-edge nodes. The resulting backlog underlines why the semiconductor market continues to outpace earlier forecasts. Scarcity of advanced substrates and thermal-management materials further amplifies pricing power for suppliers.
EV power-electronics content per vehicle surging.
Transition from internal-combustion to electric drivetrains lifts silicon content from roughly USD 600 to more than USD 2,000 per car. Silicon-carbide MOSFETs raise inverter efficiency by up to 3 percentage points, directly extending driving range. European automakers spearhead 800-V architectures, accelerating demand for wide-bandgap devices. The semiconductor market benefits from parallel growth in charging infrastructure that employs the same power modules.
Lithography tool lead times> 18 months
High-NA extreme-ultraviolet steppers priced near USD 380 million each face production bottlenecks, with deliveries stretching beyond 18 months. Limited tool availability caps capacity additions even as demand for 3 nm-and-below processes climbs. Early tool recipients obtain temporary pricing leverage, while laggards risk design wins migrating to competitors. Prolonged supply gaps temper the semiconductor market's otherwise strong growth outlook.
Other drivers and restraints analyzed in the detailed report include:
- ADAS semiconductor penetration in next-gen vehicles
- Industrial edge-IoT sensor proliferation
- Export-control curbs on advanced nodes
For complete list of drivers and restraints, kindly check the Table Of Contents.
Segment Analysis
Integrated circuits captured 86.1% of the semiconductor market in 2024 and are projected to advance at a 7.9% CAGR through 2030. Logic and analog sub-segments gain from AI inference engines, vehicle-electrification control, and industrial automation rollouts. High-bandwidth memory and 3-D NAND remain cornerstones of AI accelerator performance, reinforcing premium pricing. Discrete power devices, optoelectronics, and sensors, though smaller in dollar terms, enable system-level functionality vital for EV inverters and optical-communication modules. Silicon-carbide MOSFETs and gallium-nitride HEMTs post double-digit volume gains, reflecting drivetrain voltage escalation trends. MEMS inertial and environmental sensors proliferate in Industry 4.0 projects, ensuring balanced growth across device classes. These trends collectively position integrated circuits at the forefront of the semiconductor market size expansion while permitting specialized components to capture emerging niches.
Complete Report Scope:
- By Device Type (Shipment Volume for Device Type is Complementary)
- Discrete Semiconductors
- Diodes
- Transistors
- Power Transistors
- Rectifier and Thyristor
- Other Discrete Devices
- Optoelectronics
- Light-Emitting Diodes (LEDs)
- Laser Diodes
- Image Sensors
- Optocouplers
- Other Device Types
- Sensors and MEMS
- Pressure
- Magnetic Field
- Actuators
- Acceleration and Yaw Rate
- Temperature and Others
- Integrated Circuits
- By Integrated Circuit Type
- Analog
- Micro
- Microprocessors (MPU)
- Microcontrollers (MCU)
- Digital Signal Processors
- Logic
- Memory
- By Technology Node (Shipment Volume Not Applicable)
- < 3nm
- 3nm
- 5nm
- 7nm
- 16nm
- 28nm
- > 28nm
- By Integrated Circuit Type
- Discrete Semiconductors
- By Business Model
- IDM
- Design/ Fabless Vendor
- By End-user Industry
- Automotive
- Communication (Wired and Wireless)
- Consumer
- Industrial
- Computing/Data Storage
- Data Center
- AI
- Government (Aerospace and Defense)
- By Geography
- North America
- United States
- Canada
- Mexico
- South America
- Brazil
- Mexico
- Argentina
- Rest of South America
- Europe
- Germany
- France
- United Kingdom
- Nordics
- Rest of Europe
- Asia-Pacific
- China
- Taiwan
- South Korea
- Japan
- India
- Rest of Asia-Pacific
- Middle East and Africa
- Middle East
- Saudi Arabia
- United Arab Emirates
- Turkey
- Rest of Middle East
- Africa
- South Africa
- Rest of Africa
- Middle East
- North America
Geography Analysis
Asia-Pacific commanded 63.2% of global revenue in 2024 and is forecast to grow at a 7.1% CAGR to 2030, anchored by Taiwan's advanced-node leadership and South Korea's USD 471 billion megacluster build-out. Mainland China, while constrained at leading nodes, invests heavily in mature-process parks and domestic equipment suppliers, aiming to lift local content ratios. Japan channels ¥3.9 trillion (USD 26.1 billion) into joint ventures that couple domestic materials prowess with external foundry expertise, while India accelerates assembly-test and design-services growth.
North America ranks second by value, catalyzed by USD 52 billion CHIPS Act incentives that underwrite new fabs in Arizona, Ohio, and Texas. Intel secured USD 7.865 billion, TSMC USD 6.6 billion, and Samsung USD 4.745 billion for U.S. expansions. The region houses a dense cluster of fabless AI and networking chip designers, translating into sustained demand for advanced wafers. Automotive electrification programs in Michigan and California further diversify revenue streams, ensuring the semiconductor market remains robust even amid cyclical consumer-electronics swings. Section 5949 of the 2023 NDAA will phase in procurement restrictions in 2027, nudging supply chains toward domestic nodes for defense-linked workloads.
Europe, holding under 10% share, nonetheless influences technology direction through stringent automotive and environmental regulations that shape chip specifications worldwide. The EU Chips Act targets a 20% production share by 2030 via incentive pools for Dresden and Eindhoven projects focusing on power electronics and specialty analog. Germany anchors premium vehicle semiconductor demand, while Nordic grids adopt wide-bandgap devices for renewables. Collaborative R&D alliances leverage university-industry ties, positioning the continent as a competence center for reliability and safety certification-attributes prized across the semiconductor market.
- Intel Corporation
- Taiwan Semiconductor Manufacturing Co. Ltd. (TSMC)
- Samsung Electronics Co. Ltd.
- Nvidia Corporation
- Qualcomm Incorporated
- Texas Instruments Inc.
- SK Hynix Inc.
- Micron Technology Inc.
- Broadcom Inc.
- Advanced Micro Devices Inc. (AMD)
- Analog Devices Inc.
- NXP Semiconductors NV
- Infineon Technologies AG
- STMicroelectronics NV
- ON Semiconductor Corp.
- Renesas Electronics Corp.
- Wolfspeed Inc.
- GlobalFoundries Inc.
- United Microelectronics Corp. (UMC)
- ASE Technology Holding Co. Ltd.
- ROHM Co. Ltd.
- Kyocera Corp.
- Toshiba Corp.
- Fujitsu Semiconductor Ltd.
- Marvell Technology Inc.
Additional Benefits:
- The market estimate (ME) sheet in Excel format
- 3 months of analyst support
TABLE OF CONTENTS
1 INTRODUCTION
- 1.1 Study Assumptions and Market Definition
- 1.2 Scope of the Study
2 RESEARCH METHODOLOGY
3 EXECUTIVE SUMMARY
4 MARKET LANDSCAPE
- 4.1 Market Overview
- 4.2 Market Drivers
- 4.2.1 AI Accelerator Demand in Hyperscale Data Centers (US and China)
- 4.2.2 EV Power-Electronics Content per Vehicle Surging
- 4.2.3 ADAS Semiconductor Penetration in Next-Gen Vehicles
- 4.2.4 Industrial Edge-IoT Sensor Proliferation (Europe)
- 4.2.5 5G RF-Front-End Complexity (Korea and China)
- 4.2.6 US/EU CHIPS-Act Fab Incentives
- 4.3 Market Restraints
- 4.3.1 Lithography Tool Lead-Times >18 Months
- 4.3.2 Export-Control Curbs on Advanced Nodes (China)
- 4.3.3 High Fab Capex and Energy Intensity
- 4.3.4 Engineering-Talent Shortage
- 4.4 Technological Trends
- 4.5 Industry Value Chain Analysis
- 4.6 Semiconductor Foundry Landscape
- 4.6.1 Foundry Revenue and Share by Player
- 4.6.2 IDM vs Fabless Semiconductor Sales
- 4.6.3 Installed Wafer Capacity by Fab Location
- 4.6.4 Wafer Capacity by Company and Node Technology
- 4.7 Regulatory and Trade-Policy Outlook
- 4.8 Porter's Five Forces Analysis
- 4.8.1 Bargaining Power of Suppliers
- 4.8.2 Bargaining Power of Buyers
- 4.8.3 Threat of New Entrants
- 4.8.4 Threat of Substitutes
- 4.8.5 Intensity of Competitive Rivalry
- 4.9 Investment Analysis
- 4.10 Impact of Macroeconomic Factors
5 MARKET SIZE AND GROWTH FORECASTS (VALUE)
- 5.1 By Device Type (Shipment Volume for Device Type is Complementary)
- 5.1.1 Discrete Semiconductors
- 5.1.1.1 Diodes
- 5.1.1.2 Transistors
- 5.1.1.3 Power Transistors
- 5.1.1.4 Rectifier and Thyristor
- 5.1.1.5 Other Discrete Devices
- 5.1.2 Optoelectronics
- 5.1.2.1 Light-Emitting Diodes (LEDs)
- 5.1.2.2 Laser Diodes
- 5.1.2.3 Image Sensors
- 5.1.2.4 Optocouplers
- 5.1.2.5 Other Device Types
- 5.1.3 Sensors and MEMS
- 5.1.3.1 Pressure
- 5.1.3.2 Magnetic Field
- 5.1.3.3 Actuators
- 5.1.3.4 Acceleration and Yaw Rate
- 5.1.3.5 Temperature and Others
- 5.1.4 Integrated Circuits
- 5.1.4.1 By Integrated Circuit Type
- 5.1.4.1.1 Analog
- 5.1.4.1.2 Micro
- 5.1.4.1.2.1 Microprocessors (MPU)
- 5.1.4.1.2.2 Microcontrollers (MCU)
- 5.1.4.1.2.3 Digital Signal Processors
- 5.1.4.1.3 Logic
- 5.1.4.1.4 Memory
- 5.1.4.2 By Technology Node (Shipment Volume Not Applicable)
- 5.1.4.2.1 < 3nm
- 5.1.4.2.2 3nm
- 5.1.4.2.3 5nm
- 5.1.4.2.4 7nm
- 5.1.4.2.5 16nm
- 5.1.4.2.6 28nm
- 5.1.4.2.7 > 28nm
- 5.1.4.1 By Integrated Circuit Type
- 5.1.1 Discrete Semiconductors
- 5.2 By Business Model
- 5.2.1 IDM
- 5.2.2 Design/ Fabless Vendor
- 5.3 By End-user Industry
- 5.3.1 Automotive
- 5.3.2 Communication (Wired and Wireless)
- 5.3.3 Consumer
- 5.3.4 Industrial
- 5.3.5 Computing/Data Storage
- 5.3.6 Data Center
- 5.3.7 AI
- 5.3.8 Government (Aerospace and Defense)
- 5.4 By Geography
- 5.4.1 North America
- 5.4.1.1 United States
- 5.4.1.2 Canada
- 5.4.1.3 Mexico
- 5.4.2 South America
- 5.4.2.1 Brazil
- 5.4.2.2 Mexico
- 5.4.2.3 Argentina
- 5.4.2.4 Rest of South America
- 5.4.3 Europe
- 5.4.3.1 Germany
- 5.4.3.2 France
- 5.4.3.3 United Kingdom
- 5.4.3.4 Nordics
- 5.4.3.5 Rest of Europe
- 5.4.4 Asia-Pacific
- 5.4.4.1 China
- 5.4.4.2 Taiwan
- 5.4.4.3 South Korea
- 5.4.4.4 Japan
- 5.4.4.5 India
- 5.4.4.6 Rest of Asia-Pacific
- 5.4.5 Middle East and Africa
- 5.4.5.1 Middle East
- 5.4.5.1.1 Saudi Arabia
- 5.4.5.1.2 United Arab Emirates
- 5.4.5.1.3 Turkey
- 5.4.5.1.4 Rest of Middle East
- 5.4.5.2 Africa
- 5.4.5.2.1 South Africa
- 5.4.5.2.2 Rest of Africa
- 5.4.5.1 Middle East
- 5.4.1 North America
6 COMPETITIVE LANDSCAPE
- 6.1 Market Concentration
- 6.2 Strategic Moves
- 6.3 Market Share Analysis
- 6.4 Company Profiles (includes Global level Overview, Market level overview, Core Segments, Financials as available, Strategic Information, Market Rank/Share for key companies, Products and Services, and Recent Developments)
- 6.4.1 Intel Corporation
- 6.4.2 Taiwan Semiconductor Manufacturing Co. Ltd. (TSMC)
- 6.4.3 Samsung Electronics Co. Ltd.
- 6.4.4 Nvidia Corporation
- 6.4.5 Qualcomm Incorporated
- 6.4.6 Texas Instruments Inc.
- 6.4.7 SK Hynix Inc.
- 6.4.8 Micron Technology Inc.
- 6.4.9 Broadcom Inc.
- 6.4.10 Advanced Micro Devices Inc. (AMD)
- 6.4.11 Analog Devices Inc.
- 6.4.12 NXP Semiconductors NV
- 6.4.13 Infineon Technologies AG
- 6.4.14 STMicroelectronics NV
- 6.4.15 ON Semiconductor Corp.
- 6.4.16 Renesas Electronics Corp.
- 6.4.17 Wolfspeed Inc.
- 6.4.18 GlobalFoundries Inc.
- 6.4.19 United Microelectronics Corp. (UMC)
- 6.4.20 ASE Technology Holding Co. Ltd.
- 6.4.21 ROHM Co. Ltd.
- 6.4.22 Kyocera Corp.
- 6.4.23 Toshiba Corp.
- 6.4.24 Fujitsu Semiconductor Ltd.
- 6.4.25 Marvell Technology Inc.
7 MARKET OPPORTUNITIES AND FUTURE OUTLOOK
- 7.1 White-space and Unmet-Need Assessment

 亞太地區半導體元件:市場佔有率分析、產業趨勢與統計及成長預測(2026-2031)北美和南美半導體裝置市場:市場佔有率分析、行業趨勢和統計數據以及成長預測(2026-2031 年)日本半導體裝置:市場佔有率分析、產業趨勢與統計、成長預測(2026-2031)歐洲半導體裝置:市場佔有率分析、產業趨勢與統計數據、成長預測(2026-2031)光敏半導體元件:市場佔有率分析、產業趨勢與統計、成長預測(2026-2031)
 2034年工業半導體市場預測-全球分析(依元件類型、材料、封裝類型、功率等級、晶圓尺寸、應用、終端用戶產業、製造模式、銷售管道和地區分類)
 半導體拆解服務市場:全球市場預測,2026-2032年用於加工應用的半導體裝置:市場佔有率分析、行業趨勢和統計數據以及成長預測(2026-2031 年)
 光敏半導體元件市場:依元件、材料、應用、工作模式、最終用戶、國家及地區分類-全球產業分析、市場規模、市場佔有率及2026年至2033年預測
 半導體環境感測器市場分析與預測(至2035年):類型、產品類型、技術、組件、應用、材料類型、最終用戶、功能、安裝方式、解決方案