


 |
市場調查報告書
商品編碼
2062318
電子商務倉儲:市場佔有率分析、行業趨勢和統計數據以及成長預測(2026-2031 年)E-Commerce Warehousing - Market Share Analysis, Industry Trends & Statistics, Growth Forecasts (2026 - 2031) |
||||||
※ 本網頁內容可能與最新版本有所差異。詳細情況請與我們聯繫。
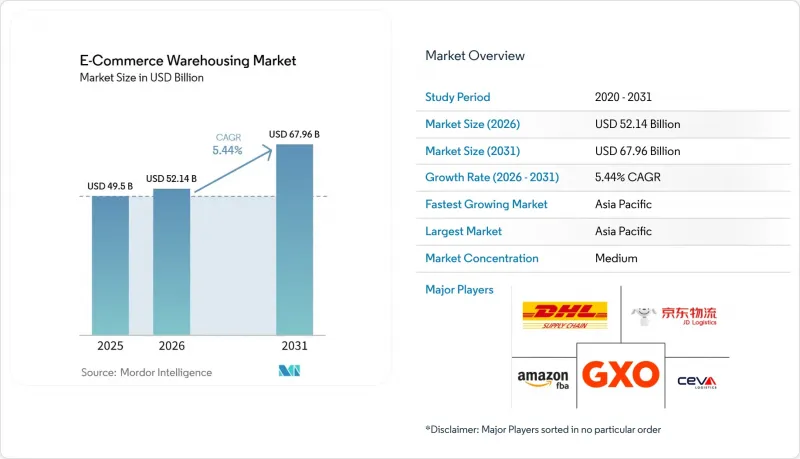
全球電子商務倉儲市場預計將從 2025 年的 495 億美元成長到 2026 年的 521.4 億美元,到 2031 年達到 679.6 億美元,2026 年至 2031 年的複合年成長率為 5.44%。
看似穩定的成長率背後隱藏著根本性的變化,包括保稅倉庫在自由貿易區周邊的集中、直銷品牌對靈活臨時倉庫空間的需求,以及由於社交電商帶來的SKU波動,企業轉向自適應自動化。本報告按倉庫類型(例如:履約中心、物流中心等)、服務類型(例如:倉儲、揀貨包裝等)、自動化程度(例如:人工、半自動化等)、最終用戶(例如:服裝鞋帽、家電等)和地區(例如:北美、南美等)進行細分。市場預測以美元計價。
全球電子商務倉儲市場趨勢及洞察
跨境電子商務的激增正在推動保稅倉庫的擴張。
從傑貝阿里延伸至新加坡的自由貿易區,自2024年以來,保稅倉庫容量以兩位數的速度成長,使跨境電商消費者能夠享受3-5天的快速配送服務,並改變了高價值商品的成本結構。天貓國際等中國電商平台透過東南亞的保稅樞紐將庫存轉運至其他地區,從而縮短了兩週的前置作業時間。同時,歐盟關稅改革簡化了行政程序,促使中歐地區的保稅倉庫建設增加了28%。這些趨勢正在為全球電商倉儲市場的結構性轉變奠定基礎,使其轉向靠近邊境、能夠靈活應對貿易路線波動的倉儲地點轉移。
利用區塊鏈技術檢驗管理歷史正引起受監管產業的關注。
隨著檢驗缺陷的逐步解決,製藥公司和奢侈品牌正將倉儲業務遷移至第三方設施。 IBM Food Trust 和類似的帳本系統記錄所有處理歷史,滿足了監管機構和先前更傾向於自建倉庫的奢侈品牌的要求。從輝瑞到 Moderna 的疫苗計畫已大規模證明了該模式的有效性,而像 LVMH 這樣的時尚集團現在也開始在倉庫出貨單上添加基於QR碼的產地資訊。雖然防篡改日誌已將合規相關成本降低了 40%,並實現了自動化保險覆蓋,但企業實施成本仍高達 200 萬美元,互通性挑戰依然存在。儘管如此,區塊鏈技術的普及預示著全球電子商務倉儲市場將出現新的加值服務收入來源。
在新興地區,由於電網的限制,自動化系統的運作時間受到限制。
從印度到奈及利亞,全球各地市場都面臨間歇性停電的困擾,導致機器人生產線停駛15%至25%的計畫運作時間。柴油發電機提供的備用電源使成本增加了35%至40%,從而削弱了自動化立體倉庫(AS/RS)系統的投資報酬率。京東物流雅加達倉庫的電壓驟降導致其運轉率從85%驟降至62%,迫使維修混合(太陽能/電池)供電系統。這使得每平方英尺的資本支出(CAPEX)增加了100至150美元。在電網韌性改善之前,全球電商倉儲市場的營運商必須權衡自動化需求與當地電力狀況之間的關係。
細分市場分析
微型倉配中心和暗店正以 10.68% 的複合年成長率(2026-2031 年)擴張,對傳統履約中心構成挑戰,後者在 2025 年仍將佔全球電子商務倉儲市場的 43.42%。這些小規模、以本地為中心的設施能夠實現超快速配送,並且在人口稠密的都市區尤其有效。
傳統物流中心仍然重要,但它們正向全通路樞紐轉型。低溫運輸倉庫也不斷擴張,以滿足食品和藥品的需求;保稅倉庫則憑藉其關稅延期繳納模式,在跨境電商領域備受關注。同時,專門用於退貨和再加工的設施也應運而生,凸顯了逆向物流日益成長的重要性。
截至2025年,倉儲服務將佔全球電商倉儲市場的44.82%,但隨著品牌不再侷限於簡單的庫存管理,附加價值服務預計將以10.15%的複合年成長率成長。客製化套件組裝、最終貼標和專屬包裝等服務使DTC(直接面對消費者)經銷商能夠在倉儲環節提升品牌價值,從而比基本的揀貨和包裝服務收取高出15-25%的費用。
退貨率的上升使營運變得更加複雜,倉庫需要增加檢驗、翻新和轉售流程。為了減少倉儲時間和成本,高周轉率商品擴大採用越庫作業的方式來處理。同時,醫藥和食品等行業嚴格的追蹤要求也創造了寶貴的長期服務機會。整體而言,倉儲營運正變得更加專業化和服務主導。
區域分析
預計到2025年,亞太地區將佔據全球電子商務倉儲市場佔有率的38.95%,並以6.08%的複合年成長率(CAGR)保持最高增速,直至2031年。中國的自由貿易區網路正透過保稅倉庫促進價值3,000億美元的跨境商品流通;印尼、越南和菲律賓則正在擴大微型倉配覆蓋範圍,以滿足社交電商的瞬時需求。儘管印度的商品和服務稅(GST)改革面臨電網不穩定的問題,但機構投資者的投資空間仍增加了40%,加速了自動化試點部署。日本和韓國正在引進機器人技術以應對勞動力老化問題,提升了該地區的技術密集度。
北美是全球電商倉儲市場的第二大市場。疫情期間的過度建設導致2024年出現大量空置轉租倉庫,但隨著零售商重新評估其全通路樞紐位置,2025年的吸收率有所回升。墨西哥正在崛起為近岸物流中心,蒙特雷和蒂華納的保稅倉庫建設與通往美國的物流走廊相連。在美國,投資提升設施永續性已成為主流,屋頂太陽能發電和LEED金級認證設計正成為新競標項目的標準配備。
在歐洲,受綠色新政的推動和「店內即買」(BOPIS)模式的普及,物流倉儲市場正穩步擴張。華沙和鹿特丹是多模態走廊的樞紐,而英國脫歐引發的海關摩擦導致英吉利海峽兩岸形成雙重庫存體系。目前,LEED和BREEAM認證正在影響貸款條件,效率標準也被納入歐洲大陸各地的倉庫評估系統。非洲地區雖然規模較小,但成長迅速。杜拜和利雅德正在投資建立自由區樞紐,以支持橫跨三大洲的物流流動,從而推動全球電子商務倉儲市場的整體發展。
其他好處:
- Excel格式的市場預測(ME)表
- 3個月的分析師支持
目錄
第1章:引言
- 研究假設和市場定義
- 調查範圍
第2章:調查方法
第3章執行摘要
第4章 市場狀況
- 市場概覽
- 市場促進因素
- 跨境電子商務的激增正在推動保稅倉庫的擴張。
- 利用區塊鏈檢驗儲存歷史正在引起受監管行業的關注。
- D2C品牌的蓬勃發展正在推動靈活、臨時倉庫的普及。
- 社交電商帶來的 SKU 波動正在推動自適應儲存系統的發展。
- 強制性淨零排放將加速對淨正能源設施的投資。
- BOPIS 的廣泛應用需要都市區全通路庫存中心。
- 市場限制因素
- 新興地區的電網限制限制了自動化系統的運作時間。
- 針對WMS的網路攻擊日益加劇,阻礙了履約的持續進行。
- 城市郊區的規劃法規延緩了倉庫的批准。
- 海運價格波動劇烈,給庫存分配帶來了困難。
- 價值供應鏈分析
- 監理情勢
- 技術展望
- 波特五力模型
第5章 市場規模及成長預測(價值,2024-2030 年)
- 倉庫類型
- 履約中心
- 物流中心(DC)
- 低溫運輸倉庫
- 暗店/微型倉配中心
- 其他(逆向物流中心、保稅倉庫、多功能空間等)
- 按服務類型
- 貯存
- 揀貨和包裝
- 附加價值服務及其他服務(套件組裝、貼標籤)
- 按自動化級別
- 手動的
- 半自動
- 全自動
- 按最終用戶行業分類
- 服裝和鞋類
- 家用電子產品
- 食品和快速消費品
- 醫藥、美容和健康
- 家居用品/家具
- 其他
- 按地區
- 北美洲
- 美國
- 加拿大
- 墨西哥
- 南美洲
- 巴西
- 秘魯
- 智利
- 阿根廷
- 其他南美國家
- 亞太地區
- 印度
- 中國
- 日本
- 澳洲
- 韓國
- 東南亞(新加坡、馬來西亞、泰國、印尼、越南、菲律賓)
- 其他亞太國家
- 歐洲
- 英國
- 德國
- 法國
- 西班牙
- 義大利
- 比荷盧經濟聯盟(比利時、荷蘭、盧森堡)
- 北歐國家(丹麥、芬蘭、冰島、挪威、瑞典)
- 其他歐洲國家
- 中東和非洲
- 阿拉伯聯合大公國
- 沙烏地阿拉伯
- 南非
- 奈及利亞
- 其他中東和非洲國家
- 北美洲
第6章 競爭情勢
- 市場集中度
- 策略趨勢
- 市佔率分析
- 公司簡介
- DHL Supply Chain & Fulfilment
- JD Logistics
- GXO Logistics
- CEVA Logistics
- UPS Supply Chain Solutions
- FedEx Supply Chain
- Maersk
- Kuehne+Nagel
- ShipBob
- Aramex
- Yusen Logistics
- Hellmann Worldwide Logistics
- SF Express
- Ninja Van
- Lineage Logistics
- DSV
- Geodis
- Nippon Express
- Sinotrans
- Ryder Supply Chain Solutions
第7章 市場機會與未來展望
According to Mordor Intelligence, the global e-commerce warehousing market size is expected to increase from USD 49.50 billion in 2025 to USD 52.14 billion in 2026 and reach USD 67.96 billion by 2031, growing at a CAGR of 5.44% over 2026-2031.
A steady headline rate hides sweeping shifts as bonded facilities cluster around free-trade zones, direct-to-consumer (DTC) brands demand flexible pop-up capacity, and social-commerce-driven SKU volatility pushes operators toward adaptive automation. This report is Segmented by Warehouse Type (Fulfilment Centres, Distribution Centres, and More), by Service Type (Storage, Picking & Packing, and More), by Automation Level (Manual, Semi-Automated, and More), by End-User (Apparel & Footwear, Consumer Electronics, and More), and by Region (North America, South America, and More). The Market Forecasts are Provided in Terms of Value (USD).
Global E-Commerce Warehousing Market Trends and Insights
Cross-Border E-Commerce Surge Fuels Bonded-Warehouse Expansion
Free-trade zones from Jebel Ali to Singapore have raised bonded capacity by double-digit rates since 2024, enabling 3-5-day delivery to cross-border consumers and tipping the cost calculus for high-value goods. Chinese platforms such as Tmall Global funnel inventory through Southeast Asian bonded sites to shave two-week lead times, while European Union customs reforms reduced paperwork and unlocked 28% growth in Central-European bonded builds. These dynamics anchor the global e-commerce warehousing market's structural shift toward near-border storage nodes that flex with trade-lane swings.
Blockchain-Verified Chain-of-Custody Attracts Regulated Verticals
Pharmaceutical and luxury operators are migrating to third-party sites once verification gaps close. IBM Food Trust and comparable ledgers log every handling event, satisfying regulators and luxury houses that previously preferred in-house stockrooms. Vaccine programs from Pfizer to Moderna proved the model at scale, and fashion groups like LVMH now imprint QR-based provenance on warehouse exits. Immutable logs trim compliance overhead by 40% and automate insurance triggers, although enterprise deployments still run up to USD 2 million and suffer interoperability frictions. Even so, blockchain uptake signals fresh premium-service revenue inside the global e-commerce warehousing market.
Power-Grid Constraints Limit Automation Uptime in Emerging Regions
Intermittent electricity knocks robotic lines offline for 15-25% of scheduled hours in markets from India to Nigeria. Diesel backups raise costs by 35-40% and undermine ROI on AS/RS systems. JD Logistics saw Jakarta utilization tumble from 85% to 62% when voltage dipped, forcing hybrid solar-battery retrofits that add USD 100-150 per ft2 to capex. Until grid resilience improves, operators must balance automation ambition with localized power realities across the global e-commerce warehousing market.
Other drivers and restraints analyzed in the detailed report include:
- Direct-to-Consumer Brand Boom Drives Flexible Pop-Up Warehousing
- Social-Commerce-Led SKU Volatility Spurs Adaptive Storage Systems
- Escalating Cyber-Attacks on WMS Disrupt Fulfillment Continuity
For complete list of drivers and restraints, kindly check the Table Of Contents.
Segment Analysis
Micro-fulfillment centers and dark stores are expanding at a 10.68% CAGR (2026-2031), challenging traditional fulfillment centers, which still hold 43.42% of the global e-commerce warehousing market size in 2025. Their small, hyperlocal setups enable ultra-fast delivery, making them especially effective in dense urban areas.
Traditional distribution centers remain important but are evolving into omnichannel hubs. Cold-chain warehouses are also growing to support grocery and pharmaceutical demand, while bonded warehouses are gaining traction in cross-border e-commerce through duty-deferred models. At the same time, specialized facilities for returns and refurbishment are emerging, highlighting the rising importance of reverse logistics.
Storage held a 44.82% revenue of the global e-commerce warehousing market size in 2025, but value-added services will advance at a 10.15% CAGR as brands seek differentiation beyond plain shelving. Customized kitting, late-stage labeling, and bespoke packaging allow DTC sellers to embed brand equity at the warehouse touchpoint, commanding 15-25% price uplifts over basic pick-pack.
Rising returns are pushing warehouses to add inspection, refurbishment, and resale processes, making operations more complex. Fast-moving goods are increasingly handled through cross-docking to reduce storage time and costs. Meanwhile, strict tracking requirements in sectors like pharma and food are creating valuable, long-term service opportunities. Overall, warehousing is becoming more specialized and service-driven.
Geography Analysis
Asia-Pacific controlled 38.95% of the global e-commerce warehousing market share in 2025 and posts the strongest 6.08% CAGR through 2031. China's free-trade-zone network funnels USD 300 billion in cross-border goods through bonded depots, while Indonesia, Vietnam, and the Philippines add micro-fulfillment coverage to satisfy social-commerce flash demand. India's GST reform triggered a 40% jump in institutional-grade space and accelerated automation pilots despite power-grid inconsistencies. Japan and South Korea deploy robotics to offset aging labor pools, pushing regional technology intensity higher.
North America forms the second-largest slice of the global e-commerce warehousing market. Pandemic-era overbuilding left sublease space idle in 2024, yet absorption picked up in 2025 as retailers recalibrated omnichannel footprints. Mexico flourishes as a nearshore alternative, attracting bonded builds in Monterrey and Tijuana that knit into United States distribution corridors. Sustainability upgrades dominate United States capex, with rooftop solar and LEED Gold designs standard in new bids.
Europe records steady expansion behind Green Deal imperatives and BOPIS adoption. Warsaw and Rotterdam anchor multimodal corridors, while Brexit-driven customs frictions spark dual-inventory positions on each side of the Channel. LEED and BREEAM labels now influence financing terms, embedding efficiency baselines into continental warehouse valuations. Middle East and Africa, though smaller, grow rapidly; Dubai and Riyadh bankroll free-zone hubs to service tri-continent flows that feed the broader global e-commerce warehousing market.
- DHL Supply Chain & Fulfilment
- JD Logistics
- GXO Logistics
- CEVA Logistics
- UPS Supply Chain Solutions
- FedEx Supply Chain
- Maersk
- Kuehne+Nagel
- ShipBob
- Aramex
- Yusen Logistics
- Hellmann Worldwide Logistics
- SF Express
- Ninja Van
- Lineage Logistics
- DSV
- Geodis
- Nippon Express
- Sinotrans
- Ryder Supply Chain Solutions
Additional Benefits:
- The market estimate (ME) sheet in Excel format
- 3 months of analyst support
TABLE OF CONTENTS
1 Introduction
- 1.1 Study Assumptions & Market Definition
- 1.2 Scope of the Study
2 Research Methodology
3 Executive Summary
4 Market Landscape
- 4.1 Market Overview
- 4.2 Market Drivers
- 4.2.1 Cross-Border E-Commerce Surge Fuels Bonded-Warehouse Expansion
- 4.2.2 Blockchain-Verified Chain-of-Custody Attracts Regulated Verticals
- 4.2.3 Direct-To-Consumer Brand Boom Drives Flexible Pop-Up Warehousing
- 4.2.4 Social-Commerce-Led SKU Volatility Spurs Adaptive Storage Systems
- 4.2.5 Net-Zero Mandates Accelerate Investment in Energy-Positive Facilities
- 4.2.6 BOPIS Proliferation Requires Urban Omni-Inventory Hubs
- 4.3 Market Restraints
- 4.3.1 Power-Grid Constraints Limit Automation Uptime in Emerging Regions
- 4.3.2 Escalating Cyber-Attacks on WMS Disrupt Fulfillment Continuity
- 4.3.3 Urban-Edge Zoning Restrictions Delay Warehouse Approvals
- 4.3.4 Volatile Ocean-Freight Rates Complicate Inventory Positioning
- 4.4 Value / Supply-Chain Analysis
- 4.5 Regulatory Landscape
- 4.6 Technological Outlook
- 4.7 Porter's Five Forces
- 4.7.1 Competitive Rivalry
- 4.7.2 Threat of New Entrants
- 4.7.3 Bargaining Power of Suppliers
- 4.7.4 Bargaining Power of Buyers
- 4.7.5 Threat of Substitutes
5 Market Size & Growth Forecasts (Value, 2024-2030)
- 5.1 By Warehouse Type
- 5.1.1 Fulfilment Centres
- 5.1.2 Distribution Centres (DCs)
- 5.1.3 Cold-Chain Warehouses
- 5.1.4 Dark Stores / Micro-Fulfillment Centers
- 5.1.5 Others (reverse logistics hubs, bonded warehouses, hybrid-use spaces, etc.)
- 5.2 By Service Type
- 5.2.1 Storage
- 5.2.2 Picking & Packing
- 5.2.3 Value-Added Services and Others (kitting, labelling)
- 5.3 By Automation Level
- 5.3.1 Manual
- 5.3.2 Semi-Automated
- 5.3.3 Fully Automated
- 5.4 By End-User Industry
- 5.4.1 Apparel & Footwear
- 5.4.2 Consumer Electronics
- 5.4.3 Grocery & FMCG
- 5.4.4 Pharmaceuticals, Beauty & Wellness
- 5.4.5 Home Essentials & Furnishings
- 5.4.6 Others
- 5.5 By Geography
- 5.5.1 North America
- 5.5.1.1 United States
- 5.5.1.2 Canada
- 5.5.1.3 Mexico
- 5.5.2 South America
- 5.5.2.1 Brazil
- 5.5.2.2 Peru
- 5.5.2.3 Chile
- 5.5.2.4 Argentina
- 5.5.2.5 Rest of South America
- 5.5.3 Asia-Pacific
- 5.5.3.1 India
- 5.5.3.2 China
- 5.5.3.3 Japan
- 5.5.3.4 Australia
- 5.5.3.5 South Korea
- 5.5.3.6 South East Asia (Singapore, Malaysia, Thailand, Indonesia, Vietnam, and Philippines)
- 5.5.3.7 Rest of Asia-Pacific
- 5.5.4 Europe
- 5.5.4.1 United Kingdom
- 5.5.4.2 Germany
- 5.5.4.3 France
- 5.5.4.4 Spain
- 5.5.4.5 Italy
- 5.5.4.6 BENELUX (Belgium, Netherlands, and Luxembourg)
- 5.5.4.7 NORDICS (Denmark, Finland, Iceland, Norway, and Sweden)
- 5.5.4.8 Rest of Europe
- 5.5.5 Middle East and Africa
- 5.5.5.1 United Arab Emirates
- 5.5.5.2 Saudi Arabia
- 5.5.5.3 South Africa
- 5.5.5.4 Nigeria
- 5.5.5.5 Rest of Middle East And Africa
- 5.5.1 North America
6 Competitive Landscape
- 6.1 Market Concentration
- 6.2 Strategic Moves
- 6.3 Market Share Analysis
- 6.4 Company Profiles (includes Global level Overview, Market level overview, Core Segments, Financials as available, Strategic Information, Market Rank/Share for key companies, Products & Services, and Recent Developments)
- 6.4.1 DHL Supply Chain & Fulfilment
- 6.4.2 JD Logistics
- 6.4.3 GXO Logistics
- 6.4.4 CEVA Logistics
- 6.4.5 UPS Supply Chain Solutions
- 6.4.6 FedEx Supply Chain
- 6.4.7 Maersk
- 6.4.8 Kuehne+Nagel
- 6.4.9 ShipBob
- 6.4.10 Aramex
- 6.4.11 Yusen Logistics
- 6.4.12 Hellmann Worldwide Logistics
- 6.4.13 SF Express
- 6.4.14 Ninja Van
- 6.4.15 Lineage Logistics
- 6.4.16 DSV
- 6.4.17 Geodis
- 6.4.18 Nippon Express
- 6.4.19 Sinotrans
- 6.4.20 Ryder Supply Chain Solutions
7 Market Opportunities & Future Outlook
 印度跨境B2C電子商務物流:市場佔有率分析、產業趨勢與統計及成長預測(2026-2031年)美國跨境電子商務物流:市場佔有率分析、產業趨勢與統計及成長預測(2026-2031)越南跨境B2C電子商務物流:市場佔有率分析、產業趨勢與統計及成長預測(2026-2031年)印度跨境電子商務物流:市場佔有率分析、產業趨勢與統計及成長預測(2026-2031)越南跨境電商物流:市佔率分析、產業趨勢與統計及成長預測(2026-2031年)
 電子商務物流市場規模、佔有率和成長分析:按服務類型、模式、營運方式、產業和地區分類-2026-2033年產業預測
 電子商務物流市場規模、佔有率、趨勢和預測:按產品類型、服務類型、業務領域和地區分類,2026-2034 年
 電子商務物流市場:依服務類型、供應商類型、營運模式、交付模式、經營模式、支付方式及最終用戶產業分類-2026-2032年全球市場預測
 2026年全球跨境電子商務物流市場報告
 電子商務物流市場規模、市場佔有率和成長率;全球產業分析;按類型、應用和地區進行分析;以及未來預測(2026-2034 年)。