


 |
市場調查報告書
商品編碼
2100743
印尼電子商務物流:市場佔有率分析、產業趨勢與統計及成長預測(2026-2031)Indonesia E-commerce Logistics - Market Share Analysis, Industry Trends & Statistics, Growth Forecasts (2026 - 2031) |
||||||

※ 本網頁內容可能與最新版本有所差異。詳細情況請與我們聯繫。
根據 Mordor Intelligence 預測,印尼電子商務物流市場規模將從 2025 年的 52.7 億美元成長到 2026 年的 57.4 億美元,然後在 2031 年達到 87.1 億美元,2026 年至 2031 年的複合年成長率為 8.71%。
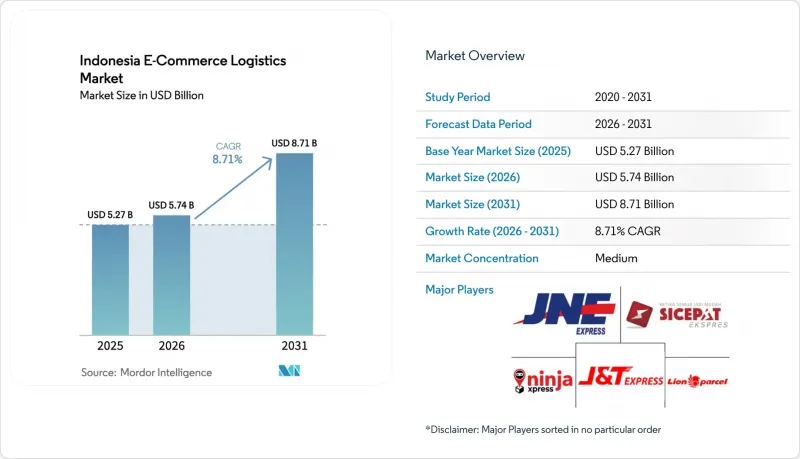
本報告按服務類型(運輸、倉儲及其他)、經營模式(B2C、B2B、C2C)、目的地(國內、跨境)、配送速度(當日達、隔日達及其他)、產品類別(時尚、電子產品及其他)、城市排名(排名第一、排名第二及其他)和地區(西爪哇、東爪哇及其他)進行分類。市場預測以美元計價。
印尼電子商務物流市場趨勢與洞察
直播和社交電商的蓬勃發展正在推動小包裹遞送頻率的增加。
直播購物正在加速消費者的購買決策,導致訂單頻率增加、單筆訂單金額縮小,並提高了每位顧客的小包裹數量。 TikTok Shop於2024年12月與Tokopedia達成15億美元的合作協議後重新上線,到2025年3月,其每日平均結帳量已達到320萬筆。用戶平均每月下單4.7筆,是傳統瀏覽量的兩倍多,這給物流供應商帶來了挑戰:如何在不相應提高單筆訂單收入的情況下處理更大的商品量。雖然由於網紅聚集區小包裹密度高,路線最佳化成為可能,但消費者仍需要靈活便捷的居家賣家上門取貨服務。貿易部透明度法規加強了合規監管,這有利於擁有完善數位文件管理系統的成熟物流公司。整體而言,直播電商預計將使印尼電商物流市場的複合年成長率提升約2.3個百分點。
該平台的專屬物流部門擴大了其「1小時內送達」服務範圍。
為了確保服務品質和獲利能力,市場正在推動配送營運的內部化。 Shopee Express 已涵蓋 487 個城市,佔 Shopee小包裹總量的 41%,並在 12 個大都會圈提供 2 小時以內送達服務。 Lazada eLogistics 營運 73 個自動化配送中心,每日處理小包裹量達 85 萬件。其專有網路利用需求可視性和庫存數據,將產品預先部署在買家附近,並實現預測性路線規劃,從而在人口密集地區兌現「1 小時以內」的送達承諾。然而,資本負擔以及擬議的市場監管(要求第三方配送服務商保持中立准入)可能會削弱它們的優勢。這種轉變正迫使中型獨立營運商專注於低溫運輸和跨境物流等細分領域,預計將推動印尼電商物流市場在 2026 年至 2031 年間成長約 1.9 個百分點。
都市區擁擠和低排放區降低了最後一公里配送密度。
預計到2025年,雅加達尖峰時段的平均車速將降至11公里/小時,導致駕駛效率下降,並迫使車隊規模擴大以維持服務水準。在提案的低排放氣體區,老舊柴油貨車將被禁止在白天進入市中心,這將影響68%的現有配送路線。泗水和萬隆的試點計畫也實施了類似的交通限制,加重了老舊車輛營運商的負擔。微型倉配中心和摩托車配送服務雖然能在一定程度上緩解交通堵塞,但需要佔用昂貴的都市區土地。總體而言,這些監管和交通方面的不利因素預計將在短期內使印尼電子商務物流市場的複合年成長率下降1.3個百分點。
細分市場分析
預計到2025年,運輸業將佔印尼電商物流銷售額的72.78%,但附加價值服務預計將以10.39%的複合年成長率成長,並有望擴大其在印尼電商物流市場的佔有率。目前,經銷商將品牌包裝、套裝組合和退貨管理視為客戶維繫的核心要素。真偽驗證和出貨前檢查已使時尚和電子產品的退貨率降低了高達25%。同時,道路網路的核心基礎設施正受益於新建收費公路的建設,例如全長117公里的塞馬蘭德馬克高速公路,該高速公路將使中爪哇的運輸時間縮短35%。海運仍然是連接印尼群島的主要方式,但東爪哇的航運班次較少,運輸時間通常需要數天。
隨著平台分發庫存,倉庫正在消化激增的庫存。雅加達、泗水和萬隆等工業區的甲級物流設施正在迅速增加,為當日達配送提供支援。儘管鐵路運輸發展緩慢,但多模態樞紐正在整合空運貨物,預計到2025年,隨著寬體飛機的普及,專用運輸能力將成長22%。因此,核心運輸和輔助服務的策略協調正在決定印尼電商物流市場價值創造的速度。
2025年,B2C通路在印尼電商物流市場仍將維持75.23%的領先佔有率。然而,C2C小包裹預計將以13.40%的年成長率成長,且小包裹數量預計將顯著超過交易額。 2025年,P2P市場、直播網紅和二手交易平台合計預計將錄得1.27億筆交易,從而推動對住宅取貨、輕量化包裝和擔保退貨服務的需求成長。代出貨模式模糊了傳統界限,迫使承運商在維持B2C服務水準的同時,以應對C2C市場的波動性。
大規模的市場持續發揮規模經濟優勢,在降低運輸成本的同時,也促進了協同需求預測,從而提高了路線裝載率。同時,企業正在推動採購流程的數位化,推動了B2B物流對即時補貨和系統整合需求的穩定成長。因此,印尼C2C電商物流市場規模的擴大,不僅豐富了整體服務組合,也加速了非正式經銷商對行動POS工具的採用。
其他福利
- Excel格式的市場預測(ME)表
- 3個月的分析師支持
目錄
第1章:引言
- 研究假設和市場定義
- 調查範圍
第2章:調查方法
第3章執行摘要
第4章 市場狀況
- 市場概覽
- 市場促進因素
- 直播和社交電商的蓬勃發展正在推動小包裹遞送頻率的增加。
- 該平台的「專屬式」物流部門正在擴大其配送範圍,使其達到一小時內送達。
- 由於網路食品雜貨、疫苗和藥品電子商務的發展,低溫運輸迅速擴張。
- 全國強制使用電子送貨證明(E-POD)將減少因退貨造成的損失。
- 排碳權獎勵正在加速電動貨車和電動自行車的普及。
- 大型履約中心的 5G 專用網路可實現機器人即時運作。
- 市場限制因素
- 都市區交通堵塞和低排放氣體區導致最後一公里配送的收貨密度下降。
- 補貼改革後燃油價格波動,推高了運輸成本。
- 隨著強制使用電子帳單發票的臨近,微企業和經銷商在遵守相關規定方面遇到了延誤。
- 電池回收能力不足阻礙了電動車保有量的擴張。
- 價值供應鏈分析
- 監理情勢
- 技術展望
- 需求與供給分析
- 產業吸引力—五力分析
- 新進入者的威脅
- 買方的議價能力
- 供應商的議價能力
- 替代品的威脅
- 競爭公司之間的競爭
- 逆向/退貨物流洞察
- 地緣政治事件對供應鏈轉型的影響
第5章 市場規模與成長預測
- 按服務
- 運輸
- 路
- 鐵路
- 航空
- 海
- 倉儲存儲和履約
- 附加價值服務(貼標籤、包裝、套件組裝)
- 運輸
- 按經營模式
- B2C
- B2B
- C2C
- 按目的地
- 國內的
- 跨境(國際)
- 配送速度
- 當日送達(24小時內)
- 隔日送達(24-48小時)
- 標準(3-5天)
- 其他(5天或以上)
- 產品類型
- 飲食
- 個人化和居家醫療
- 時尚與生活方式(配件、服裝、鞋類)
- 家具
- 電子設備及家用電器
- 其他
- 城市排名
- 排名第一
- 排名 2
- 第三名及以下
- 按州
- 中爪哇
- 東爪哇
- 西爪哇
- 雅加達
- 萬登
- 其他州
第6章 競爭情勢
- 市場集中度
- 策略趨勢
- 市佔率分析
- 公司簡介
- JNE Express
- J&T Express
- SiCepat Ekspres
- Ninja Xpress
- Lion Parcel
- Wahana Express
- TIKI
- Pos Indonesia
- Paxel
- DHL Express
- UPS
- FedEx
- GoSend(Gojek)
- Grab Express
- Shipper
- Shopee Express
- Lazada eLogistics
- Anteraja
- PopBox
- SF Express
第7章 市場機會與未來展望
According to Mordor Intelligence, the Indonesia e-commerce logistics market size is expected to grow from USD 5.27 billion in 2025 to USD 5.74 billion in 2026 and is forecasted to reach USD 8.71 billion by 2031, at 8.71% CAGR over 2026-2031.
This report is Segmented by Service (Transportation, Warehousing, and More), by Business Model (B2C, B2B, C2C), by Destination (Domestic, Cross-Border), by Delivery Speed (Same-Day, Next-Day, and More), by Product Category (Fashion, Electronics, and More), by City Tier (Tier 1, 2, and More), by Region (West Java, East Java, and More). The Market Forecasts are Provided in Terms of Value (USD).
Indonesia E-commerce Logistics Market Trends and Insights
Live-Stream & Social-Commerce Boom Drives Higher Parcel Frequency
Live-stream shopping compresses buying decisions, leading to more frequent, smaller-ticket orders that lift parcel counts per customer. TikTok Shop's December 2024 return, driven by a USD 1.5 billion partnership with Tokopedia, reached 3.2 million daily checkouts by March 2025. Users are placing 4.7 orders monthly, more than double traditional browsing activity, challenging logistics providers to process higher volumes without commensurate revenue per piece. Parcel density is higher in neighborhoods where influencers are headquartered, enabling route optimization but requiring flexible, on-demand pickups from home-based sellers. Rising compliance oversight under the Ministry of Trade transparency rules rewards established carriers with robust digital documentation. In aggregate, live-stream commerce adds an estimated 2.3 percentage points to the forecast CAGR of the Indonesia E-commerce Logistics Market.
Platform-Owned Captive Logistics Arms Extend Next-Hour Reach
Marketplaces internalize delivery to secure service quality and margin. Shopee Express already serves 487 cities and accounts for 41% of Shopee parcels, offering two-hour windows in 12 metros Lazada eLogistics operates 73 automated hubs processing 850,000 packages daily. Proprietary networks leverage demand visibility and inventory data to pre-position goods close to buyers, enabling predictive routing that supports next-hour commitments across dense corridors. However, the capital burden and draft marketplace regulations that require neutral access for third-party couriers could narrow their advantage. The shift pushes mid-tier independents toward niche capabilities, such as cold-chain or cross-border expertise, and is expected to lift the growth of the Indonesia E-commerce Logistics Market by roughly 1.9 percentage points during 2026-2031.
Urban Congestion & Low-Emission Zones Slow Last-Mile Drop Density
Jakarta peak-hour speeds fell to 11 km/h in 2025, reducing driver productivity and compelling fleet expansion to preserve service levels. Proposed low-emission zones will bar older diesel vans during daytime in core districts, disrupting 68% of existing routes. Surabaya and Bandung pilots impose similar access rules, burdening operators of aging fleets. Micro-fulfillment hubs and two-wheeler couriers partially offset congestion yet require expensive urban real estate. Altogether, regulatory and traffic headwinds are estimated to trim 1.3 percentage points from the CAGR of the Indonesia E-commerce Logistics Market in the near term.
Other drivers and restraints analyzed in the detailed report include:
- Cold-Chain Surge From Online Grocery, Vaccines & Pharma E-Tail
- Nation-Wide E-POD Mandate Cuts Return Losses
- Fuel-Price Volatility After Subsidy Reforms Inflates Delivery Costs
For complete list of drivers and restraints, kindly check the Table Of Contents.
Segment Analysis
Transportation retained 72.78% of 2025 revenue, yet value-added modules are projected to grow at a 10.39% CAGR, widening their slice of the Indonesia E-commerce Logistics Market share. Merchants now view branded packaging, kitting, and returns orchestration as core to customer retention. Authentication and pre-delivery inspection reduced return rates for fashion and electronics by up to 25%. At the same time, the road-based backbone benefits from new toll corridors, such as the 117-kilometer Semarang-Demak expressway that cuts Central Java transit times by 35%. Sea freight continues to link the archipelago, though low sailing frequencies east of Java preserve multi-day windows.
Warehousing absorbs surging inventory as platforms decentralize stock. Modern Grade-A supply grew markedly across the industrial belts of Jakarta, Surabaya, and Bandung, supporting same-day delivery. Even without rail expansion, multi-modal nodes integrate air cargo uplift where wide-body conversions bolstered dedicated capacity by 22% in 2025. Strategic interplay between core transport and wrap-around services therefore sets the pace for value creation inside the Indonesia E-commerce Logistics Market.
B2C channels maintained a leading 75.23% share in the Indonesia E-commerce Logistics Market size in 2025. However, C2C parcels are forecast to grow 13.40% annually, resulting in outsized parcel counts relative to ticket value. Peer-to-peer marketplaces, live-stream influencers, and resale apps collectively registered 127 million trades in 2025, demanding residential pickups, lightweight packaging, and escrow-anchored returns. Dropship models blur traditional lines, forcing carriers to harmonize B2C service levels with C2C variability.
Large marketplaces continue to wield scale leverage, pressuring courier tariffs yet enabling collaborative forecasting that improves route fill rates. Meanwhile, enterprises digitize procurement workflows, prompting steady B2B logistics demand for just-in-time restocks and system integration. The Indonesia E-commerce Logistics Market size linked to C2C therefore broadens overall service portfolios and accelerates the adoption of mobile point-of-sale tools for informal merchants.
Complete Report Scope:
- By Service
- Transportation
- Road
- Rail
- Air
- Sea
- Warehousing & Fulfilment
- Value-Added Services (Labelling, Packaging, Kitting)
- Transportation
- By Business Model
- B2C
- B2B
- C2C
- By Destination
- Domestic
- Cross-border (international)
- By Delivery Speed
- Same-day (less than 24 h)
- Next-day (24-48 h)
- Standard (3-5 days)
- Others (more than 5 days)
- By Product Category
- Foods & Beverages
- Personal & Household Care
- Fashion & Lifestyle (accessories, apparel, footwear)
- Furniture
- Consumer Electronics & Household Appliances
- Other Products
- By City Tier
- Tier 1
- Tier 2
- Tier 3 and Below
- By Provinces
- Central Java
- East Java
- West Java
- Jakarta
- Banten
- Rest of Provinces
List of Companies Covered in this Report:
- JNE Express
- J&T Express
- SiCepat Ekspres
- Ninja Xpress
- Lion Parcel
- Wahana Express
- TIKI
- Pos Indonesia
- Paxel
- DHL Express
- UPS
- FedEx
- GoSend (Gojek)
- Grab Express
- Shipper
- Shopee Express
- Lazada eLogistics
- Anteraja
- PopBox
- SF Express
Additional Benefits:
- The market estimate (ME) sheet in Excel format
- 3 months of analyst support
TABLE OF CONTENTS
1 Introduction
- 1.1 Study Assumptions & Market Definition
- 1.2 Scope of the Study
2 Research Methodology
3 Executive Summary
4 Market Landscape
- 4.1 Market Overview
- 4.2 Market Drivers
- 4.2.1 Live-Stream & Social-Commerce Boom Drives Higher Parcel Frequency
- 4.2.2 Platform-Owned "Captive" Logistics Arms Extend Next-Hour Reach
- 4.2.3 Cold-Chain Surge from Online Grocery, Vaccines & Pharma E-Tail
- 4.2.4 Nation-Wide E-POD (Electronic Proof-Of-Delivery) Mandate Cuts Return Losses
- 4.2.5 Carbon-Credit Incentives Accelerate Electric Van And E-Bike Fleets
- 4.2.6 5G Private Networks in Mega-Fulfilment Hubs Enable Real-Time Robotics
- 4.3 Market Restraints
- 4.3.1 Urban Congestion & Low-Emission Zones Slow Last-Mile Drop Density
- 4.3.2 Fuel-Price Volatility After Subsidy Reforms Inflates Delivery Costs
- 4.3.3 Upcoming Compulsory E-Invoices Add Compliance Delays for MSME Sellers
- 4.3.4 Lack of Battery-Recycling Capacity Hampers Electric-Fleet Scalability
- 4.4 Value / Supply-Chain Analysis
- 4.5 Regulatory Landscape
- 4.6 Technological Outlook
- 4.7 Demand & Supply Analysis
- 4.8 Industry Attractiveness - Porter's Five Forces
- 4.8.1 Threat of New Entrants
- 4.8.2 Bargaining Power of Buyers
- 4.8.3 Bargaining Power of Suppliers
- 4.8.4 Threat of Substitutes
- 4.8.5 Competitive Rivalry
- 4.9 Reverse / Return Logistics Insights
- 4.10 Impact of Geo-Political Events on Supply Chain Shifts
5 Market Size & Growth Forecasts
- 5.1 By Service
- 5.1.1 Transportation
- 5.1.1.1 Road
- 5.1.1.2 Rail
- 5.1.1.3 Air
- 5.1.1.4 Sea
- 5.1.2 Warehousing & Fulfilment
- 5.1.3 Value-Added Services (Labelling, Packaging, Kitting)
- 5.1.1 Transportation
- 5.2 By Business Model
- 5.2.1 B2C
- 5.2.2 B2B
- 5.2.3 C2C
- 5.3 By Destination
- 5.3.1 Domestic
- 5.3.2 Cross-border (international)
- 5.4 By Delivery Speed
- 5.4.1 Same-day (less than 24 h)
- 5.4.2 Next-day (24-48 h)
- 5.4.3 Standard (3-5 days)
- 5.4.4 Others (more than 5 days)
- 5.5 By Product Category
- 5.5.1 Foods & Beverages
- 5.5.2 Personal & Household Care
- 5.5.3 Fashion & Lifestyle (accessories, apparel, footwear)
- 5.5.4 Furniture
- 5.5.5 Consumer Electronics & Household Appliances
- 5.5.6 Other Products
- 5.6 By City Tier
- 5.6.1 Tier 1
- 5.6.2 Tier 2
- 5.6.3 Tier 3 and Below
- 5.7 By Provinces
- 5.7.1 Central Java
- 5.7.2 East Java
- 5.7.3 West Java
- 5.7.4 Jakarta
- 5.7.5 Banten
- 5.7.6 Rest of Provinces
6 Competitive Landscape
- 6.1 Market Concentration
- 6.2 Strategic Moves
- 6.3 Market Share Analysis
- 6.4 Company Profiles (includes Global-level Overview, Market-level Overview, Core Segments, Financials, Strategic Information, Market Rank/Share, Products & Services, Recent Developments)
- 6.4.1 JNE Express
- 6.4.2 J&T Express
- 6.4.3 SiCepat Ekspres
- 6.4.4 Ninja Xpress
- 6.4.5 Lion Parcel
- 6.4.6 Wahana Express
- 6.4.7 TIKI
- 6.4.8 Pos Indonesia
- 6.4.9 Paxel
- 6.4.10 DHL Express
- 6.4.11 UPS
- 6.4.12 FedEx
- 6.4.13 GoSend (Gojek)
- 6.4.14 Grab Express
- 6.4.15 Shipper
- 6.4.16 Shopee Express
- 6.4.17 Lazada eLogistics
- 6.4.18 Anteraja
- 6.4.19 PopBox
- 6.4.20 SF Express
7 Market Opportunities & Future Outlook
- 7.1 White-space & Unmet-need Assessment

 全球電子商務物流市場規模、佔有率、趨勢和成長分析報告(2026-2034年)
 英國電子商務物流:市場佔有率分析、產業趨勢與統計、成長預測(2026-2031)印度電子商務物流:市場佔有率分析、行業趨勢和統計數據以及成長預測(2026-2031 年)東協電子商務物流:市場佔有率分析、產業趨勢與統計及成長預測(2026-2031年)
 電子商務物流市場:全球市場預測(2026-2032)中國跨境電商物流:市佔率分析、產業趨勢與統計及成長預測(2026-2031年)中國電子商務物流:市場佔有率分析、產業趨勢與統計及成長預測(2026-2031年)印度跨境B2C電子商務物流:市場佔有率分析、產業趨勢與統計及成長預測(2026-2031年)美國跨境電子商務物流:市場佔有率分析、產業趨勢與統計及成長預測(2026-2031)越南跨境B2C電子商務物流:市場佔有率分析、產業趨勢與統計及成長預測(2026-2031年)