


 |
市場調查報告書
商品編碼
1693536
南美微量營養素肥料:市場佔有率分析、行業趨勢和成長預測(2025-2030 年)South America Micronutrient Fertilizer - Market Share Analysis, Industry Trends & Statistics, Growth Forecasts (2025 - 2030) |
||||||
價格
※ 本網頁內容可能與最新版本有所差異。詳細情況請與我們聯繫。
簡介目錄
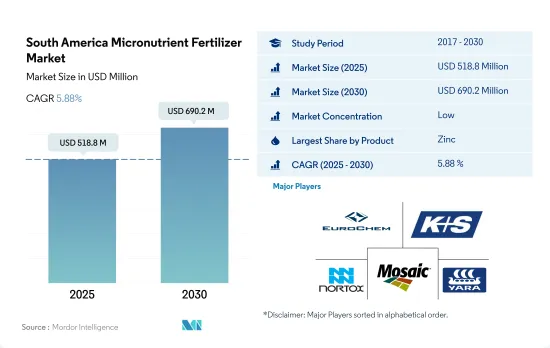
南美微量營養素肥料市場規模預計在 2025 年將達到 5.188 億美元,預計到 2030 年將達到 6.902 億美元,預測期內(2025-2030 年)的複合年成長率為 5.88%。
該地區對鋅的需求很高,因為需要解決鋅缺乏問題,以提高作物產量。
- 微量營養素對許多植物代謝活動至關重要,包括細胞壁發育、花粉產生、發芽、葉綠素產生、固氮和蛋白質合成。微量營養素肥料佔整個肥料市場的佔有率不到 2%,到 2022 年將達到約 5.477 億美元。
- 在微量營養素肥料中,鐵是2022年該地區最常用的微量營養素肥料之一。鐵將佔微量營養素肥料總市場的約8.5%,到2022年將達到約4,660萬美元。鐵是參與能量轉移、氮還原和固定以及木質素形成的多種酶的組成部分。
- 鋅作為微量營養素肥料的使用量是該地區僅次於鐵的最高水平。鋅缺乏是該地區普遍存在的問題,尤其是南美洲西北部。鋅將佔微量營養素肥料市場總量的約 27.5%,到 2022 年將達到約 1.505 億美元。
- 大豆和小麥種植面積約佔該地區農業用地總面積的61.13%。這兩種作物極易受到錳缺乏的影響。到 2022 年,錳將佔微量營養素肥料市場總量的約 3.7%。
- 其他微量營養素包括鎳、鈷、硒和氯化物。其他微量營養素部分將佔該地區微量營養素肥料市場總量的 11.8%,到 2022 年將達到約 6,460 萬美元。
- 儘管大多數微量營養素都存在於土壤中,但大多數在自然界中是不可移動的,不能被植物吸收。因此,該地區對微量營養素肥料的需求正在增加。
土壤養分缺乏導致巴西市場佔有率大幅下降
- 巴西在南美洲微量營養素肥料市場佔據主導地位,2022 年達到 3.317 億美元,約佔整個市場的 60.6%。預計到 2030 年底,巴西的微量營養素肥料市場規模將增至 3.822 億美元,這得益於耕地面積的增加,2017 年至 2022 年間耕地面積增加了約 14.8%。
- 2022年阿根廷微量營養素肥料市場中,田間作物佔據了97.7%的市場。這一優勢是由於該國田間作物的種植面積廣闊。阿根廷主要種植田間作物為大豆、小麥和玉米,三者佔全國作物總種植面積的97.7%。同時,2022年阿根廷園藝作物微量營養素肥料的消耗量價值為284萬美元,預計2030年將達到390萬美元。
- 依施用類型分類,至2022年,土壤施用將佔微量營養素消費量的95.1%,其次是灌溉施用,佔2.5%,葉面施用佔2.3%。
- 農民正在作物中施用微量營養素肥料,以獲得高品質的農產品和更高的產量。植物生長所必需的微量營養素缺乏會導致作物產量下降。在過去的十年中,人們的注意力集中在土壤微量營養素缺乏上,主要是鋅、硼和鉬。南美洲西北部土壤普遍缺鋅。因此,預計巴西微量營養素肥料市場將在 2023-2030 年期間成長。
南美洲微量營養素肥料市場趨勢
政府為自給自足而採取的措施極大地促進了田間作物種植面積的擴大
- 南美洲田間作物種植面積預計將從 2017 年的 1.116 億公頃增加 12.8% 至 2022 年的 1.261 億公頃。種植面積的擴大預計將推動該地區對化肥的需求。田間作物佔比最大,為96.8%。 2022年,巴西將佔據56.9%的佔有率,其次是阿根廷,佔29.3%。巴西是全球大豆生產和出口大國,2021年大豆產量接近1.35億噸,其中出口1.055億噸,佔82%。出口產品中,生豆佔82%,豆餅佔16%,豆油佔2%。
- 在南美洲,巴西和阿根廷是大豆種植最多的國家,分別佔全球種植面積的64.4%和26.1%。然而,該地區目前正遭受長期乾旱,主要河流的水位低得驚人。這產生了廣泛的影響,擾亂了重要夏季作物(特別是大豆)的收穫和運輸。因此,這種情況增加了南美洲增加化肥施用的迫切性。
- 受全球強勁需求和良好盈利的推動,南方共同市場地區的大豆種植業蓬勃發展。大豆等原料價格高企,鼓勵生產商擴大經營,投資新土地設備,提高規模和效率。因此,該地區準備進一步擴大田間作物種植,以滿足國內和國際市場的成長。
2022 年,所有微量營養素的最高平均施用量為錳,約 12.2 公斤/公頃。
- 南美洲的土壤主要為氧化土和老成土。氧化土是高度風化的土壤,質地均勻,含有大量的鐵和鋁的氧化物,而紅壤則風化程度較低,但酸性很強。然而,這兩種土壤類型都需要補充微量營養素來最佳化作物產量,因為土壤中的大多數微量營養素是不穩定的。在南美洲,微量營養素缺乏日益限制一年作物的生產。據報導,水稻、玉米、小麥、大豆和芸豆等作物缺乏鋅、銅、硼、錳和鐵等必需微量營養素。
- 2022年大田作物微肥平均施用量為4.3公斤/公頃。儘管這些土壤中含有鐵,但由於與過量的磷酸鹽結合,植物對鐵的利用受到限制。因此,該地區田間作物的平均鐵施用量為3.3公斤/公頃。錳是微量營養素中最重要的元素,2022 年的平均施用率為 12.2 公斤/公頃。錳在陸稻中很常見,但在雨養稻和低地稻中較不常見,因為錳在澇漬條件下溶解度會增加。缺錳的水稻植株在犁地期間會生長不良、葉片數量減少、重量減輕、根系變小。
- 油菜是南美洲的主要田間作物,比其他作物需要更多的微量營養素。 2022年微量元素肥平均施用量達4.40公斤/公頃。隨著人們越來越重視作物均衡營養以及微量營養素在產量中的關鍵作用,預計未來幾年微量營養素的應用將會增加。
南美洲微量營養素肥料產業概況
南美洲微量營養素肥料市場較為分散,前五大公司佔了28.08%的市佔率。該市場的主要企業包括 EuroChem Group、K+S Aktiengesellschaft、Nortox、The Mosaic Company、Yara International ASA 等。
其他福利
- Excel 格式的市場預測 (ME) 表
- 3個月的分析師支持
目錄
第1章執行摘要和主要發現
第2章 報告要約
第3章 引言
- 研究假設和市場定義
- 研究範圍
- 調查方法
第4章 產業主要趨勢
- 主要作物種植面積
- 田間作物
- 園藝作物
- 平均養分施用量
- 微量營養素
- 田間作物
- 園藝作物
- 微量營養素
- 灌溉農田
- 法律規範
- 價值鍊和通路分析
第5章市場區隔
- 產品
- 硼
- 銅
- 鐵
- 錳
- 鉬
- 鋅
- 其他
- 如何申請
- 受精
- 葉面噴布
- 土壤
- 作物類型
- 田間作物
- 園藝作物
- 草坪和觀賞植物
- 原產地
- 阿根廷
- 巴西
- 南美洲其他地區
第6章 競爭格局
- 關鍵策略趨勢
- 市場佔有率分析
- 商業狀況
- 公司簡介
- BMS Micro-Nutrients NV
- EuroChem Group
- Grupa Azoty SA(Compo Expert)
- Haifa Group
- ICL Group Ltd
- Inquima LTDA
- K+S Aktiengesellschaft
- Nortox
- The Mosaic Company
- Yara International ASA
第7章 CEO 的關鍵策略問題
第 8 章 附錄
- 世界概況
- 概述
- 五力分析框架
- 全球價值鏈分析
- 市場動態(DRO)
- 資訊來源及延伸閱讀
- 圖片列表
- 關鍵見解
- 數據包
- 詞彙表
簡介目錄
Product Code: 92601
The South America Micronutrient Fertilizer Market size is estimated at 518.8 million USD in 2025, and is expected to reach 690.2 million USD by 2030, growing at a CAGR of 5.88% during the forecast period (2025-2030).
The demand for zinc is higher in the region due to the need to address deficiency to optimize crop yield
- Micronutrients are vital for many plant metabolic activities, such as cell wall development, pollen creation, germination, chlorophyll production, nitrogen fixation, and protein synthesis. Micronutrient fertilizers account for less than two percent of the total fertilizer market value, which amounted to about USD 547.7 million in 2022.
- Among micronutrient fertilizers, iron is one of the most commonly used micronutrient fertilizer in the region in 2022. Iron accounted for about 8.5% of the total micronutrient fertilizer market value, amounting to about USD 46.6 million in 2022. Iron is a component of many enzymes associated with energy transfer, nitrogen reduction and fixation, and lignin formation.
- The application of zinc as a micronutrient fertilizer is the highest in the region, after iron. Zinc deficiency is a widespread problem in the region, particularly in the northwestern region of South America. Zinc accounts for about 27.5% of the total micronutrient fertilizer market value, which amounted to about USD 150.5 million in 2022.
- Soybean and wheat cultivation accounts for about 61.13% of the total agricultural land in the region. These two crops are most likely to suffer from manganese deficiency. Manganese accounted for about 3.7% of the total micronutrient fertilizer market value in 2022.
- Nickel, cobalt, selenium, and chloride are the other micronutrients. The total other micronutrient segment accounts for 11.8% of the region's total micronutrient fertilizer market value, which amounted to about USD 64.6 million in 2022.
- Even though most micronutrients are available in soils, most are immobile in nature and not available for plant uptake. Hence, the demand for micronutrient fertilizers is increasing in the region.
Nutrient deficiencies in the country's soils translate to a major market share for Brazil
- Brazil dominated the South American micronutrient fertilizer market, accounting for about 60.6% of the total market value, amounting to USD 331.7 million in 2022. The Brazilian micronutrient fertilizer market segment is anticipated to increase to USD 382.2 million by the end of 2030, owing to the growing cultivation area, which increased by about 14.8% from 2017 to 2022.
- Field crops dominated the Argentine micronutrient fertilizer market with a 97.7% market value share in 2022. This dominance was attributed to the larger area occupied by field crops in the country. Major field crops grown in Argentina are soybean, wheat, and maize, which together account for 97.7% of the total crop area. Meanwhile, micronutrient fertilizers consumption by horticultural crops in Argentina was valued at USD 2.84 million in 2022 and is anticipated to reach USD 3.9 million by 2030.
- By application type, soil application dominated micronutrient consumption, accounting for 95.1% of the total volume, followed by fertigation with a 2.5% share and foliar application with a 2.3% share in 2022.
- Farmers are adopting micronutrient fertilizers for their crops to achieve high-quality produce and better yields. Deficiency in micronutrients that are essential for plant growth can lead to lower crop yields. During the past decade, soil micronutrient deficiencies were noticed primarily for zinc, boron, and molybdenum. Soil deficiencies of zinc are widespread in the northwestern region of South America. Hence, the micronutrient fertilizers market in Brazil is expected to grow from 2023 to 2030.
South America Micronutrient Fertilizer Market Trends
The government's initiatives to achieve self-sufficiency have significantly contributed to the increased field crop cultivation
- The cultivation area for field crops in South America witnessed growth from 111.6 million ha in 2017 to 126.1 million ha in 2022, marking a 12.8% increase. This expansion in cultivation is projected to drive up the demand for fertilizers in the region. Field crops dominated the landscape, accounting for a substantial 96.8% share. In 2022, Brazil held the lion's share of the market at 56.9%, with Argentina trailing at 29.3%. Brazil, known as the global leader in soy production and exports, saw its soy output touch nearly 135 million tonnes in 2021. Out of this, a significant 105.5 million tonnes, or 82%, was exported, with 82% in raw soybean form, 16% as soybean cake, and 2% as soybean oil.
- Soybean cultivation reigns supreme in South America, with Brazil and Argentina leading the pack, accounting for 64.4% and 26.1% of the cultivated area, respectively. However, the region is currently grappling with an extended drought, leading to alarmingly low water levels in major rivers. This has far-reaching consequences, hampering both harvests and the transportation of crucial summer crops, especially soybeans. Consequently, this situation amplifies the urgency of increasing fertilizer applications in South America.
- Driven by robust global demand and favorable profitability, soybean cultivation in the Mercosur region has witnessed a surge. The price surge in raw materials, including soy, has incentivized producers to expand their operations, investing in new lands and equipment to enhance their scale and efficiency. As a result, the region is poised for further expansion in its field crop cultivation, aligning with the growth in both domestic and international markets.
In 2022, the highest average application rate among micronutrients is for manganese, approximately 12.2 kg/hectare
- Oxisols and ultisols dominate the South American soil landscape. Oxisols, characterized by high weathering, uniform texture, and abundant iron and aluminum oxides, contrast with ultisols, which are less weathered but more acidic. However, both soil types necessitate micronutrient supplementation for optimal crop yields, given the immobility of most micronutrients in the soil. Micronutrient deficiencies are increasingly limiting annual crop production in South America. Crops like rice, corn, wheat, soybean, and common bean have reported deficits in essential micronutrients such as zinc, copper, boron, manganese, and iron.
- In 2022, the average application rate of micronutrient fertilizers in field crops stood at 4.3 kg/hectare. Despite the presence of iron in these soils, its availability to plants is hampered by its binding with excessive phosphates. Consequently, the average iron application rate in field crops across the region is 3.3 kg/hectare. Manganese, with an average application rate of 12.2 kg/hectare in 2022, leads among the micronutrients. While it is prevalent in upland rice, it is less common in rainfed or lowland rice, as its solubility increases under submerged conditions. Manganese-deficient plants exhibit stunted growth, fewer leaves, reduced weight, and smaller root systems during tillering.
- Rapeseed, a prominent field crop in South America, demands higher micronutrient quantities compared to others. In 2022, its average micronutrient fertilizer application rate reached 4.40 kg/hectare. Given the growing emphasis on balanced crop nutrition and the pivotal role of micronutrients in overall yield, an uptick in micronutrient application is anticipated in the coming years.
South America Micronutrient Fertilizer Industry Overview
The South America Micronutrient Fertilizer Market is fragmented, with the top five companies occupying 28.08%. The major players in this market are EuroChem Group, K+S Aktiengesellschaft, Nortox, The Mosaic Company and Yara International ASA (sorted alphabetically).
Additional Benefits:
- The market estimate (ME) sheet in Excel format
- 3 months of analyst support
TABLE OF CONTENTS
1 EXECUTIVE SUMMARY & KEY FINDINGS
2 REPORT OFFERS
3 INTRODUCTION
- 3.1 Study Assumptions & Market Definition
- 3.2 Scope of the Study
- 3.3 Research Methodology
4 KEY INDUSTRY TRENDS
- 4.1 Acreage Of Major Crop Types
- 4.1.1 Field Crops
- 4.1.2 Horticultural Crops
- 4.2 Average Nutrient Application Rates
- 4.2.1 Micronutrients
- 4.2.1.1 Field Crops
- 4.2.1.2 Horticultural Crops
- 4.2.1 Micronutrients
- 4.3 Agricultural Land Equipped For Irrigation
- 4.4 Regulatory Framework
- 4.5 Value Chain & Distribution Channel Analysis
5 MARKET SEGMENTATION (includes market size in Value in USD and Volume, Forecasts up to 2030 and analysis of growth prospects)
- 5.1 Product
- 5.1.1 Boron
- 5.1.2 Copper
- 5.1.3 Iron
- 5.1.4 Manganese
- 5.1.5 Molybdenum
- 5.1.6 Zinc
- 5.1.7 Others
- 5.2 Application Mode
- 5.2.1 Fertigation
- 5.2.2 Foliar
- 5.2.3 Soil
- 5.3 Crop Type
- 5.3.1 Field Crops
- 5.3.2 Horticultural Crops
- 5.3.3 Turf & Ornamental
- 5.4 Country
- 5.4.1 Argentina
- 5.4.2 Brazil
- 5.4.3 Rest of South America
6 COMPETITIVE LANDSCAPE
- 6.1 Key Strategic Moves
- 6.2 Market Share Analysis
- 6.3 Company Landscape
- 6.4 Company Profiles
- 6.4.1 BMS Micro-Nutrients NV
- 6.4.2 EuroChem Group
- 6.4.3 Grupa Azoty S.A. (Compo Expert)
- 6.4.4 Haifa Group
- 6.4.5 ICL Group Ltd
- 6.4.6 Inquima LTDA
- 6.4.7 K+S Aktiengesellschaft
- 6.4.8 Nortox
- 6.4.9 The Mosaic Company
- 6.4.10 Yara International ASA
7 KEY STRATEGIC QUESTIONS FOR FERTILIZER CEOS
8 APPENDIX
- 8.1 Global Overview
- 8.1.1 Overview
- 8.1.2 Porter's Five Forces Framework
- 8.1.3 Global Value Chain Analysis
- 8.1.4 Market Dynamics (DROs)
- 8.2 Sources & References
- 8.3 List of Tables & Figures
- 8.4 Primary Insights
- 8.5 Data Pack
- 8.6 Glossary of Terms
02-2729-4219
+886-2-2729-4219
 2026年全球微量元素肥料市場報告
 微量元素肥料市場報告:趨勢、預測與競爭分析(至2031年)
 中國微量營養素肥料市場佔有率分析、產業趨勢與統計、成長預測(2025-2030年)中東和非洲微量營養素肥料:市場佔有率分析、行業趨勢、統計數據、成長預測(2025-2030 年)亞太地區微量營養素肥料:市場佔有率分析、產業趨勢和成長預測(2025-2030 年)北美微量營養素肥料:市場佔有率分析、行業趨勢和成長預測(2025-2030 年)印度微量營養素肥料:市場佔有率分析、行業趨勢和統計數據、成長預測(2025-2030 年)微量營養素肥料:市場佔有率分析、產業趨勢與統計、成長預測(2025-2030 年)歐洲微量營養素肥料市場佔有率分析、產業趨勢與成長預測(2025-2030年)美國微量營養素肥料:市場佔有率分析、行業趨勢和統計數據、成長預測(2025-2030 年)
▼