


 |
市場調查報告書
商品編碼
1693528
北美微量營養素肥料:市場佔有率分析、行業趨勢和成長預測(2025-2030 年)North America Micronutrient Fertilizer - Market Share Analysis, Industry Trends & Statistics, Growth Forecasts (2025 - 2030) |
||||||
※ 本網頁內容可能與最新版本有所差異。詳細情況請與我們聯繫。
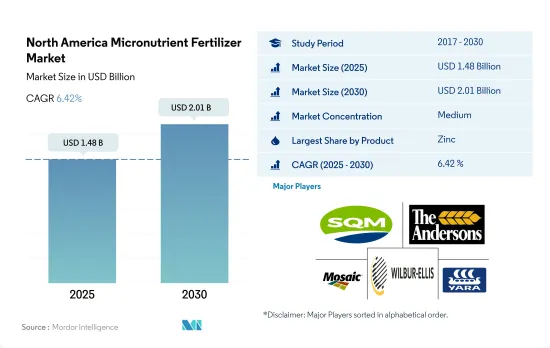
北美微量營養素肥料市場規模預計在 2025 年為 14.8 億美元,預計到 2030 年將達到 20.1 億美元,預測期內(2025-2030 年)的複合年成長率為 6.42%。
預計擴大種植和提高品質和產量對微量營養素的需求將推動對微量營養素的需求。
- 微量營養素對於植物的生長至關重要。它對平衡作物營養起著重要作用。任何微量營養素的缺乏都會限制植物的生長。微量營養素肥料含有硼、銅、錳、鋅和鈷等元素。植物需要少量這些物質。
- 按作物類型分類,2022年田間作物價值最高,為12.6億美元,消費量為39.92萬噸。同期,田間作物約佔北美農地面積的88.7%。
- 傳統微量營養素肥料佔市場佔有率的79.0%,2022年價值11.2億美元。預計到2030年將達到15.7億美元。特種肥料將佔市場佔有率的21.0%,2022年價值2.987億美元。預計到2030年底將達到4.351億美元。
- 2022 年,鋅將佔北美微量營養素肥料市場的 27.0%,成為價值最大的微量營養素。鋅是植物酵素系統的關鍵組成部分。鋅有助於激活各種酵素並促進碳水化合物代謝。鋅缺乏在華盛頓州的果園、玉米和小麥中特別常見,主要導致植物發育不良和小葉失調。
- 2022 年,銅將佔北美微量營養素肥料市場的 17.3%。加拿大西部普遍存在銅缺乏現象,限制了作物生長並降低了產量潛力。預計 2023 年至 2030 年間銅肥市場將以 5.3% 的複合年成長率成長。
提高土壤肥力和營養缺乏的需求將推動市場成長
- 美國擁有近9880萬公頃農田,是北美最大的農業生產國。 2022 年,美國佔據北美微量營養素肥料市場的大部分佔有率,為 56.9%。
- 2022年,美國作物種植面積達1.397億公頃,與前一年同期比較增加1%。耕地面積的擴大與土壤養分缺乏的增加導致對微量營養素肥料的依賴增加相吻合。
- 加拿大是北美第二大農業用地國,擁有約3,090萬公頃農業用地。 2022 年,加拿大在該地區微量營養素肥料市場佔有 14.2% 的佔有率。加拿大超過 88.0% 的農業用地用於種植作物,主要集中在草原地區、魁北克省和安大略省南部。
- 2022 年,墨西哥成為微量營養素肥料市場的重要參與企業,市佔率為 26.6%,產量佔有率為 26.4%。田間作物在墨西哥微量營養素肥料市場中佔據主導地位,佔總量的88.3%。其次是園藝作物,佔 7.0%,草皮和觀賞作物佔剩餘的 4.7%。墨西哥主要的田間作物包括玉米、甘蔗和小麥。
- 2022年,北美其他地區將佔微量營養素肥料市場總量的2.4%。多明尼加共和國、薩爾瓦多和尼加拉瓜等該領域的國家依賴進口肥料,並且嚴重依賴進口農產品。
- 北美微量營養素肥料市場一直保持穩定成長態勢,預計未來將持續擴大。推動這一成長的是人們日益認知到微量營養素在確保作物強勁生長方面發揮著至關重要的作用。
北美微量營養素肥料市場趨勢
補貼和其他政府支持有助於擴大田間作物
- 北美的農場種植多種作物,主要是田間作物。玉米、棉花、水稻、大豆和小麥是該地區的主要田間作物。美國、加拿大和墨西哥對該地區的農業生產貢獻巨大。 2022年,田間作物將佔北美總種植面積的約97.6%,其中穀物和油籽佔據市場主導地位。
- 從國家來看,美國佔市場主導地位,作物總種植面積達 1.357 億公頃。其中,大田作物和園藝佔種植面積的大部分,2022年分別佔97.2%和2.8%。然而,2018年至2019年間,該國作物種植面積大幅下降,主要原因是德克薩斯州和休士頓等地發生嚴重洪澇災害,環境條件不利。
- 最大的栽培作物是玉米,大部分種植在被稱為「玉米帶」的地區。玉米帶是美國中西部的傳統地區,涵蓋印第安納州西部、伊利諾州、愛荷華州、密蘇裡州、內布拉斯加州東部和堪薩斯州東部的大部分地區,主要作物玉米和大豆。美國也是米的主要出口國。該地區的水稻種植主要集中在四個地區,其中三個在南部,一個在加州。因此,該地區田間作物市場潛力的不斷增加,加上政府資金投入和保護力度的加大,預計將積極推動該地區田間作物面積的擴大。
微量營養素缺乏和作物損失增加導致微量營養素施用率增加
- 2022年,錳、銅、鋅、鐵、硼施用量最高,分別為10.6公斤/公頃、6.9公斤/公頃、6.8公斤/公頃、3.3公斤/公頃、1.5公斤/公頃。大多數微量營養素在作物中的吸收率較低,但其可用性會嚴重限制植物的重要功能,導致植物異常、生長不良和產量下降。產量、商品價格和投入成本的上升使得農民開始仔細檢視糧食生產的潛在障礙,包括微量營養素缺乏。
- 微量元素肥料消費量以小麥、高粱、大豆和棉花為主,玉米和水稻等其他田間作物比例較少。小麥尤其面臨嚴重的銅和錳缺乏問題,鐵和鋅缺乏也會輕微影響產量。
- 每種作物的微量營養素需求受到當地土壤條件的影響。在美國,東南部的砂質土壤有機質含量低,容易淋溶,通常缺乏硼,與東北部肥沃的黑土不同。同樣,加拿大亞伯達省中部的一些田地缺乏種植糧食所必需的銅。
- 墨西哥所有農業土壤都缺鋅。然而,這種情況在克雷塔羅州、索諾拉州和錫那羅亞州更為普遍,顯示對鋅微量營養素肥料的需求增加。北美土壤天然缺乏微量營養素,因此在種植過程中經常需要消耗微量營養素補充劑。
北美微量營養素肥料產業概況
北美微量營養素肥料市場適度整合,前五大公司佔63.51%。該市場的主要企業包括 Sociedad Quimica y Minera de Chile SA、The Andersons Inc.、The Mosaic Company、Wilbur-Ellis Company LLC、Yara International ASA 等。
其他福利
- Excel 格式的市場預測 (ME) 表
- 3個月的分析師支持
目錄
第1章執行摘要和主要發現
第2章 報告要約
第3章 引言
- 研究假設和市場定義
- 研究範圍
- 調查方法
第4章 產業主要趨勢
- 主要作物種植面積
- 田間作物
- 園藝作物
- 平均養分施用量
- 微量營養素
- 田間作物
- 園藝作物
- 微量營養素
- 灌溉農田
- 法律規範
- 價值鍊和通路分析
第5章市場區隔
- 產品
- 硼
- 銅
- 鐵
- 錳
- 鉬
- 鋅
- 其他
- 如何申請
- 受精
- 葉面噴布
- 土壤
- 作物類型
- 田間作物
- 園藝作物
- 草坪和觀賞植物
- 原產地
- 加拿大
- 墨西哥
- 美國
- 北美其他地區
第6章競爭格局
- 關鍵策略趨勢
- 市場佔有率分析
- 商業狀況
- 公司簡介
- Haifa Group
- Koch Industries Inc.
- Nouryon
- Sociedad Quimica y Minera de Chile SA
- The Andersons Inc.
- The Mosaic Company
- Wilbur-Ellis Company LLC
- Yara International ASA
第7章:CEO面臨的關鍵策略問題
第 8 章 附錄
- 世界概況
- 概述
- 五力分析框架
- 全球價值鏈分析
- 市場動態(DRO)
- 資訊來源及延伸閱讀
- 圖片列表
- 關鍵見解
- 數據包
- 詞彙表
The North America Micronutrient Fertilizer Market size is estimated at 1.48 billion USD in 2025, and is expected to reach 2.01 billion USD by 2030, growing at a CAGR of 6.42% during the forecast period (2025-2030).
Expansion of cultivation and the need for micronutrients to enhance quality and yield are anticipated to drive the demand for micronutrients
- Micronutrients are essential for plant growth. They play an important role in balanced crop nutrition. The lack of any of the micronutrients may limit plant growth. Micronutrient fertilizers contain elements like boron, copper, manganese, zinc, and cobalt. Plants require these substances in small quantities.
- By crop type, field crops recorded the highest value of USD 1.26 billion and a consumption volume of 399.2 thousand metric tons in 2022. Field crops accounted for about 88.7% of agricultural land in North America during the same period.
- The conventional micronutrient fertilizers segment accounted for 79.0% of the market share and was valued at USD 1.12 billion in 2022. It is anticipated to reach USD 1.57 billion by 2030. The specialty fertilizers segment accounted for 21.0% and was valued at USD 298.7 million in 2022. It is expected to reach USD 435.1 million by the end of 2030.
- In 2022, zinc accounted for 27.0% of the total micronutrient fertilizer market in North America and is the largest valued micronutrient. Zinc is a major component of plant enzyme systems. Zinc aids in the activation of various types of enzymes, boosting carbohydrate metabolism. Zinc deficiency is particularly common in Washington orchards, maize, and wheat, and it primarily causes stunted growth and little leaf disorder.
- Copper accounted for 17.3% of the North American micronutrient fertilizers market in 2022. Copper deficiency is becoming more widespread across Western Canada, limiting the growth of the crop and reducing yield potential because the natural stores of copper have been depleted by plants that take up copper in higher amounts. The copper fertilizer market is anticipated to witness a CAGR of 5.3% during 2023-2030.
The need to improve soil fertility and nutrient deficiency will fuel the growth of the market
- With nearly 98.8 million hectares of agricultural land, the United States dominates as North America's top agriculture producer. In 2022, the US commanded a significant 56.9% share of the North American market for micronutrient fertilizers.
- In 2022, crop cultivation in the US covered 139.7 million hectares, a 1% increase from the previous year. This expansion in cultivated areas has coincided with a growing reliance on micronutrient fertilizers, driven by escalating soil nutrient deficiencies.
- Canada, the second-largest agricultural landowner in North America, boasted around 30.9 million hectares. In 2022, Canada held a 14.2% share of the region's micronutrient fertilizer market. Over 88.0% of Canada's agricultural land is dedicated to crops, with notable concentrations in the Prairies, Quebec, and Southern Ontario.
- In 2022, Mexico emerged as a significant player in the micronutrient fertilizer market, capturing a 26.6% share in market value and 26.4% in volume. Field crops dominated Mexico's micronutrient fertilizer market, accounting for 88.3% of the total volume. Horticulture crops followed at 7.0%, with turf & ornamental crops making up the remaining 4.7%. Key field crops in Mexico include corn, sugarcane, and wheat.
- Other North American countries collectively contributed 2.4% to the total micronutrient fertilizer market value in 2022. Nations like the Dominican Republic, El Salvador, and Nicaragua, in this segment, rely on fertilizer imports and heavily depend on imported agricultural commodities.
- The North American micronutrient fertilizer market is on a steady growth trajectory and is projected to continue expanding in the coming years. This growth is driven by the increasing recognition of micronutrients' pivotal role in ensuring robust crop growth.
North America Micronutrient Fertilizer Market Trends
Government support, such as subsidies, contributed to the expansion of field crops
- A wide array of crops are grown on North American farms, mainly covering field crops. Corn, cotton, rice, soybean, and wheat are some of the dominating field crops across the region. The United States, Canada, and Mexico are major contributors to the region's agricultural output. In 2022, field crops covered around 97.6% of the overall cultivation in North America, with cereals and oilseeds dominating the market.
- By country, the United States dominates the market by covering 135.7 million hectares of the overall area under crop cultivation. Among them, field crops and horticulture cover the majority of the area and accounted for 97.2% and 2.8% in the year 2022. However, between 2018-2019, the country witnessed a significant dip in crop acreages, which was mainly due to unfavorable environmental conditions resulting in heavy floods in areas like Texas and Houston.
- The largest crop cultivated is corn, the majority of which is grown in a region known as the 'Corn Belt'-a traditional area in the Midwestern United States, roughly covering western Indiana, Illinois, Iowa, Missouri, eastern Nebraska, and eastern Kansas, where corn (maize) and soybeans are the dominant crops. The United States is also a major rice exporter. The rice cultivation in the region is mainly concentrated within four regions, with three in the South and one in California. Therefore, the increased market potential for the region's field crop, coupled with increased government funding and protection, is anticipated to positively drive the area under field crop cultivation in the region.
Raising micronutrient deficiencies and crop losses increase micronutrient application rates
- In 2022, the highest application rates were observed for manganese, copper, zinc, iron, and boron, at 10.6 kg/ha, 6.9 kg/ha, 6.8 kg/ha, 3.3 kg/ha, and 1.5 kg/ha, respectively. Although most micronutrients have lower crop uptake, their unavailability can severely limit critical plant functions, leading to abnormalities, stunted growth, and reduced yields. Given the rising yields, commodity prices, and input costs, growers are scrutinizing potential barriers to grain production, including micronutrient deficiencies.
- Wheat, sorghum, soybean, and cotton dominate micronutrient fertilizer consumption, with other field crops like corn and rice playing a smaller role. Wheat, in particular, faces significant deficiencies in copper and manganese, while iron and zinc deficiencies also mildly impact its yield.
- The micronutrient requirements of each crop are influenced by regional soil conditions. In the United States, sandy soils in the southeast, which are low in organic matter and prone to leaching, commonly exhibit boron deficiencies, unlike the fertile black soils in the northeast. Similarly, certain fields in Central Alberta, Canada, face copper deficiencies, which are crucial for cereal cultivation.
- All agricultural soils in Mexico are zinc-deficient. However, this condition is more common in Queretaro, Sonora, and Sinaloa, indicating an increased need for zinc micronutrient fertilizers. North American soil is naturally deficient in micronutrients, leading to increased consumption of micronutrient supplements during cultivation.
North America Micronutrient Fertilizer Industry Overview
The North America Micronutrient Fertilizer Market is moderately consolidated, with the top five companies occupying 63.51%. The major players in this market are Sociedad Quimica y Minera de Chile SA, The Andersons Inc., The Mosaic Company, Wilbur-Ellis Company LLC and Yara International ASA (sorted alphabetically).
Additional Benefits:
- The market estimate (ME) sheet in Excel format
- 3 months of analyst support
TABLE OF CONTENTS
1 EXECUTIVE SUMMARY & KEY FINDINGS
2 REPORT OFFERS
3 INTRODUCTION
- 3.1 Study Assumptions & Market Definition
- 3.2 Scope of the Study
- 3.3 Research Methodology
4 KEY INDUSTRY TRENDS
- 4.1 Acreage Of Major Crop Types
- 4.1.1 Field Crops
- 4.1.2 Horticultural Crops
- 4.2 Average Nutrient Application Rates
- 4.2.1 Micronutrients
- 4.2.1.1 Field Crops
- 4.2.1.2 Horticultural Crops
- 4.2.1 Micronutrients
- 4.3 Agricultural Land Equipped For Irrigation
- 4.4 Regulatory Framework
- 4.5 Value Chain & Distribution Channel Analysis
5 MARKET SEGMENTATION (includes market size in Value in USD and Volume, Forecasts up to 2030 and analysis of growth prospects)
- 5.1 Product
- 5.1.1 Boron
- 5.1.2 Copper
- 5.1.3 Iron
- 5.1.4 Manganese
- 5.1.5 Molybdenum
- 5.1.6 Zinc
- 5.1.7 Others
- 5.2 Application Mode
- 5.2.1 Fertigation
- 5.2.2 Foliar
- 5.2.3 Soil
- 5.3 Crop Type
- 5.3.1 Field Crops
- 5.3.2 Horticultural Crops
- 5.3.3 Turf & Ornamental
- 5.4 Country
- 5.4.1 Canada
- 5.4.2 Mexico
- 5.4.3 United States
- 5.4.4 Rest of North America
6 COMPETITIVE LANDSCAPE
- 6.1 Key Strategic Moves
- 6.2 Market Share Analysis
- 6.3 Company Landscape
- 6.4 Company Profiles
- 6.4.1 Haifa Group
- 6.4.2 Koch Industries Inc.
- 6.4.3 Nouryon
- 6.4.4 Sociedad Quimica y Minera de Chile SA
- 6.4.5 The Andersons Inc.
- 6.4.6 The Mosaic Company
- 6.4.7 Wilbur-Ellis Company LLC
- 6.4.8 Yara International ASA
7 KEY STRATEGIC QUESTIONS FOR FERTILIZER CEOS
8 APPENDIX
- 8.1 Global Overview
- 8.1.1 Overview
- 8.1.2 Porter's Five Forces Framework
- 8.1.3 Global Value Chain Analysis
- 8.1.4 Market Dynamics (DROs)
- 8.2 Sources & References
- 8.3 List of Tables & Figures
- 8.4 Primary Insights
- 8.5 Data Pack
- 8.6 Glossary of Terms
 2026年全球微量元素肥料市場報告
 微量元素肥料市場報告:趨勢、預測與競爭分析(至2031年)
 中國微量營養素肥料市場佔有率分析、產業趨勢與統計、成長預測(2025-2030年)中東和非洲微量營養素肥料:市場佔有率分析、行業趨勢、統計數據、成長預測(2025-2030 年)亞太地區微量營養素肥料:市場佔有率分析、產業趨勢和成長預測(2025-2030 年)南美微量營養素肥料:市場佔有率分析、行業趨勢和成長預測(2025-2030 年)印度微量營養素肥料:市場佔有率分析、行業趨勢和統計數據、成長預測(2025-2030 年)微量營養素肥料:市場佔有率分析、產業趨勢與統計、成長預測(2025-2030 年)歐洲微量營養素肥料市場佔有率分析、產業趨勢與成長預測(2025-2030年)美國微量營養素肥料:市場佔有率分析、行業趨勢和統計數據、成長預測(2025-2030 年)