


 |
市場調查報告書
商品編碼
1693523
微量營養素肥料:市場佔有率分析、產業趨勢與統計、成長預測(2025-2030 年)Micronutrient Fertilizer - Market Share Analysis, Industry Trends & Statistics, Growth Forecasts (2025 - 2030) |
||||||
※ 本網頁內容可能與最新版本有所差異。詳細情況請與我們聯繫。
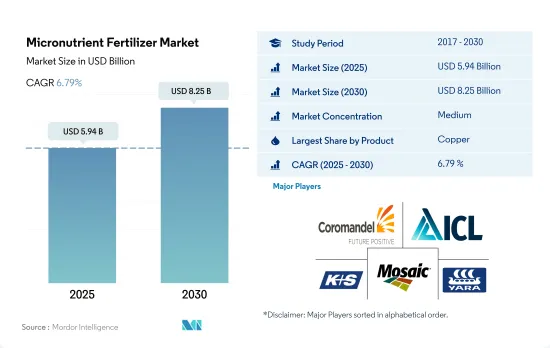
微量營養素肥料市場規模預計在 2025 年為 59.4 億美元,預計到 2030 年將達到 82.5 億美元,預測期內(2025-2030 年)的複合年成長率為 6.79%。
土壤中微量營養素缺乏的增加預計將推動微量營養素肥料市場的成長
- 微量營養素在植物的許多代謝活動中發揮著至關重要的作用,例如細胞壁的形成、花粉的形成、發芽、葉綠素的產生、氮的固定和蛋白質基本部分的合成。預計 2023 年至 2030 年期間全球微量營養素肥料市場規模的複合年成長率將達到 6.6%。
- 2022年全球微量營養素肥料市場中,鋅的佔有率為26.6%。在鋅肥的價值佔有率中,常規鋅肥約佔87.5%,專用鋅肥約佔12.5%。專用鋅肥比傳統肥料的優點在於,它能均勻分佈在作物上,而且起效快。
- 亞太地區在全球市場佔據主導地位,2022 年佔 33.3% 的市場規模。微量營養素肥料的分銷網路在亞太地區主要國家已建立完善,進一步推動了該地區各種微量營養素肥料產品的市場發展。糧食需求的增加和土壤養分的減少是推動該地區市場成長的一些關鍵因素。最近的研究表明,鋅缺乏症是中國最常見的微量營養素缺乏症。超過 50.0% 的耕地土壤缺鋅,限制了農業成長和人類營養改善。
- 全球普遍存在的微量營養素缺乏現象,加上人們對植物健康的興趣日益濃厚,以及各政府機構和其他組織鼓勵改善微量營養素的使用以增強植物和土壤健康,推動著市場的成長。
微量營養素缺乏症的加劇將推動對微量營養素肥料的需求
- 預計在研究期內,全球微量營養素肥料市場將保持穩定成長,到 2022 年市場規模將達到 57 億美元。 2022 年,亞太地區將佔據最大的市場佔有率,達到 38.8%,其次是歐洲和北美。
- 印度和中國等國家是主要的微量營養素肥料市場,到2022年分別佔市場佔有率的13.9%和10.5%。中國作物微量營養素缺乏現像日益嚴重,導致 2022 年微量營養素肥料消費量增加 31.4%。中國農業部已在國家推薦肥料中添加了 15-30 ZnSO4 公斤/公頃的鋅,並且最近將其擴展到水稻和玉米等夏季作物。
- 法國是歐洲最大的微量營養素肥料市場,其次是烏克蘭,2022 年市場規模為 2.184 億美元。園藝作物作物面積將從 2017 年的 1,740 萬公頃下降到 2022 年的 1,560 萬公頃。不過,預計未來幾年這數字將進一步增加。
- 除亞洲外,土壤缺鋅、缺鐵現像在撒哈拉以南非洲和南美洲西北部也相當普遍。微量營養素肥料的整體益處正得到越來越廣泛的接受和認可。 2021 年全球鋅出口額為 160 萬美元,其中荷蘭是該微量營養素的最大出口國,出口額為 275,600 美元。
- 由於全球普遍存在微量營養素缺乏症,鐵和鋅缺乏症日益成為植物健康關注的問題,並且各政府機構都鼓勵增加微量營養素的使用,因此該市場正在不斷成長。
微量營養素肥料的全球趨勢
為了滿足日益成長的糧食需求,農業面臨越來越大的壓力,預計田間作物的種植面積將會增加。
- 當前全球農業領域面臨許多挑戰。根據聯合國預測,到 2050 年,世界人口可能超過 90 億。人口成長可能對農業造成過度壓力,而由於勞動力短缺和都市化進程加劇導致農地面積減少,農業產量已經下降。根據聯合國糧食及農業組織預測,2050年,全球70%的人口預計將居住在城市。隨著全球可耕地面積減少,農民需要使用更多的肥料來提高作物產量。
- 亞太地區是世界上最大的農產品生產地區。農業對該地區的經濟至關重要,約佔總勞動力的 20%。該地區以田間作物種植為主,約佔該地區作物總種植面積的95%以上。水稻、小麥和玉米是該地區的主要田間作物,約佔2022年總耕地面積的24.3%。
- 北美洲是世界上第二大可耕地。該農場種植多種作物,主要為田間作物。尤其是玉米、棉花、稻米、大豆和小麥,都是美國農業部強調的主要田間作物。 2022年,美國佔北美作物種植面積的46.2%。然而,2017年至2019年期間,該國作物種植面積大幅下降,主要原因是惡劣的環境條件導致德克薩斯和休士頓等地區發生嚴重洪災。
亞太地區微量營養素平均施用量最高,為5.20公斤/公頃。
- 產量作物養分流失率高,導致微量營養素的需求大幅增加。微量營養素缺乏是影響世界幾乎所有地區的問題。 2022年全球田間作物微量營養素平均施用率為3.92公斤/公頃。因此,估計2022年錳、鋅、銅將是田間作物施用量較高的大量營養元素,分別為9.53公斤/公頃、6.63公斤/公頃和6.34公斤/公頃。
- 2022 年,平均微量營養素施用率最高的是油菜籽/油菜籽,為 5.20 公斤/公頃,其次是水稻,為 4.42 公斤/公頃,高粱為 4.37 公斤/公頃。不同作物和地區對微量營養素的反應不同。例如,小麥普遍缺乏銅和錳,而亞太地區則發現小麥缺乏硼,鉬缺乏。油菜籽/油菜主要缺乏的是鋅、錳和銅。
- 2022年微量營養素平均施用量最高的是亞太地區,為5.20公斤/公頃,其次是南美洲,為4.37公斤/公頃,北美洲為4.21公斤/公頃。近年來,隨著農民努力提高每公頃種植面積的產量,作物生產中微量營養素的使用量顯著增加。需要改善土壤健康和作物生產力,以提高作物產量並滿足不斷成長的人口的糧食生產需求。因此,全球對微量營養素肥料的需求和農業生產正在顯著成長。
微量營養素肥料產業概況
微量營養素肥料市場適度整合,前五大企業佔57.38%。該市場的主要企業包括 Coromandel International Ltd.、ICL Group Ltd、K+S Aktiengesellschaft、The Mosaic Company、Yara International ASA 等。
其他福利
- Excel 格式的市場預測 (ME) 表
- 3個月的分析師支持
目錄
第1章執行摘要和主要發現
第2章 報告要約
第3章 引言
- 研究假設和市場定義
- 研究範圍
- 調查方法
第4章 產業主要趨勢
- 主要作物種植面積
- 田間作物
- 園藝作物
- 平均養分施用量
- 微量營養素
- 田間作物
- 園藝作物
- 微量營養素
- 灌溉農田
- 法律規範
- 價值鍊和通路分析
第5章市場區隔
- 產品
- 硼
- 銅
- 鐵
- 錳
- 鉬
- 鋅
- 其他
- 如何申請
- 受精
- 葉面噴布
- 土壤
- 作物類型
- 田間作物
- 園藝作物
- 草坪和觀賞植物
- 地區
- 亞太地區
- 澳洲
- 孟加拉
- 中國
- 印度
- 印尼
- 日本
- 巴基斯坦
- 菲律賓
- 泰國
- 越南
- 其他亞太地區
- 歐洲
- 法國
- 德國
- 義大利
- 荷蘭
- 俄羅斯
- 西班牙
- 烏克蘭
- 英國
- 其他歐洲國家
- 中東和非洲
- 奈及利亞
- 沙烏地阿拉伯
- 南非
- 土耳其
- 其他中東和非洲地區
- 北美洲
- 加拿大
- 墨西哥
- 美國
- 北美其他地區
- 南美洲
- 阿根廷
- 巴西
- 南美洲其他地區
- 亞太地區
第6章競爭格局
- 關鍵策略趨勢
- 市場佔有率分析
- 商業狀況
- 公司簡介
- BMS Micro-Nutrients NV
- Coromandel International Ltd.
- Haifa Group
- ICL Group Ltd
- K+S Aktiengesellschaft
- Koch Industries Inc.
- Nouryon
- The Mosaic Company
- Yara International ASA
第7章:CEO面臨的關鍵策略問題
第 8 章 附錄
- 世界概況
- 概述
- 五力分析框架
- 全球價值鏈分析
- 市場動態(DRO)
- 資訊來源及延伸閱讀
- 圖片列表
- 關鍵見解
- 數據包
- 詞彙表
The Micronutrient Fertilizer Market size is estimated at 5.94 billion USD in 2025, and is expected to reach 8.25 billion USD by 2030, growing at a CAGR of 6.79% during the forecast period (2025-2030).
The rising micronutrient deficiency in soil is expected to fuel the growth of the micronutrient fertilizer market
- Micronutrients play an important role in many plant metabolic activities, such as cell wall formation, pollen formation, germination, chlorophyll production, nitrogen fixation, and the synthesis of the essential parts of proteins. The global micronutrient fertilizer market value is anticipated to register a CAGR of 6.6% during 2023-2030.
- Zinc accounted for a major share of 26.6% of the global micronutrient fertilizer market value in 2022. Of the total value share held by zinc fertilizers, conventional zinc fertilizers accounted for about 87.5%, and specialty zinc fertilizers accounted for about 12.5%. Specialty zinc fertilizers have the advantage of uniform distribution and fast acting on crops compared to conventional fertilizers.
- The Asia-Pacific region dominated the global market, accounting for 33.3% of the market value share in 2022. The distribution network of micronutrient fertilizers is well-established in the major Asia-Pacific countries, further boosting the market for various micronutrient fertilizer products in the region. The increasing demand for food grains, coupled with decreasing nutrients in the soil, is one of the major factors driving the growth of the market in the region. Recent studies have indicated that zinc deficiency is China's most widespread micronutrient deficiency. More than 50.0% of the arable soils are low in zinc, thereby limiting agricultural growth and improvement in human nutrition.
- Widespread micronutrient deficiencies worldwide are becoming a rising concern for plant health, coupled with increasing encouragement from various government agencies and other organizations to improve the use of micronutrients to enhance plant and soil health, which is driving the growth of the market.
The increase in micronutrient deficiencies increases the demand for micronutrient fertilizers
- The global micronutrient fertilizer market grew at a stable rate during the study period, with a value of USD 5.70 billion in 2022. Asia-Pacific occupied the largest market share of 38.8% in 2022, followed by Europe and North America.
- Countries such as India and China are the major micronutrient fertilizer markets, accounting for 13.9% and 10.5% of the market share in 2022, respectively. The increase in micronutrient deficiency in Chinese crops resulted in 31.4% of micronutrient fertilizer consumption in 2022. The Ministry of Agriculture (MoA) of China added zinc, at a rate of 15-30 ZnSO4 kg/ha, to its national fertilizer recommendation, which was recently extended for summer crops like rice and corn.
- France is the major market for micronutrient fertilizer in Europe, followed by Ukraine, with a market value of USD 218.4 million in 2022. The area under the cultivation of horticultural crops decreased from 17.4 million hectares in 2017 to 15.6 million hectares in 2022. However, the figure is expected to increase further in the following years.
- Apart from Asia, zinc and iron deficiency in the soil is quite widespread in Sub-Saharan Africa and northwest South America. The overall advantages of micronutrient fertilizers are being widely accepted and recognized. The global export value of zinc in 2021 amounted to USD 1.6 million, with the Netherlands as the top exporter of the micronutrients, with a value of USD 275.6 thousand.
- The market is growing because of the widespread micronutrient deficiencies around the world, with iron and zinc deficiencies becoming a rising concern for plant health, and also due to the increasing encouragement from various government agencies to increase the use of micronutrients.
Global Micronutrient Fertilizer Market Trends
The rising pressure on the agriculture industry to meet the growing demand for food is expected to increase the area under field crop cultivation
- The global agricultural sector is currently facing many challenges. According to the UN, the world population may exceed 9 billion by 2050. This population growth may overburden the agricultural industry, which is already experiencing an output loss due to a lack of laborers and the shrinkage of agricultural fields caused by rising urbanization. According to the Food and Agriculture Organization, 70% of the global population is expected to live in cities by 2050. Due to the global loss of arable land, farmers now need to utilize more fertilizers to increase crop yields.
- The Asia-Pacific region is the world's largest producer of agricultural products. Agriculture is critical to the region's economy, as it employs about 20% of the total available workforce. Field crop cultivation dominates the region, accounting for about more than 95% of the total crop area in the region. Rice, wheat, and corn are the major field crops produced in the region, together accounting for about 24.3% of the total crop area in 2022.
- North America ranks as the second-largest arable region globally. Its farms cultivate a diverse range of crops, with a focus on field crops. Notably, corn, cotton, rice, soybean, and wheat are the prominent field crops, as highlighted by the USDA. In 2022, the United States commanded 46.2% of North America's crop cultivation area. However, the country witnessed a significant drop in crop acreage between 2017 and 2019, primarily due to adverse environmental conditions, leading to severe flooding in regions like Texas and Houston.
The Asia-Pacific region accounted for the highest average micronutrient application rate of 5.20 kg/hectare
- Due to high rates of nutrient loss from high-yielding crops, the demand for micronutrients has risen significantly. Micronutrient deficiency is a problem that affects almost all regions across the world. Globally, the average micronutrient application in field crops was 3.92 kg/hectare in 2022. Accordingly, manganese, zinc, and copper were estimated to be major nutrients with higher application rates in field crops in 2022, accounting for 9.53 kg/ha, 6.63 kg/ha, and 6.34 kg/ha, respectively.
- Rapeseed/canola led the pack with the highest average micronutrient application of 5.20 kg/ha in 2022, followed by rice and sorghum at 4.42 kg/ha and 4.37 kg/ha, respectively. Different crops and regions respond differently to micronutrients. For example, copper and manganese deficiencies are common in wheat, while boron deficiency is observed in wheat, and molybdenum is lacking in the Asia-Pacific region. In rapeseed/canola, zinc, manganese, and copper are the primary deficiencies.
- In 2022, Asia-Pacific had the highest average micronutrient application rate of 5.20 kg/ha, followed by South America with 4.37 kg/ha and North America with 4.21kg/ha. Micronutrient use in crop production has increased significantly in recent years as farmers strive to increase yield per planted hectare. To improve soil health and crop productivity and satisfy a growing population, crop yields must increase to meet food production demands. As a result, the global demand for micronutrient fertilizers and agricultural production is experiencing the most significant rise.
Micronutrient Fertilizer Industry Overview
The Micronutrient Fertilizer Market is moderately consolidated, with the top five companies occupying 57.38%. The major players in this market are Coromandel International Ltd., ICL Group Ltd, K+S Aktiengesellschaft, The Mosaic Company and Yara International ASA (sorted alphabetically).
Additional Benefits:
- The market estimate (ME) sheet in Excel format
- 3 months of analyst support
TABLE OF CONTENTS
1 EXECUTIVE SUMMARY & KEY FINDINGS
2 REPORT OFFERS
3 INTRODUCTION
- 3.1 Study Assumptions & Market Definition
- 3.2 Scope of the Study
- 3.3 Research Methodology
4 KEY INDUSTRY TRENDS
- 4.1 Acreage Of Major Crop Types
- 4.1.1 Field Crops
- 4.1.2 Horticultural Crops
- 4.2 Average Nutrient Application Rates
- 4.2.1 Micronutrients
- 4.2.1.1 Field Crops
- 4.2.1.2 Horticultural Crops
- 4.2.1 Micronutrients
- 4.3 Agricultural Land Equipped For Irrigation
- 4.4 Regulatory Framework
- 4.5 Value Chain & Distribution Channel Analysis
5 MARKET SEGMENTATION (includes market size in Value in USD and Volume, Forecasts up to 2030 and analysis of growth prospects)
- 5.1 Product
- 5.1.1 Boron
- 5.1.2 Copper
- 5.1.3 Iron
- 5.1.4 Manganese
- 5.1.5 Molybdenum
- 5.1.6 Zinc
- 5.1.7 Others
- 5.2 Application Mode
- 5.2.1 Fertigation
- 5.2.2 Foliar
- 5.2.3 Soil
- 5.3 Crop Type
- 5.3.1 Field Crops
- 5.3.2 Horticultural Crops
- 5.3.3 Turf & Ornamental
- 5.4 Region
- 5.4.1 Asia-Pacific
- 5.4.1.1 Australia
- 5.4.1.2 Bangladesh
- 5.4.1.3 China
- 5.4.1.4 India
- 5.4.1.5 Indonesia
- 5.4.1.6 Japan
- 5.4.1.7 Pakistan
- 5.4.1.8 Philippines
- 5.4.1.9 Thailand
- 5.4.1.10 Vietnam
- 5.4.1.11 Rest of Asia-Pacific
- 5.4.2 Europe
- 5.4.2.1 France
- 5.4.2.2 Germany
- 5.4.2.3 Italy
- 5.4.2.4 Netherlands
- 5.4.2.5 Russia
- 5.4.2.6 Spain
- 5.4.2.7 Ukraine
- 5.4.2.8 United Kingdom
- 5.4.2.9 Rest of Europe
- 5.4.3 Middle East & Africa
- 5.4.3.1 Nigeria
- 5.4.3.2 Saudi Arabia
- 5.4.3.3 South Africa
- 5.4.3.4 Turkey
- 5.4.3.5 Rest of Middle East & Africa
- 5.4.4 North America
- 5.4.4.1 Canada
- 5.4.4.2 Mexico
- 5.4.4.3 United States
- 5.4.4.4 Rest of North America
- 5.4.5 South America
- 5.4.5.1 Argentina
- 5.4.5.2 Brazil
- 5.4.5.3 Rest of South America
- 5.4.1 Asia-Pacific
6 COMPETITIVE LANDSCAPE
- 6.1 Key Strategic Moves
- 6.2 Market Share Analysis
- 6.3 Company Landscape
- 6.4 Company Profiles
- 6.4.1 BMS Micro-Nutrients NV
- 6.4.2 Coromandel International Ltd.
- 6.4.3 Haifa Group
- 6.4.4 ICL Group Ltd
- 6.4.5 K+S Aktiengesellschaft
- 6.4.6 Koch Industries Inc.
- 6.4.7 Nouryon
- 6.4.8 The Mosaic Company
- 6.4.9 Yara International ASA
7 KEY STRATEGIC QUESTIONS FOR FERTILIZER CEOS
8 APPENDIX
- 8.1 Global Overview
- 8.1.1 Overview
- 8.1.2 Porter's Five Forces Framework
- 8.1.3 Global Value Chain Analysis
- 8.1.4 Market Dynamics (DROs)
- 8.2 Sources & References
- 8.3 List of Tables & Figures
- 8.4 Primary Insights
- 8.5 Data Pack
- 8.6 Glossary of Terms
 2026年全球微量元素肥料市場報告
 微量元素肥料市場報告:趨勢、預測與競爭分析(至2031年)
 中國微量營養素肥料市場佔有率分析、產業趨勢與統計、成長預測(2025-2030年)中東和非洲微量營養素肥料:市場佔有率分析、行業趨勢、統計數據、成長預測(2025-2030 年)亞太地區微量營養素肥料:市場佔有率分析、產業趨勢和成長預測(2025-2030 年)北美微量營養素肥料:市場佔有率分析、行業趨勢和成長預測(2025-2030 年)南美微量營養素肥料:市場佔有率分析、行業趨勢和成長預測(2025-2030 年)印度微量營養素肥料:市場佔有率分析、行業趨勢和統計數據、成長預測(2025-2030 年)歐洲微量營養素肥料市場佔有率分析、產業趨勢與成長預測(2025-2030年)美國微量營養素肥料:市場佔有率分析、行業趨勢和統計數據、成長預測(2025-2030 年)