


 |
市場調查報告書
商品編碼
1693538
非洲微量營養素肥料:市場佔有率分析、產業趨勢和成長預測(2025-2030 年)Africa Micronutrient Fertilizer - Market Share Analysis, Industry Trends & Statistics, Growth Forecasts (2025 - 2030) |
||||||
價格
※ 本網頁內容可能與最新版本有所差異。詳細情況請與我們聯繫。
簡介目錄
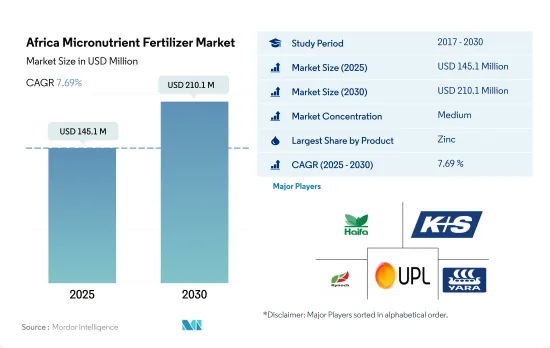
預計 2025 年非洲微量營養素肥料市場規模為 1.451 億美元,到 2030 年將達到 2.101 億美元,預測期內(2025-2030 年)的複合年成長率為 7.69%。
該地區土壤微量營養素缺乏可能會推動市場
- 鋅是該地區消費最廣泛的微量營養素肥料,2022年佔總消費量的30.7%。這種肥料因其在提高作物產量方面發揮作用而備受關注。非洲國家在應對營養不良等社會經濟挑戰的同時,也努力提高生產力。特別是該地區農業土壤普遍缺鋅,進一步推高了對鋅肥的需求。
- 硼是非洲消費量第二大的微量營養素肥料,消費量將達到 23,000 噸,佔市場佔有率的 24.8%。它能活化有助於吸收鉀等關鍵營養物質的酶,並在早期根部發育中發揮關鍵作用,這可以提升市場前景。
- 鐵是非洲第三大消費的微量營養素肥料,佔2022年總消費量的19.5%和市場價值的11.7%。鐵的使用是由於該地區土壤普遍存在營養缺乏現象。
- 錳和銅是常用的微量營養素,主要用於缺乏症狀時。 2022年,錳的佔有率將達到12.1%,銅的佔有率將達到9.0%。另一方面,鉬、鈷、氯、鎳、硒等微量元素在土壤中含量豐富,但需要量卻很少,因此需求量很小。然而,由於土壤品質惡化,這些肥料的施用量正在逐漸增加。
人口成長和糧食不安全加劇推動微量營養素肥料市場
- 2022年,撒哈拉以南非洲地區擁有全球13%的人口和全球約20%的農業用地。儘管有這些優勢,該地區仍然面臨嚴重的糧食短缺問題。問題是由於糧食產量有限,主要是缺乏現代機械化、化學肥料利用不足和土壤微量營養素缺乏。
- 2022年,奈及利亞引領微量營養素肥料市場,佔總量的26.0%。其中,田間作物佔比最大,為98.5%,產量為2.23萬噸。園藝作物所佔比例僅1.4%。對田間作物的偏好可能是由於該地區的密集耕作方式,這常常導致營養缺乏,需要補充肥料。
- 在 2022 年非洲微量營養素肥料市場中,南非佔有 24.4% 的顯著價值佔有率。在南非,傳統微量營養素肥料佔了91.0%的市場佔有率,價值5,260萬美元。同時,特種微量營養素肥料的佔有率為 9.0%,價值 640 萬美元。傳統肥料之所以受歡迎,是因為它們能夠有效地快速解決微量營養素缺乏的問題,尤其是透過土壤施用。
- 鑑於該地區耕地面積的擴大和糧食需求的增加,微量營養素肥料的銷售量預計將在 2023 年至 2030 年間成長。
非洲微量營養素肥料市場趨勢
該地區的農業產量可能加倍,不斷成長的消費需求預計將擴大田間作物的種植面積。
- 非洲的農業生態學區從每年降雨兩次的茂密熱帶雨林到降雨稀少的乾旱沙漠。該地區的主要田間作物包括玉米、高粱、小麥和水稻。到2022年,這些作物的種植面積將達到約2.248億公頃,佔該地區農業用地的95%以上。
- 由於玉米庫存過剩抑制了價格,南非玉米種植者在2018-19年度將玉米種植面積減少了10%,至210萬公頃。結果,該國玉米產量下降了11%,從1300萬噸下降到1200萬噸,而出口量從250萬噸暴跌到100萬噸。隨著越來越多的農民將土地轉為種植作物,尤其是大豆,預計2018-19年度非洲玉米種植面積的下降趨勢將持續下去。
- 非洲的高粱生產以奈及利亞為首,緊隨其後的是埃塞俄比亞。高粱是奈及利亞主要的穀物作物,佔奈及利亞穀物總產量的50%和種植面積的45%。高粱耐旱耐澇,能適應各種土壤條件,已成為非洲旱區首選的主要作物,確保了糧食和收入安全。
- 肯亞、索馬利亞和衣索比亞大部分地區面臨嚴重糧食不安全的迫在眉睫的威脅。過去十年,儘管非洲的農業和耕地面積不斷擴大,但其糧食進口支出卻增加了近兩倍。
由於土壤中微量營養素嚴重缺乏,農民正在增加微量營養素的施用。
- 2022年,鋅、鐵、硼、錳和銅是消費量最多的微量營養素,分別佔30.9%、30.1%、17.3%、16.40%和4.5%。微量營養素對於植物的生長至關重要,因此在作物營養中發揮重要作用。微量營養素缺乏會導致植物異常、生長遲緩和產量下降。水稻、玉米、高粱和小麥是非洲的主要田間作物,2022年田間作物將佔微量營養素總消費量的92.6%(49.09萬噸)。這些作物的平均養分施用量分別為每公頃4.3公斤、3.6公斤、4.3公斤和4.2公斤。小麥尤其容易面臨銅和錳的缺乏,而鐵和鋅的缺乏對產量的影響較小。
- 奈及利亞在非洲國家中脫穎而出,佔大田作物微量營養素肥料消費量的 33.3%,2022 年達到 4.0715 億美元。緊隨其後的是南非,佔 0.5%,價值 670 萬美元。其餘非洲國家則佔微量營養素市場的66.6%。預計非洲微量營養素肥料市場將在 2023 年至 2030 年間成長,這得益於向永續農業實踐的轉變以及對維持土壤中最佳微量營養素水平對作物生長的重要性的認知。
- 隨著農民努力提高每公頃的產量,作物生產中微量營養素的使用量大幅增加。微量營養素缺乏的普遍性加上對作物需求的不斷增加,促使農民採用更多的微量營養素來改善土壤健康和提高作物產量。
非洲微量營養素肥料產業概況
非洲微量營養素肥料市場適度整合,前五大公司佔48.12%。該市場的主要企業包括海法集團、K+S Aktiengesellschaft、Kynoch Fertilizer、UPL Limited、Yara International ASA 等。
其他福利
- Excel 格式的市場預測 (ME) 表
- 3個月的分析師支持
目錄
第1章執行摘要和主要發現
第2章 報告要約
第3章 引言
- 研究假設和市場定義
- 研究範圍
- 調查方法
第4章 產業主要趨勢
- 主要作物種植面積
- 田間作物
- 園藝作物
- 平均養分施用量
- 微量營養素
- 田間作物
- 園藝作物
- 微量營養素
- 灌溉農田
- 法律規範
- 價值鍊和通路分析
第5章市場區隔
- 產品
- 硼
- 銅
- 鐵
- 錳
- 鉬
- 鋅
- 其他
- 如何申請
- 受精
- 葉面噴布
- 土壤
- 作物類型
- 田間作物
- 園藝作物
- 草坪和觀賞植物
- 原產地
- 奈及利亞
- 南非
- 其他非洲國家
第6章競爭格局
- 關鍵策略趨勢
- 市場佔有率分析
- 商業狀況
- 公司簡介
- Gavilon South Africa(MacroSource, LLC)
- Haifa Group
- K+S Aktiengesellschaft
- Kynoch Fertilizer
- UPL Limited
- Yara International ASA
第7章 CEO 的關鍵策略問題
第 8 章 附錄
- 世界概況
- 概述
- 五力分析框架
- 全球價值鏈分析
- 市場動態(DRO)
- 資訊來源及延伸閱讀
- 圖片列表
- 關鍵見解
- 數據包
- 詞彙表
簡介目錄
Product Code: 92603
The Africa Micronutrient Fertilizer Market size is estimated at 145.1 million USD in 2025, and is expected to reach 210.1 million USD by 2030, growing at a CAGR of 7.69% during the forecast period (2025-2030).
Micronutrient deficiencies in the region's soils may drive the market
- Zinc, the most widely consumed micronutrient fertilizer in the region, accounted for 30.7% of the total consumption in the year 2022. Its prominence is attributed to its role in enhancing crop yields. African countries grappling with socio-economic challenges, such as malnutrition, are striving to boost productivity. Notably, zinc deficiency is prevalent in the region's agricultural soils, further driving up the demand for zinc fertilizers.
- Boron, the second most consumed micronutrient fertilizer in Africa, saw a volume consumption of 23.0 thousand metric tons in the year 2022, capturing a 24.8% market share. It plays a crucial role in early-stage root development and activating enzymes that aid in the uptake of major nutrients like potassium, potentially bolstering its market prospects.
- Iron, the third most consumed micronutrient fertilizer in Africa, constituted 19.5% of the total consumption and 11.7% of the market value in the year 2022. Its usage is propelled by prevalent nutrient deficiencies in the region's soils.
- Manganese and copper are commonly employed micronutrients, primarily used when deficiency symptoms arise. In 2022, manganese and copper accounted for shares of 12.1% and 9.0%, respectively. On the other hand, micronutrients like molybdenum, cobalt, chlorine, nickel, and selenium, though abundant in the soil, are less in demand due to their lower requirements. However, with soil quality deteriorating, there is a gradual uptick in the application of these fertilizers.
Growing population and increasing food insecurity concerns propel the micronutrient fertilizer market
- In 2022, the Sub-Saharan African region, home to 13% of the global population, boasted around 20% of the world's agricultural land. Despite this advantage, the region grapples with significant food insecurity. This issue stems from limited food production, largely due to a lack of modern mechanization, underutilization of fertilizers, and prevalent soil micronutrient deficiencies.
- In 2022, Nigeria led the way in the micronutrient fertilizer market, accounting for 26.0% of the total volume. Field crops dominated the fertilizer landscape, claiming a whopping 98.5% share, equivalent to 22.3 thousand metric tons. Horticulture crops trailed behind with a modest 1.4% market share. This preference for field crops can be attributed to the region's intensive agricultural practices, which often lead to nutrient deficiencies necessitating fertilizer supplementation.
- South Africa held a significant value share of 24.4% in the African micronutrient fertilizer market in 2022. Within South Africa, conventional micronutrient fertilizers commanded a lion's share of 91.0%, valued at USD 52.6 million. Specialty micronutrient fertilizers, on the other hand, held a 9.0% share, amounting to USD 6.4 million. The popularity of conventional fertilizers can be attributed to their efficacy in swiftly addressing micronutrient deficiencies, especially through soil application.
- Given the expanding cultivation areas and the region's escalating food demand, the sales of micronutrient fertilizers are poised for growth during 2023-2030.
Africa Micronutrient Fertilizer Market Trends
The region has the potential to double its agricultural production, and the area under field crops is expected to expand due to the rising consumption demand
- The agroecological zones in Africa span from dense rainforests with bi-annual rainfall to arid deserts with minimal precipitation. Key field crops in the region encompass corn, sorghum, wheat, and rice. In 2022, the cultivation area for these crops reached approximately 224.8 million hectares, constituting over 95% of the agricultural land in the region.
- In response to a surplus of corn stocks that led to price suppression, South African corn farmers scaled back their planting by 10% to 2.1 million hectares in the 2018-19 season. Consequently, corn production in the country dipped by 11% from 13 million to 12 million tonnes, and exports plummeted from 2.5 million to 1 million tonnes. This downward trend in corn cultivation is expected to continue in Africa for 2018-2019 as more producers pivot their fields toward oilseed crops, especially soybeans.
- Nigeria takes the lead in sorghum production in Africa, and Ethiopia is closely followed. Sorghum dominates as the primary cereal crop, accounting for 50% of the total output and occupying 45% of Nigeria's cereal cropland. With its resilience to drought and waterlogging and adaptability to diverse soil conditions, sorghum emerges as the preferred staple crop in Africa's arid regions, ensuring both food and income security.
- Kenya, Somalia, and significant parts of Ethiopia face an imminent threat of severe food shortages. Over the past decade, Africa's spending on food imports has nearly tripled despite a consistent expansion in its agricultural industry and cultivated land.
High micronutrient deficiencies in soil have encouraged farmers to apply more micronutrients
- In 2022, zinc, iron, boron, manganese, and copper were the most consumed micronutrients, accounting for 30.9%, 30.1%, 17.3%, 16.40%, and 4.5%, respectively. Micronutrients play a crucial role in crop nutrition, as they are essential for plant growth. Insufficient levels of any micronutrient can lead to plant abnormalities, stunted growth, and reduced yields. Rice, maize, sorghum, and wheat are the primary field crops in Africa, with field crops accounting for 92.6% (490.9 thousand metric tons) of the total micronutrient consumption in 2022. The average nutrient application rates for these crops are 4.3, 3.6, 4.3, and 4.2 kg per hectare, respectively. Wheat, in particular, faces deficiencies in copper and manganese, with slight yield impacts from iron and zinc deficiencies.
- Nigeria stands out among African nations, representing 33.3% of the micronutrient fertilizer consumption in the field crop segment, valued at USD 407.15 million in 2022. South Africa follows with a 0.5% share, valued at USD 6.7 million. The remaining African countries account for the remaining 66.6% of the micronutrient market. The African micronutrient fertilizers market is poised for growth during 2023-2030, driven by a shift toward sustainable farming practices and the recognition of the importance of maintaining optimal micronutrient levels in the soil for crop growth.
- As farmers strive for higher yields per hectare, the use of micronutrients in crop production has seen a significant surge. The prevalence of micronutrient deficiencies, coupled with the rising demand for crops, has prompted farmers to adopt more micronutrients to improve soil health and boost crop productivity.
Africa Micronutrient Fertilizer Industry Overview
The Africa Micronutrient Fertilizer Market is moderately consolidated, with the top five companies occupying 48.12%. The major players in this market are Haifa Group, K+S Aktiengesellschaft, Kynoch Fertilizer, UPL Limited and Yara International ASA (sorted alphabetically).
Additional Benefits:
- The market estimate (ME) sheet in Excel format
- 3 months of analyst support
TABLE OF CONTENTS
1 EXECUTIVE SUMMARY & KEY FINDINGS
2 REPORT OFFERS
3 INTRODUCTION
- 3.1 Study Assumptions & Market Definition
- 3.2 Scope of the Study
- 3.3 Research Methodology
4 KEY INDUSTRY TRENDS
- 4.1 Acreage Of Major Crop Types
- 4.1.1 Field Crops
- 4.1.2 Horticultural Crops
- 4.2 Average Nutrient Application Rates
- 4.2.1 Micronutrients
- 4.2.1.1 Field Crops
- 4.2.1.2 Horticultural Crops
- 4.2.1 Micronutrients
- 4.3 Agricultural Land Equipped For Irrigation
- 4.4 Regulatory Framework
- 4.5 Value Chain & Distribution Channel Analysis
5 MARKET SEGMENTATION (includes market size in Value in USD and Volume, Forecasts up to 2030 and analysis of growth prospects)
- 5.1 Product
- 5.1.1 Boron
- 5.1.2 Copper
- 5.1.3 Iron
- 5.1.4 Manganese
- 5.1.5 Molybdenum
- 5.1.6 Zinc
- 5.1.7 Others
- 5.2 Application Mode
- 5.2.1 Fertigation
- 5.2.2 Foliar
- 5.2.3 Soil
- 5.3 Crop Type
- 5.3.1 Field Crops
- 5.3.2 Horticultural Crops
- 5.3.3 Turf & Ornamental
- 5.4 Country
- 5.4.1 Nigeria
- 5.4.2 South Africa
- 5.4.3 Rest of Africa
6 COMPETITIVE LANDSCAPE
- 6.1 Key Strategic Moves
- 6.2 Market Share Analysis
- 6.3 Company Landscape
- 6.4 Company Profiles
- 6.4.1 Gavilon South Africa (MacroSource, LLC)
- 6.4.2 Haifa Group
- 6.4.3 K+S Aktiengesellschaft
- 6.4.4 Kynoch Fertilizer
- 6.4.5 UPL Limited
- 6.4.6 Yara International ASA
7 KEY STRATEGIC QUESTIONS FOR FERTILIZER CEOS
8 APPENDIX
- 8.1 Global Overview
- 8.1.1 Overview
- 8.1.2 Porter's Five Forces Framework
- 8.1.3 Global Value Chain Analysis
- 8.1.4 Market Dynamics (DROs)
- 8.2 Sources & References
- 8.3 List of Tables & Figures
- 8.4 Primary Insights
- 8.5 Data Pack
- 8.6 Glossary of Terms
02-2729-4219
+886-2-2729-4219
 2026年全球微量元素肥料市場報告
 微量元素肥料市場報告:趨勢、預測與競爭分析(至2031年)
 中國微量營養素肥料市場佔有率分析、產業趨勢與統計、成長預測(2025-2030年)中東和非洲微量營養素肥料:市場佔有率分析、行業趨勢、統計數據、成長預測(2025-2030 年)亞太地區微量營養素肥料:市場佔有率分析、產業趨勢和成長預測(2025-2030 年)北美微量營養素肥料:市場佔有率分析、行業趨勢和成長預測(2025-2030 年)南美微量營養素肥料:市場佔有率分析、行業趨勢和成長預測(2025-2030 年)印度微量營養素肥料:市場佔有率分析、行業趨勢和統計數據、成長預測(2025-2030 年)微量營養素肥料:市場佔有率分析、產業趨勢與統計、成長預測(2025-2030 年)歐洲微量營養素肥料市場佔有率分析、產業趨勢與成長預測(2025-2030年)
▼