


 |
市場調查報告書
商品編碼
1693500
美國微量營養素肥料:市場佔有率分析、行業趨勢和統計數據、成長預測(2025-2030 年)United States Micronutrient Fertilizer - Market Share Analysis, Industry Trends & Statistics, Growth Forecasts (2025 - 2030) |
||||||
※ 本網頁內容可能與最新版本有所差異。詳細情況請與我們聯繫。
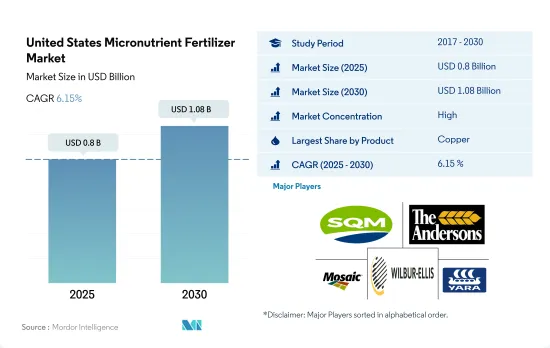
美國微量營養素肥料市場規模預計在 2025 年為 8 億美元,預計到 2030 年將達到 10.8 億美元,預測期內(2025-2030 年)的複合年成長率為 6.15%。
土壤缺水現象加劇和均衡營養需求預計將推動市場成長
- 農民對土壤養分缺乏及其對作物健康和產量的影響的認知正在推動美國對微量營養素的需求增加。
- 預計鋅將成為微量營養素肥料市場的主導者,到 2022 年將佔總市場價值的約 27.3%。預計 2023 年至 2030 年的複合年成長率為 5.2%。尤其是鋅缺乏症,在華盛頓的果園、玉米和小麥中普遍存在,導致生長發育不良和葉部疾病。因此,越來越多的種植者開始使用鋅肥。
- 對於大多數農作物來說,各種環境和土壤因素限制了植物的鐵供應。這種短缺推動了鐵肥市場的成長,預計 2023 年至 2030 年期間的複合年成長率為 3.9%。
- 銅對於植物酵素活性、葉綠素合成和種子生產至關重要。小麥、大麥、燕麥和蔬菜等田間作物特別容易受到銅缺乏的影響。由於田間作物在美國農業中占主導地位,預計2023年至2030年期間該領域銅肥的市場價值將以3.7%的複合年成長率成長。
- 微量營養素在植物的許多代謝活動中發揮重要作用,例如細胞壁的形成、花粉的形成、發芽、葉綠素的產生、氮固定以及蛋白質基本部分的合成。微量營養素肥料的需要量很少,但對於平衡作物營養很重要。因此,微量營養素肥料的市場價值預計在 2023 年至 2030 年期間實現 4.0% 的複合年成長率。
美國微量營養素肥料市場趨勢
大豆和玉米是美國種植面積最大的兩種作物。
- 在美國,人口從2020年的3.359億增加到2022年的3.382億。自2000年以來,耕地總面積減少了近5,000萬英畝,到2022年達到8.934億英畝。有限的農業用地表明需要透過使用農業投入來提高農業生產力。人們長期以來一直使用肥料來提高作物的產量。美國四大作物為玉米、棉花、大豆和小麥,2022年這四大作物將佔主要作物面積的65.7%以上。
- 大豆和玉米是美國種植面積最大的兩種作物。 2022年大豆種植面積最大,占美國耕地面積的25.8%,其次是玉米,佔25.7%,小麥佔11.1%。這些作物大部分生長在被稱為「玉米帶」的地區,該地區涵蓋印第安納州西部、伊利諾伊州、愛荷華州、密蘇裡州、內布拉斯加州東部和堪薩斯州東部。該地區主要產玉米和大豆。根據美國農業部的數據,美國是主要的米出口國,其主要種植區有四個地區:
- 農業投入品製造商正在進行創新,以幫助農民精準施肥。這不僅降低了種植成本,而且提高了效率。美國大田作物領域具有巨大的市場潛力。加上政府不斷增加的資金和支持,預計將實現強勁成長。
微量營養素對於作物抵抗生物和生物脅迫至關重要。
- 微量營養素是植物生長所必需的,在作物營養中發揮重要作用。微量營養素肥料含有植物所需的微量元素,例如硼、銅、錳、鋅和鈷。作物對微量營養素的需求因美國不同地區的土壤條件而異。硼缺乏在東南部的沙質土壤中很常見,因為這種土壤有機質含量低,容易浸出。
- 在美國,田間作物微量營養素的平均施用量為每公頃4.2公斤。 2022 年錳的施用量為每公頃 11.0 公斤,對於提高大豆、小麥、甘蔗和玉米等主要田間作物的產量至關重要。因此,錳將主導微量營養素肥料市場,佔2022年總消費量的33.0%。緊隨錳之後,銅和鋅的施用率分別為每公頃7.2公斤和6.7公斤。這些微量營養素對於作物抵抗生物和生物脅迫至關重要,凸顯了透過人工手段解決其缺陷的重要性。
- 2022 年,田間作物領域佔據主要佔有率,佔整個微量營養素肥料市場價值的 87.6%,數量佔 87.5%。作物,大豆施用量最高,為每公頃4.5公斤。預計向永續農業實踐的轉變以及維持土壤中微量營養素水平以促進作物正常生長的需求將推動 2023-2030 年美國微量營養素肥料市場的成長。
美國微量營養素肥料產業概況
美國微量營養素肥料市場相當集中,前五大公司佔84.13%的市佔率。該市場的主要企業有:Sociedad Quimica y Minera de Chile SA、The Andersons Inc.、The Mosaic Company、Wilbur-Ellis Company LLC 和 Yara International ASA(按字母順序排列)
其他福利
- Excel 格式的市場預測 (ME) 表
- 3個月的分析師支持
目錄
第1章執行摘要和主要發現
第2章 報告要約
第3章 引言
- 研究假設和市場定義
- 研究範圍
- 調查方法
第4章 產業主要趨勢
- 主要作物種植面積
- 田間作物
- 園藝作物
- 平均養分施用量
- 微量營養素
- 田間作物
- 園藝作物
- 微量營養素
- 灌溉農田
- 法律規範
- 價值鍊和通路分析
第5章市場區隔
- 產品
- 硼
- 銅
- 鐵
- 錳
- 鉬
- 鋅
- 其他
- 施肥方式
- 受精
- 葉面噴布
- 土壤
- 作物類型
- 田間作物
- 園藝作物
- 草坪和觀賞植物
第6章 競爭格局
- 關鍵策略趨勢
- 市場佔有率分析
- 商業狀況
- 公司簡介
- Haifa Group
- Koch Industries Inc.
- Nouryon
- Sociedad Quimica y Minera de Chile SA
- The Andersons Inc.
- The Mosaic Company
- Wilbur-Ellis Company LLC
- Yara International ASA
第7章:CEO面臨的關鍵策略問題
第 8 章 附錄
- 世界概況
- 概述
- 五力分析框架
- 全球價值鏈分析
- 市場動態(DRO)
- 資訊來源及延伸閱讀
- 圖片列表
- 關鍵見解
- 資料包
- 詞彙表
The United States Micronutrient Fertilizer Market size is estimated at 0.8 billion USD in 2025, and is expected to reach 1.08 billion USD by 2030, growing at a CAGR of 6.15% during the forecast period (2025-2030).
The growing soil deficiency and the need for balanced nutrition is anticipated to drive the growth of the market
- The awareness among farmers regarding soil nutrient deficiencies and their impact on crop health and yields is driving the rising demand for micronutrients in the United States.
- Zinc emerged as the dominant player in the micronutrient fertilizer market, accounting for approximately 27.3% of the total market value in 2022. It is projected to witness a CAGR of 5.2% from 2023 to 2030. Notably, zinc deficiency is prevalent in Washington orchards, maize, and wheat, leading to stunted growth and leaf disorders. Consequently, growers are increasingly turning to zinc fertilizers.
- In most agricultural crops, various environmental and soil factors limit the availability of iron to plants. This scarcity is expected to fuel the growth of the iron fertilizers market, which is projected to register a CAGR of 3.9% from 2023 to 2030.
- Copper is vital for enzymatic activities, chlorophyll synthesis, and seed production in plants. Field crops like wheat, barley, oats, and vegetables are particularly susceptible to copper deficiency. Given that field crops dominate the agricultural landscape in the United States, the market value of copper fertilizers in this segment is anticipated to register a CAGR of 3.7% during 2023-2030.
- Micronutrients play an important role in many plant metabolic activities, such as cell wall formation, pollen formation, germination, chlorophyll production, nitrogen fixation, and synthesis of essential parts of proteins. Even though micronutrient fertilizers are required in less quantity, they are important for balanced crop nutrition. Hence, the micronutrient fertilizer market's value is anticipated to register a CAGR of 4.0% during 2023-2030.
United States Micronutrient Fertilizer Market Trends
Soybean and corn are the two largest crops grown in the United States
- In the United States, the population increased from 335.9 million in 2020 to 338.2 million in 2022. From 2000 onward, the total farmland area has decreased by almost 50 million acres, reaching a total of 893.4 million acres, as of 2022. The limited farmland indicates the need to increase agricultural productivity with the use of agri inputs. Fertilizers have been used for a long time to increase the productivity of crops. The four major crops in the United States are corn, cotton, soybean, and wheat, which accounted for more than 65.7% of the principal crop acreage in 2022.
- Soybean and corn are the two largest crops grown in the United States. In 2022, soybean had the highest area under cultivation, accounting for 25.8% of the total arable land in the United States, followed by corn at 25.7% and wheat at 11.1%. The majority of these crops are grown in a region known as the "Corn Belt," which covers western Indiana, Illinois, Iowa, Missouri, eastern Nebraska, and Eastern Kansas. The production of corn (maize) and soybeans dominates this area. Additionally, the United States is a major exporter of rice, with most of the cultivation happening in four regions, three of which are in the South and one in California, according to the USDA.
- Manufacturers of farm inputs are innovating to aid farmers in precise fertilizer application. This not only trims cultivation costs but also bolsters efficiency. The field crop sector in the United States holds substantial market potential. Coupled with increased government funding and support, it is poised for positive growth.
Micronutrients are pivotal in equipping crops to combat both biotic and abiotic stresses
- Micronutrients are necessary for plant growth and play a critical role in crop nutrition. Micronutrient fertilizers contain trace amounts of elements such as boron, copper, manganese, zinc, and cobalt, which plants require in small amounts. Micronutrient requirements by the crop vary depending on the soil condition across the United States. Boron deficiency is more common in sandy soils of the southeast, which are low in organic matter content and more susceptible to leaching.
- In the United States, the average application rate for micronutrients in field crops stands at 4.2 kg per hectare. Manganese, with an application rate of 11.0 kg per hectare in 2022, is crucial for boosting the productivity of key field crops such as soybean, wheat, sugarcane, and maize. As a result, manganese dominates the micronutrient fertilizer market, accounting for 33.0% of the total consumption in 2022. Following manganese, copper and zinc have application rates of 7.2 and 6.7 kg per hectare, respectively. These micronutrients are pivotal in equipping crops to combat both biotic and abiotic stresses, underscoring the importance of addressing their deficiencies through artificial means.
- In 2022, the field crops segment held the lion's share, contributing 87.6% in value and 87.5% in volume to the overall micronutrient fertilizer market. Among these crops, soybean led the pack with an application rate of 4.5 kg per hectare. The shifting focus toward sustainable methods of farming and the need to maintain micronutrient levels in the soil for the proper growth of crops are expected to drive the US micronutrient fertilizers market's growth during 2023-2030.
United States Micronutrient Fertilizer Industry Overview
The United States Micronutrient Fertilizer Market is fairly consolidated, with the top five companies occupying 84.13%. The major players in this market are Sociedad Quimica y Minera de Chile SA, The Andersons Inc., The Mosaic Company, Wilbur-Ellis Company LLC and Yara International ASA (sorted alphabetically).
Additional Benefits:
- The market estimate (ME) sheet in Excel format
- 3 months of analyst support
TABLE OF CONTENTS
1 EXECUTIVE SUMMARY & KEY FINDINGS
2 REPORT OFFERS
3 INTRODUCTION
- 3.1 Study Assumptions & Market Definition
- 3.2 Scope of the Study
- 3.3 Research Methodology
4 KEY INDUSTRY TRENDS
- 4.1 Acreage Of Major Crop Types
- 4.1.1 Field Crops
- 4.1.2 Horticultural Crops
- 4.2 Average Nutrient Application Rates
- 4.2.1 Micronutrients
- 4.2.1.1 Field Crops
- 4.2.1.2 Horticultural Crops
- 4.2.1 Micronutrients
- 4.3 Agricultural Land Equipped For Irrigation
- 4.4 Regulatory Framework
- 4.5 Value Chain & Distribution Channel Analysis
5 MARKET SEGMENTATION (includes market size in Value in USD and Volume, Forecasts up to 2030 and analysis of growth prospects)
- 5.1 Product
- 5.1.1 Boron
- 5.1.2 Copper
- 5.1.3 Iron
- 5.1.4 Manganese
- 5.1.5 Molybdenum
- 5.1.6 Zinc
- 5.1.7 Others
- 5.2 Application Mode
- 5.2.1 Fertigation
- 5.2.2 Foliar
- 5.2.3 Soil
- 5.3 Crop Type
- 5.3.1 Field Crops
- 5.3.2 Horticultural Crops
- 5.3.3 Turf & Ornamental
6 COMPETITIVE LANDSCAPE
- 6.1 Key Strategic Moves
- 6.2 Market Share Analysis
- 6.3 Company Landscape
- 6.4 Company Profiles
- 6.4.1 Haifa Group
- 6.4.2 Koch Industries Inc.
- 6.4.3 Nouryon
- 6.4.4 Sociedad Quimica y Minera de Chile SA
- 6.4.5 The Andersons Inc.
- 6.4.6 The Mosaic Company
- 6.4.7 Wilbur-Ellis Company LLC
- 6.4.8 Yara International ASA
7 KEY STRATEGIC QUESTIONS FOR FERTILIZER CEOS
8 APPENDIX
- 8.1 Global Overview
- 8.1.1 Overview
- 8.1.2 Porter's Five Forces Framework
- 8.1.3 Global Value Chain Analysis
- 8.1.4 Market Dynamics (DROs)
- 8.2 Sources & References
- 8.3 List of Tables & Figures
- 8.4 Primary Insights
- 8.5 Data Pack
- 8.6 Glossary of Terms
 2026年全球微量元素肥料市場報告
 微量元素肥料市場報告:趨勢、預測與競爭分析(至2031年)
 中國微量營養素肥料市場佔有率分析、產業趨勢與統計、成長預測(2025-2030年)中東和非洲微量營養素肥料:市場佔有率分析、行業趨勢、統計數據、成長預測(2025-2030 年)亞太地區微量營養素肥料:市場佔有率分析、產業趨勢和成長預測(2025-2030 年)北美微量營養素肥料:市場佔有率分析、行業趨勢和成長預測(2025-2030 年)南美微量營養素肥料:市場佔有率分析、行業趨勢和成長預測(2025-2030 年)印度微量營養素肥料:市場佔有率分析、行業趨勢和統計數據、成長預測(2025-2030 年)微量營養素肥料:市場佔有率分析、產業趨勢與統計、成長預測(2025-2030 年)歐洲微量營養素肥料市場佔有率分析、產業趨勢與成長預測(2025-2030年)