


 |
市場調查報告書
商品編碼
1693534
亞太地區微量營養素肥料:市場佔有率分析、產業趨勢和成長預測(2025-2030 年)Asia-Pacific Micronutrient Fertilizer - Market Share Analysis, Industry Trends & Statistics, Growth Forecasts (2025 - 2030) |
||||||
※ 本網頁內容可能與最新版本有所差異。詳細情況請與我們聯繫。
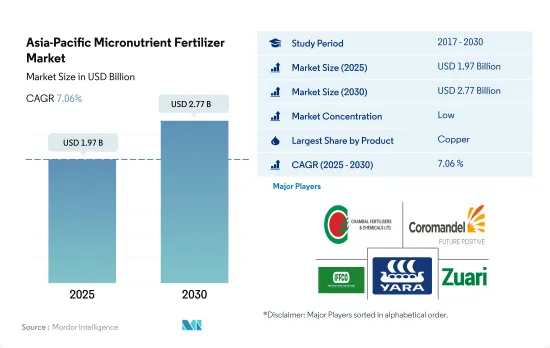
亞太地區微量營養素肥料市場規模預計在 2025 年為 19.7 億美元,預計到 2030 年將達到 27.7 億美元,預測期內(2025-2030 年)的複合年成長率為 7.06%。
人們對農業生產的認知和重視程度不斷提高可能會推動該地區的市場發展。
- 硼是該地區消費量最大的微量營養素,2022 年的消費量佔有率為 26.5%。硼的消耗主要歸因於該地區的土壤,土壤含水量低、氮含量高,限制了植物對硼的吸收,增加了硼微量營養素的可用性。
- 在亞太地區,鋅的消費量市場佔有率位居第二,佔比為 26.2%,2022 年消費量為 159,100 噸。由於鋅在植物生長發育中起著至關重要的作用,預計未來幾年需求將繼續增加。
- 2022年,銅將佔亞太地區微量營養素市場的28.6%。它是一種重要的微量營養素,但所需的量很少。它在植物發育過程中的許多重要反應中起催化劑的作用,並在蛋白質的形成中起關鍵作用。
- 鐵是該地區第三大微量營養素消費量國,佔2022年所有微量營養素的20.8%。鐵在植物生長發育中起著重要作用,因為它含有許多酶,並能作為葉綠素形成的催化劑。土壤缺鐵現象的加劇預計將推動市場的成長。
- 因此,由於對更高產量和生產率的需求,以及農民對微量營養素在作物種植中的重要性的認知不斷提高等因素,預計該地區的微量營養素市場在 2023 年至 2030 年期間的複合年成長率將達到 6.8%。
農民對營養缺乏和營養不良問題的認知不斷提高,可能會推動市場
- 2022 年,印度和中國成為亞太地區微量營養素肥料市場的主導參與企業,分別佔 41.7% 和 31.7% 的市場佔有率。科學與環境中心 (CSE) 強調了印度土壤的缺陷,並發現硼、鐵和鋅最為突出,分別佔 47%、37% 和 39%。儘管印度缺乏優質的銅和錳,但這使其成為該地區的主要市場。
- 中國政府意識到過量使用化學肥料的嚴重性,推出了「化肥使用量零成長行動計畫」。該法規不鼓勵使用含有微量營養素變異體的肥料。因此,微量營養素的成長率,尤其是大田作物領域的成長率保持在 3.8% 的溫和水平。
- 研究一直強調韓國、馬來西亞和台灣等國家普遍存在硼缺乏現象。這種缺陷在火山、酸性和石灰性土壤中尤其明顯,對花生、大豆、木瓜和柑橘類水果等作物造成嚴重影響。因此,硼微量營養素肥料市場正在蓬勃發展。
- 亞太食品與肥料技術中心研究發現,葉面噴布0.5%硫酸亞鐵、0.1%硫酸錳、0.1%硫酸銅等微量元素肥,可有效緩解作物缺素症狀。
- 由於迫切需要確保糧食安全,預計2023年至2030年間亞太地區對微量營養素肥料的需求將以6.8%的複合年成長率強勁成長。
亞太地區微量營養素肥料市場趨勢
隨著主要作物種植面積大幅擴大,肥料市場預計將成長
- 在亞太地區,田間作物佔耕地總面積的95%以上。水稻、小麥和玉米是該地區的主要田間作物,佔2022年總耕地面積的38%左右。預計耕地面積的增加將增加該國對化肥的需求。
- 亞太地區包括中國、印度、巴基斯坦和澳大利亞,是世界上最大的小麥生產區之一。中國和印度分別是世界上最大的小麥生產國和消費國。小麥是該地區的主要主食之一,推動了需求和消費的成長。其中,2018年至2022年,小麥種植面積將增加63.86萬公頃。 2022年,中國小麥產量為1.38億噸,成為全球最大小麥生產國,印度小麥產量為1.03億噸。
- 水稻是該地區最大的田間作物。到2022年,光是耕地面積就將占到農業用地總面積的約16.44%。水稻是亞洲和太平洋大部分地區的主食。預計2022年中國米產量為1.47億噸,印度米產量為1.24億噸。印度的消費量預計將達到 1.09 億噸,出口量將達到 1,950 萬噸,位居世界第一。
- 國內外對田間作物的需求迅速成長,促進了田間作物面積的擴大。預計耕地面積的大幅增加將在2023年至2030年期間對亞太地區化肥市場產生直接正面的影響。
2022 年油菜籽/油菜籽的平均養分施用量最高,達 9.2 公斤/公頃。
- 近年來,由於產量作物養分流失速度加快,對微量營養素的需求不斷成長。微量營養素缺乏症在亞太地區普遍存在,該地區是受此類缺乏症影響的主要地區之一。鋅、錳和銅是主要施用於田間作物的養分類型,預計到2022年將分別佔12公斤/公頃、9.1公斤/公頃和7.2公斤/公頃。
- 新興國家的農業相關人員對使用微量營養素肥料的好處缺乏認知,以及購買這些肥料的成本高昂,是限制該地區微量營養素肥料成長的因素。
- 依作物類型分類,2022 年平均養分施用量最高的是油菜籽/油菜籽,為 9.2 公斤/公頃,其次是玉米/玉米,為 6.7 公斤/公頃,水稻為 5.4 公斤/公頃。特定微量營養素的影響因作物和地區而異。例如,小麥主要缺乏的微量營養素是銅和錳。中國、印度和日本等國的小麥都被發現缺乏硼和鉬。同樣,油菜籽/油菜籽主要缺乏的是鋅、錳和銅。
- 近年來,隨著農民希望從每公頃種植面積中獲得更多產量,微量營養素在作物生產中的受歡迎程度迅速成長。微量營養素缺乏程度高以及對作物的需求不斷增加,導致農民採用更多的微量營養素來改善土壤健康並提高作物產量。
亞太地區微量營養素肥料產業概況
亞太地區微量營養素肥料市場細分化,前五大公司佔28.85%。該市場的主要企業有 Chambal Fertilizers & Chemicals Ltd、Coromandel International Ltd.、Indian Farmers Fertiliser Cooperative Limited、Yara International ASA、Zuari Agro Chemicals Ltd 等。
其他福利
- Excel 格式的市場預測 (ME) 表
- 3個月的分析師支持
目錄
第1章執行摘要和主要發現
第2章 報告要約
第3章 引言
- 研究假設和市場定義
- 研究範圍
- 調查方法
第4章 產業主要趨勢
- 主要作物種植面積
- 田間作物
- 園藝作物
- 平均養分施用量
- 微量營養素
- 田間作物
- 園藝作物
- 微量營養素
- 灌溉農田
- 法律規範
- 價值鍊和通路分析
第5章市場區隔
- 產品
- 硼
- 銅
- 鐵
- 錳
- 鉬
- 鋅
- 其他
- 如何申請
- 受精
- 葉面噴布
- 土壤
- 作物類型
- 田間作物
- 園藝作物
- 草坪和觀賞植物
- 原產地
- 澳洲
- 孟加拉
- 中國
- 印度
- 印尼
- 日本
- 巴基斯坦
- 菲律賓
- 泰國
- 越南
- 其他亞太地區
第6章競爭格局
- 關鍵策略趨勢
- 市場佔有率分析
- 商業狀況
- 公司簡介
- Chambal Fertilizers & Chemicals Ltd
- Coromandel International Ltd.
- Grupa Azoty SA(Compo Expert)
- Haifa Group
- ICL Group Ltd
- Indian Farmers Fertiliser Cooperative Limited
- Yara International ASA
- Zuari Agro Chemicals Ltd
第7章 CEO 的關鍵策略問題
第 8 章 附錄
- 世界概況
- 概述
- 五力分析框架
- 全球價值鏈分析
- 市場動態(DRO)
- 資訊來源及延伸閱讀
- 圖片列表
- 關鍵見解
- 數據包
- 詞彙表
The Asia-Pacific Micronutrient Fertilizer Market size is estimated at 1.97 billion USD in 2025, and is expected to reach 2.77 billion USD by 2030, growing at a CAGR of 7.06% during the forecast period (2025-2030).
Growing awareness and their importance in the agriculture production may drive the market in the region
- Boron was the most consumed micronutrient in the region, with a consumption volume share of 26.5% in 2022. The majority of boron consumption is attributed to the region's soils, which have reduced water content and higher nitrogen levels that limit boron uptake by plants, leading to increased utilization of boron micronutrients.
- In Asia-Pacific, zinc held the second-largest market share in terms of consumption, with a share of 26.2% and a volume of 159.1 thousand metric tons in 2022. The demand for zinc is anticipated to continue rising in the coming years due to its vital role in the growth and development of plants.
- Copper accounted for 28.6% of the Asia-Pacific micronutrient market's value in the region in 2022. It is an important micronutrient needed in small quantities. It acts as a catalyst in many important plant reactions during growth and plays a key role in protein formation.
- Iron was the third most-consumed micronutrient fertilizer in the region, accounting for a 20.8% share among all micronutrients in 2022. Iron plays an important role in a plant's growth and development as it contains many enzymes and acts as a catalyst in chlorophyll formation. The growing iron deficiency in the soil is expected to fuel the growth of the market.
- Hence, owing to factors like the need for higher yield and productivity and the growing knowledge among farmers about their importance in crop cultivation, the market for micronutrients in the region is anticipated to grow between 2023 and 2030 with a value CAGR of 6.8%.
Nutrient deficiencies and growing awareness among farmers regarding malnutrition problems may drive the market
- In 2022, India and China emerged as the dominant players in the Asia-Pacific micronutrient fertilizer market, capturing 41.7% and 31.7% of the market share, respectively. The Centre for Science and Environment (CSE) highlighted India's soil deficiencies, with boron, iron, and zinc being the most prominent, at 47%, 37%, and 39% respectively. This makes India the leading market in the region, although it fares better in terms of copper and manganese deficiencies.
- Recognizing the gravity of fertilizer overuse, the Chinese government introduced the "Action Plan for the Zero Increase of Fertilizer Use." This regulation has curtailed the usage of fertilizers, including micronutrient variants. Consequently, the growth rate of micronutrients, especially in the field crops segment, has been limited to a modest CAGR of 3.8%.
- Studies have consistently highlighted the prevalence of boron deficiency in countries like Korea, Malaysia, and Taiwan. This deficiency is particularly pronounced in volcanic, acidic, and calcareous soils, significantly impacting crops like peanuts, soybeans, papaya, and citrus. As a result, the market for boron micronutrient fertilizers has witnessed a surge.
- The Food and Fertilizer Technology Centre for the Asian and Pacific Region has observed that applying micronutrients through the foliar mode, such as 0.5% iron sulfate, manganese sulfate, and 0.1% copper sulfate, at the recommended dosages, effectively mitigates crop deficiency symptoms.
- Given the imperative of ensuring food security, the demand for micronutrient fertilizers in Asia-Pacific is projected to register a robust CAGR of 6.8% during 2023-2030.
Asia-Pacific Micronutrient Fertilizer Market Trends
The significant expansion in the cultivation of major growing crops is anticipated to boost the growth of the fertilizers market
- Field crop cultivation dominates the Asia-Pacific region, accounting for more than 95% of the total crop area. Rice, wheat, and corn are the major field crops produced in the region, together accounting for about 38% of the total crop area in 2022. The rising area under cultivation is expected to increase the need for fertilizer usage in the country.
- The Asia-Pacific region, which include China, India, Pakistan, and Australia, is among the world's largest wheat producers. China and India are also the world's largest wheat producers and consumers. Wheat is one of the major staple foods of this region, driving the increase increase in demand and consumption. Notably, the area under wheat cultivation increased by 638.6 thousand ha from 2018 to 2022. In 2022, China accounted for the production of 138 million metric tons of wheat, making it the largest wheat producer in the world, and India recorded wheat production of 103 million metric tons.
- Rice is the largest cultivated field crop in the region. Its cultivation alone accounted for about 16.44% of the total agricultural land in 2022. Rice is the staple food of Asia and most parts of the Pacific region. China was projected to produce 147 million tons of rice, and India was expected to harvest 124 million tons of rice in 2022. India was also expected to consume 109 million tons while exporting a world-leading 19.5 million tons.
- The surge in both domestic and international demand for field crops has prompted an expansion in the cultivation area dedicated to these crops. This significant increase in cultivated land is expected to have a direct and positive impact on the Asia-Pacific fertilizer market throughout the 2023-2030 period.
Rapeseed/canola accounted for the highest average nutrient application rate of 9.2 kg/hectare in 2022
- The demand for micronutrients has grown in recent years due to the accelerated rates of nutrient removal in high-yielding crops. Micronutrient deficiency is widespread in Asia-Pacific, which is one of the major regions affected by this deficiency. Zinc, manganese, and copper are estimated to be the major types of nutrients applied largely for field crops, accounting for 12 kg/hectare, 9.1 kg/hectare, and 7.2 kg/hectare, respectively, in 2022.
- The lack of awareness about the benefits of using micronutrient fertilizers among the farming community in developing countries and the high cost associated with the purchase of these fertilizers are some of the factors limiting the growth of micronutrient fertilizers in the region.
- By crop type, rapeseed/canola accounted for the highest average nutrient application rate of 9.2 kg/hectare in 2022, followed by corn/maize and rice, accounting for 6.7 kg/hectare and 5.4 kg/hectare, respectively. The impact of specific micronutrients differs among crops and across the region. For instance, in the case of wheat, the major micronutrient deficiencies are copper and manganese. In countries like China, India, and Japan, boron and molybdenum are identified as deficient in wheat. Similarly, in rapeseed/canola, the major deficiencies are zinc, manganese, and copper.
- As farmers aim to get more out of every planted hectare, the popularity of micronutrients in the production of crops has increased rapidly in the recent past. High micronutrient deficiency and increasing demand for crops have encouraged farmers to adopt more micronutrients to increase soil health and enhance crop productivity.
Asia-Pacific Micronutrient Fertilizer Industry Overview
The Asia-Pacific Micronutrient Fertilizer Market is fragmented, with the top five companies occupying 28.85%. The major players in this market are Chambal Fertilizers & Chemicals Ltd, Coromandel International Ltd., Indian Farmers Fertiliser Cooperative Limited, Yara International ASA and Zuari Agro Chemicals Ltd (sorted alphabetically).
Additional Benefits:
- The market estimate (ME) sheet in Excel format
- 3 months of analyst support
TABLE OF CONTENTS
1 EXECUTIVE SUMMARY & KEY FINDINGS
2 REPORT OFFERS
3 INTRODUCTION
- 3.1 Study Assumptions & Market Definition
- 3.2 Scope of the Study
- 3.3 Research Methodology
4 KEY INDUSTRY TRENDS
- 4.1 Acreage Of Major Crop Types
- 4.1.1 Field Crops
- 4.1.2 Horticultural Crops
- 4.2 Average Nutrient Application Rates
- 4.2.1 Micronutrients
- 4.2.1.1 Field Crops
- 4.2.1.2 Horticultural Crops
- 4.2.1 Micronutrients
- 4.3 Agricultural Land Equipped For Irrigation
- 4.4 Regulatory Framework
- 4.5 Value Chain & Distribution Channel Analysis
5 MARKET SEGMENTATION (includes market size in Value in USD and Volume, Forecasts up to 2030 and analysis of growth prospects)
- 5.1 Product
- 5.1.1 Boron
- 5.1.2 Copper
- 5.1.3 Iron
- 5.1.4 Manganese
- 5.1.5 Molybdenum
- 5.1.6 Zinc
- 5.1.7 Others
- 5.2 Application Mode
- 5.2.1 Fertigation
- 5.2.2 Foliar
- 5.2.3 Soil
- 5.3 Crop Type
- 5.3.1 Field Crops
- 5.3.2 Horticultural Crops
- 5.3.3 Turf & Ornamental
- 5.4 Country
- 5.4.1 Australia
- 5.4.2 Bangladesh
- 5.4.3 China
- 5.4.4 India
- 5.4.5 Indonesia
- 5.4.6 Japan
- 5.4.7 Pakistan
- 5.4.8 Philippines
- 5.4.9 Thailand
- 5.4.10 Vietnam
- 5.4.11 Rest of Asia-Pacific
6 COMPETITIVE LANDSCAPE
- 6.1 Key Strategic Moves
- 6.2 Market Share Analysis
- 6.3 Company Landscape
- 6.4 Company Profiles
- 6.4.1 Chambal Fertilizers & Chemicals Ltd
- 6.4.2 Coromandel International Ltd.
- 6.4.3 Grupa Azoty S.A. (Compo Expert)
- 6.4.4 Haifa Group
- 6.4.5 ICL Group Ltd
- 6.4.6 Indian Farmers Fertiliser Cooperative Limited
- 6.4.7 Yara International ASA
- 6.4.8 Zuari Agro Chemicals Ltd
7 KEY STRATEGIC QUESTIONS FOR FERTILIZER CEOS
8 APPENDIX
- 8.1 Global Overview
- 8.1.1 Overview
- 8.1.2 Porter's Five Forces Framework
- 8.1.3 Global Value Chain Analysis
- 8.1.4 Market Dynamics (DROs)
- 8.2 Sources & References
- 8.3 List of Tables & Figures
- 8.4 Primary Insights
- 8.5 Data Pack
- 8.6 Glossary of Terms
 2026年全球微量元素肥料市場報告
 微量元素肥料市場報告:趨勢、預測與競爭分析(至2031年)
 中國微量營養素肥料市場佔有率分析、產業趨勢與統計、成長預測(2025-2030年)中東和非洲微量營養素肥料:市場佔有率分析、行業趨勢、統計數據、成長預測(2025-2030 年)北美微量營養素肥料:市場佔有率分析、行業趨勢和成長預測(2025-2030 年)南美微量營養素肥料:市場佔有率分析、行業趨勢和成長預測(2025-2030 年)印度微量營養素肥料:市場佔有率分析、行業趨勢和統計數據、成長預測(2025-2030 年)微量營養素肥料:市場佔有率分析、產業趨勢與統計、成長預測(2025-2030 年)歐洲微量營養素肥料市場佔有率分析、產業趨勢與成長預測(2025-2030年)美國微量營養素肥料:市場佔有率分析、行業趨勢和統計數據、成長預測(2025-2030 年)