


 |
市場調查報告書
商品編碼
1693506
中國微量營養素肥料市場佔有率分析、產業趨勢與統計、成長預測(2025-2030年)China Micronutrient Fertilizer - Market Share Analysis, Industry Trends & Statistics, Growth Forecasts (2025 - 2030) |
||||||
※ 本網頁內容可能與最新版本有所差異。詳細情況請與我們聯繫。
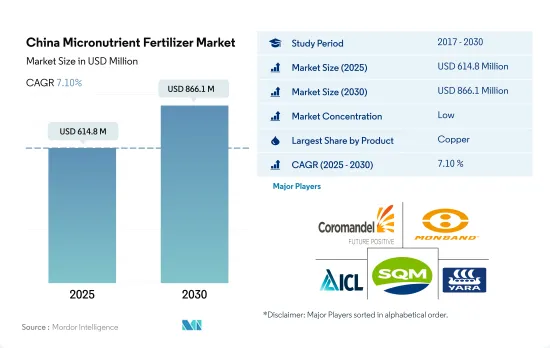
預計 2025 年中國微量營養素肥料市場規模為 6.148 億美元,到 2030 年將達到 8.661 億美元,預測期內(2025-2030 年)的複合年成長率為 7.10%。
為了提高生產力而對微量營養素的需求不斷增加可能會推動市場成長。
- 土壤微量營養素缺乏是全國普遍的問題。有些微量營養素由於流動性較差,在地殼中較為豐富。它們導致作物缺乏微量營養素。
- 銅是國內作物生產常用的微量營養肥料。它約佔 2022 年微量營養素肥料市場總量的 27.6%。銅 (Cu) 是植物所需的少量微量營養素之一。它是光合作用所必需的,對於植物呼吸至關重要,並有助於植物代謝蛋白質和碳水化合物。銅可以增強蔬菜和花卉的顏色,並在蛋白質的形成中發揮重要作用。
- 中國大部分土壤含有充足的銅。但對於蔬菜作物來說,平均銅施用量比2022年田間作物的平均銅施用量高出0.2%。由於銅是植物體內不可移動的元素,因此銅缺乏的症狀首先出現在植物的幼嫩部分。
- 鋅是該國消費量最大的微量營養素,到 2022 年將佔據第二大市場佔有率,達到 25.49%。植物對鋅的需求量非常小。大多數植物的正常鋅含量在 20 至 100 ppm 之間。然而,這種少量的鋅作為酵素的輔因子和蛋白質的結構成分在植物中發揮重要作用。
- 生產力提高、產量增加以及為不斷成長的人口維持糧食和營養安全的需求等因素可能會推動市場在 2023 年至 2030 年期間以 6.9% 的複合年成長率成長,而先進肥料的出現也可能促進微量營養素的消費。
中國微肥市場趨勢
耕地面積的擴大是由於糧食需求的增加以及該國實現主糧自給自足的目標。
- 中國田間作物種植面積將從2018年的1.266億公頃略微增加到2022年的1.278億公頃,佔耕地總面積的70.8%。 2022年,玉米將佔田間作物的34.2%,其次是水稻,佔23.6%,小麥佔18.3%。耕地面積的增加將增加中國對化肥的需求。
- 中國大田作物日曆圍繞著兩個季節:春夏季(四月至九月)和冬季。春季作物包括早玉米、早稻、早小麥、棉花等,冬季作物包括冬小麥、油菜等。但人們關注的焦點是米和玉米,這兩種作物佔中國糧食產量的三分之一。中國是世界最大的稻米生產國,預計2022年稻米種植面積將達3,000萬公頃,稻米產量將達2.1億噸。水稻主產區分佈在黑龍江、湖南、江西、湖北、江蘇、四川、廣西、廣東、湖南等地。玉米方面,預計2022-2023年中國玉米產量為2.772億噸,較上年度大幅增加460萬噸,受惠於玉米豐收。黑龍江、吉林、內蒙古等東北三省是玉米生產大省。
- 中國的生長季節主要在春季,但六月和七月氣候炎熱。米,數百萬人的主食,正遭受這種後果。炎熱的氣溫和稀少的降雨加劇了土壤礦物質的缺乏,因此需要增加施肥量。這些乾旱條件也導致作物產量下降。
在中國,油菜籽和菜籽比其他田間作物吸收的微量營養素含量更高。
- 微量營養素在作物營養和生長中起著重要作用,其缺乏會對產量重大影響。田間作物微肥平均施用量一般為5.2公斤/公頃。尤其是錳,它是地殼中第 11 種最豐富的微量營養素,但 2022 年的施用率最高,為 9.8 公斤/公頃。然而,當土壤 pH 值升至 7 以上時,就會發生化學和微生物氧化,從而固定植物可利用的 Mn2+。這會導致植物缺錳。
- 2022年,錳之後是銅,施用量為7.3公斤/公頃,其次是鋅,施用量為4.1公斤/公頃,鐵為3.3公斤/公頃。
- 在中國,菜籽因其微量營養素施用量高於其他田間作物而脫穎而出。考慮到微量營養素缺乏對油產量有顯著影響,平均每公頃油菜籽施用10.79公斤微量營養素。值得注意的是,葉面噴布錳和鉬可使種子油含量增加 1%。
- 土壤中微量營養素的缺乏可能是由於過量施用磷酸鹽和其他自然因素造成的。磷酸鹽尤其會限制作物對鐵、鋅和銅的吸收。中國採取了減少磷肥施用量、增加鋅肥施用量的策略來提高田間作物產量。
- 微量營養素肥料的最佳施用可以提高植物從土壤中吸收主要營養素的效率,並減少蔬菜作物的整體肥料需求。
中國微肥產業概況
中國微肥市場分散,前五大企業市佔率合計為27.14%。該市場的主要企業包括 Coromandel International Ltd.、河北蒙邦水溶性肥料、ICL Group Ltd、Sociedad Quimica y Minera de Chile SA、Yara International ASA 等。
其他福利
- Excel 格式的市場預測 (ME) 表
- 3個月的分析師支持
目錄
第1章執行摘要和主要發現
第2章 報告要約
第3章 引言
- 研究假設和市場定義
- 研究範圍
- 調查方法
第4章 產業主要趨勢
- 主要作物種植面積
- 田間作物
- 園藝作物
- 平均養分施用量
- 微量營養素
- 田間作物
- 園藝作物
- 微量營養素
- 灌溉農田
- 法律規範
- 價值鍊和通路分析
第5章市場區隔
- 產品
- 硼
- 銅
- 鐵
- 錳
- 鉬
- 鋅
- 其他
- 應用模式
- 受精
- 葉面噴布
- 土壤
- 作物類型
- 田間作物
- 園藝作物
- 草坪和觀賞植物
第6章競爭格局
- 關鍵策略趨勢
- 市場佔有率分析
- 商業狀況
- 公司簡介
- Coromandel International Ltd.
- Grupa Azoty SA(Compo Expert)
- Haifa Group
- Hebei Monband Water Soluble Fertilizer Co. Ltd
- ICL Group Ltd
- Sociedad Quimica y Minera de Chile SA
- Yara International ASA
第7章 CEO 的關鍵策略問題
第 8 章 附錄
- 世界概況
- 概述
- 五力分析框架
- 全球價值鏈分析
- 市場動態(DRO)
- 資訊來源及延伸閱讀
- 圖片列表
- 關鍵見解
- 數據包
- 詞彙表
The China Micronutrient Fertilizer Market size is estimated at 614.8 million USD in 2025, and is expected to reach 866.1 million USD by 2030, growing at a CAGR of 7.10% during the forecast period (2025-2030).
The rising requirement of micronutrients to enhance the productivity may boost the growth of the market
- Micronutrient deficiency in soils is a widespread problem across the country. Some of the micronutrients are abundant on the earth's crust due to their immobile nature. They cause micronutrient deficiencies in crops.
- Copper is the common micronutrient fertilizer used in crop production in the country. It accounted for about 27.6% of the total micronutrient fertilizer market value in 2022. One of the micronutrients that plants require in small amounts is copper (Cu). It is necessary for photosynthesis, essential for plant respiration, and helps the plant metabolize proteins and carbohydrates. Copper enhances the color of vegetables as well as the color of flowers and plays a key role in protein formation.
- Most of the soils in China have an adequate amount of copper. However, in vegetable crops, the average copper nutrient application rate was 0.2% higher than the average copper application rate in field crops in 2022. Because copper is an immobile element in plants, symptoms of copper deficiency appear first in the plant's younger sections.
- Zinc is the most consumed micronutrient in the country, accounting for the second largest market share by the value of 25.49% in 2022. Zinc is needed in very small amounts by plants. The normal concentration of Zn in most plants is between 20 to 100 ppm. However, this small amount of Zn plays a key role in plants as an enzyme co-factor and a structural component in proteins.
- Due to factors like the requirement for increased productivity and output, as well as the necessity to maintain food and nutritional security for the area's constantly expanding population, the market may expand during 2023-2030 with a CAGR of 6.9%, and the emergence of advanced fertilizers may also contribute to micronutrient consumption.
China Micronutrient Fertilizer Market Trends
The expansion of the cultivation area is driven by increasing demand for food and the country's goal to achieve self-sufficiency in staple food
- China's cultivation area for field crops expanded marginally from 126.6 million ha in 2018 to 127.8 million ha in 2022, representing 70.8% of the total cultivated land. In 2022, Corn dominated the field crop landscape, commanding a 34.2% share, trailed by rice at 23.6% and wheat at 18.3%. This increase in cultivation area is poised to drive up fertilizer demand in the nation.
- China's field crop calendar revolves around two seasons: spring/summer (April-September) and winter. Spring crops encompass early corn, early rice, early wheat, and cotton, while winter crops center around winter wheat and rapeseed. Yet, it's rice and corn that take the spotlight, contributing to a third of China's grain output. As the world's leading rice producer, China dedicated 30 million hectares to rice farming in 2022, yielding a bountiful 210 million tons. Key rice-growing regions span Heilongjiang, Hunan, Jiangxi, Hubei, Jiangsu, Sichuan, Guangxi, Guangdong, and Yunan. Looking at corn, China was set to produce 277.2 million tons in 2022-2023, a 4.6 million ton surge from the previous year, buoyed by a robust harvest. The Northeast provinces of Heilongjiang, Jilin, and Inner Mongolia stand out as the corn powerhouses.
- While spring dominates China's cropping season, it grapples with heat spikes in June and July. Rice, a dietary staple for millions, bears the brunt. These scorching temperatures, coupled with meager rainfall, exacerbate mineral depletion in the soil, necessitating higher fertilizer application. Such arid conditions can also curtail crop yields.
In China, rapeseed or canola is applied with large amounts of micronutrients compared to other field crops
- Micronutrients play a vital role in crop nutrition and growth, and their deficiency significantly impacts yields. Field crops typically receive an average application rate of 5.2 kg/hectare for micronutrient fertilizers. Among these, manganese takes the lead, with an application rate of 9.8 kg/hectare in 2022, despite being the eleventh most abundant micronutrient in the earth's crust. However, when the soil pH reaches seven or higher, chemical and microbial oxidation occur, leading to the immobilization of plant-available Mn2+. This, in turn, triggers manganese deficiency in plants.
- Following manganese, copper took the market lead with an application rate of 7.3 kg/hectare, trailed by zinc at 4.1 kg/hectare, and iron at 3.3 kg/hectare in 2022.
- In China, rapeseed or canola stands out for its higher micronutrient application rates compared to other field crops. It receives an average of 10.79 kg/hectare of micronutrient fertilizers, given the significant impact of micronutrient deficiency on oil yield. Notably, foliar application of manganese and molybdenum has shown a 1% increase in oil content in the seeds.
- Micronutrient deficiencies in soil can arise from excessive phosphate fertilization and other natural factors. Phosphate, in particular, can limit the availability of iron, zinc, and copper to crops. In China, a strategy was adopted to enhance field crop yields by reducing phosphate fertilization while simultaneously increasing zinc fertilization.
- Optimally applying micronutrient fertilizers can enhance plant efficiency in absorbing primary nutrients from the soil, thereby reducing the overall fertilizer requirement in vegetable crops.
China Micronutrient Fertilizer Industry Overview
The China Micronutrient Fertilizer Market is fragmented, with the top five companies occupying 27.14%. The major players in this market are Coromandel International Ltd., Hebei Monband Water Soluble Fertilizer Co. Ltd, ICL Group Ltd, Sociedad Quimica y Minera de Chile SA and Yara International ASA (sorted alphabetically).
Additional Benefits:
- The market estimate (ME) sheet in Excel format
- 3 months of analyst support
TABLE OF CONTENTS
1 EXECUTIVE SUMMARY & KEY FINDINGS
2 REPORT OFFERS
3 INTRODUCTION
- 3.1 Study Assumptions & Market Definition
- 3.2 Scope of the Study
- 3.3 Research Methodology
4 KEY INDUSTRY TRENDS
- 4.1 Acreage Of Major Crop Types
- 4.1.1 Field Crops
- 4.1.2 Horticultural Crops
- 4.2 Average Nutrient Application Rates
- 4.2.1 Micronutrients
- 4.2.1.1 Field Crops
- 4.2.1.2 Horticultural Crops
- 4.2.1 Micronutrients
- 4.3 Agricultural Land Equipped For Irrigation
- 4.4 Regulatory Framework
- 4.5 Value Chain & Distribution Channel Analysis
5 MARKET SEGMENTATION (includes market size in Value in USD and Volume, Forecasts up to 2030 and analysis of growth prospects)
- 5.1 Product
- 5.1.1 Boron
- 5.1.2 Copper
- 5.1.3 Iron
- 5.1.4 Manganese
- 5.1.5 Molybdenum
- 5.1.6 Zinc
- 5.1.7 Others
- 5.2 Application Mode
- 5.2.1 Fertigation
- 5.2.2 Foliar
- 5.2.3 Soil
- 5.3 Crop Type
- 5.3.1 Field Crops
- 5.3.2 Horticultural Crops
- 5.3.3 Turf & Ornamental
6 COMPETITIVE LANDSCAPE
- 6.1 Key Strategic Moves
- 6.2 Market Share Analysis
- 6.3 Company Landscape
- 6.4 Company Profiles
- 6.4.1 Coromandel International Ltd.
- 6.4.2 Grupa Azoty S.A. (Compo Expert)
- 6.4.3 Haifa Group
- 6.4.4 Hebei Monband Water Soluble Fertilizer Co. Ltd
- 6.4.5 ICL Group Ltd
- 6.4.6 Sociedad Quimica y Minera de Chile SA
- 6.4.7 Yara International ASA
7 KEY STRATEGIC QUESTIONS FOR FERTILIZER CEOS
8 APPENDIX
- 8.1 Global Overview
- 8.1.1 Overview
- 8.1.2 Porter's Five Forces Framework
- 8.1.3 Global Value Chain Analysis
- 8.1.4 Market Dynamics (DROs)
- 8.2 Sources & References
- 8.3 List of Tables & Figures
- 8.4 Primary Insights
- 8.5 Data Pack
- 8.6 Glossary of Terms
 2026年全球微量元素肥料市場報告
 微量元素肥料市場報告:趨勢、預測與競爭分析(至2031年)
 中東和非洲微量營養素肥料:市場佔有率分析、行業趨勢、統計數據、成長預測(2025-2030 年)亞太地區微量營養素肥料:市場佔有率分析、產業趨勢和成長預測(2025-2030 年)北美微量營養素肥料:市場佔有率分析、行業趨勢和成長預測(2025-2030 年)南美微量營養素肥料:市場佔有率分析、行業趨勢和成長預測(2025-2030 年)印度微量營養素肥料:市場佔有率分析、行業趨勢和統計數據、成長預測(2025-2030 年)微量營養素肥料:市場佔有率分析、產業趨勢與統計、成長預測(2025-2030 年)歐洲微量營養素肥料市場佔有率分析、產業趨勢與成長預測(2025-2030年)美國微量營養素肥料:市場佔有率分析、行業趨勢和統計數據、成長預測(2025-2030 年)