


 |
市場調查報告書
商品編碼
1693389
美國密封劑:市場佔有率分析、行業趨勢和統計數據、成長預測(2025-2030 年)United States Sealants - Market Share Analysis, Industry Trends & Statistics, Growth Forecasts (2025 - 2030) |
||||||
價格
※ 本網頁內容可能與最新版本有所差異。詳細情況請與我們聯繫。
簡介目錄
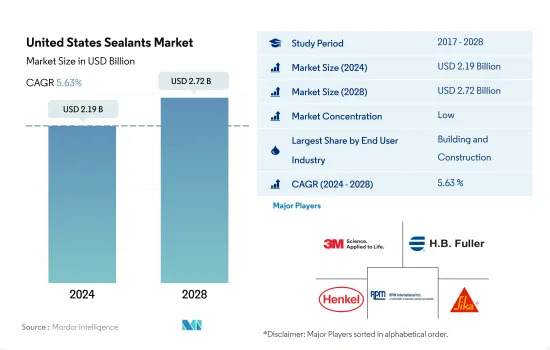
預計 2024 年美國密封劑市場規模為 21.9 億美元,到 2028 年將達到 27.2 億美元,預測期內(2024-2028 年)的複合年成長率為 5.63%。
美國家用電器銷售成長 4.3%,推動了密封膠的需求
- 密封劑因其用途廣泛,在建設產業中廣泛應用,包括防水、防風雨密封、裂縫密封和接縫密封。預計到 2030 年,美國建設產業將佔全球建築業成長的 11.1%,因此占美國密封劑市場的最大佔有率。建設產業是密封劑的主要終端用戶,具有多種應用。
- 密封劑廣泛應用於汽車工業,因為它們可以應用於各種表面,包括玻璃、金屬、塑膠和塗漆表面,其特性有利於汽車工業,包括極端耐候性、耐用性和長壽命。它也用於引擎和汽車墊圈。 2020 年電動車銷量成長了 2.4%。預計這將在預測期內增加對汽車矽膠密封膠的需求。
- 各種密封膠廣泛應用於電子、電氣設備製造中,扮演灌封和材料保護的角色。它們用於密封感測器、電纜等。美國消費電子市場預計將成長 4.3%,從而推動 2022-2028 年預測期內對矽膠密封膠的需求。在醫療保健行業,密封劑用於組裝和密封醫療設備組件。預計在 2022-2028 年預測期內,美國市場醫療保健投資的增加也將導致對密封劑的需求增加。
美國密封膠市場趨勢
政府投資,例如 2022-2026 年價值 72.5 億美元的「重組美國基礎設施」(INFRA)計劃,將推動國內建設
- 美國是北美最大的建築業國家。該國人均GDP為25,350美元,預計到2022年將成長與前一年同期比較%。建築業占美國GDP的近4.2%。影響美國建築業的因素包括新投資、住宅和非住宅建築以及政府政策。
- 2021 年公共部門建築支出降至 3,463 億美元,而 2020 年為 3,612 億美元。然而,私部門建築支出在 2021 年有所增加,達到 12,454 億美元,而 2020 年為 11,079 億美元。
- 1 月建築許可中的住宅建築(包括私人住宅)經季節性已調整的的年率為 189.9 萬套。這比12月修訂後的188.5萬輛高出0.7%,比2021年1月的188.3萬輛高出0.8%。
- 2022年3月,美國運輸部(USDOT)宣布,重組美國基礎設施(INFRA)計畫將在2022至2026會計年度期間向各州和地區撥款72.5億美元,用於建設具有國家或地區重要性的多式聯運貨運和公路計劃。預計這些因素將活性化預測期內美國的建設活動增加。
由於政府達成協議,75% 的汽車零件將在美國、加拿大和墨西哥生產,汽車產量將會增加。
- 2019年,美國汽車業年產量下降約3.5%,原因包括美國對美國的製裁以及對鋼鐵和鋁進口徵收關稅,尤其是對加拿大和墨西哥這兩個美國汽車業最大的進口金屬來源國徵收關稅。由於營運和供應鏈限制,加上新冠疫情和隨後的停工導致工人無法工作,2020 年汽車產量與 2019 年相比下降了約 20%。 2021年疫情過後,半導體晶片短缺和其他供應鏈限制正在限制汽車產量的成長。
- 在美國,商用車產量從 2017 年的 73% 增加到 2020 年的 79%。這是因為皮卡和其他輕型商用車 (LCV) 因其效用需求不斷增加。預計在預測期內,輕型商用車的需求將持續成長。
- 美國是繼中國和歐洲之後的第三大電動車製造國。美國44 家主要組裝廠中有 7 家參與生產電動車 (EV),約占美國生產能力的 16%。通用汽車擁有三輛,特斯拉擁有兩輛,Rivian 和 Lucid Motors 各擁有一輛。 2020 年至 2021 年,電動車的需求增加了 85%,預計該國電動車需求的持續成長將在預測期內推動產量成長。 《美國-加拿大-墨西哥協議》的實施預計將在預測期內促進汽車產量成長,該協議規定 75% 的汽車必須在三個參與國之一生產,以享受零關稅優惠。
美國密封劑產業概況
美國密封劑市場分散,前五大公司佔33.35%的市場。該市場的主要企業有:3M、HB Fuller Company、Henkel AG & Co. KGaA、RPM International Inc. 和 Sika AG(按字母順序排列)
其他福利
- Excel 格式的市場預測 (ME) 表
- 3個月的分析師支持
目錄
第1章執行摘要和主要發現
第2章 報告要約
第3章 引言
- 研究假設和市場定義
- 研究範圍
- 調查方法
第4章 產業主要趨勢
- 最終用戶趨勢
- 航太
- 車
- 建築與施工
- 法律規範
- 美國
- 價值鍊和通路分析
第5章市場區隔
- 最終用戶產業
- 航太
- 車
- 建築與施工
- 衛生保健
- 其他最終用戶產業
- 樹脂
- 丙烯酸纖維
- 環氧樹脂
- 聚氨酯
- 矽膠
- 其他樹脂
第6章 競爭格局
- 關鍵策略趨勢
- 市場佔有率分析
- 商業狀況
- 公司簡介
- 3M
- Arkema Group
- Dow
- HB Fuller Company
- Henkel AG & Co. KGaA
- Illinois Tool Works Inc.
- MAPEI SpA
- Pecora Corporation
- RPM International Inc.
- Sika AG
第7章:CEO面臨的關鍵策略問題
第 8 章 附錄
- 全球黏合劑和密封劑產業概況
- 概述
- 五力分析框架(產業吸引力分析)
- 全球價值鏈分析
- 促進因素、阻礙因素和機會
- 資訊來源及延伸閱讀
- 圖片列表
- 關鍵見解
- 資料包
- 詞彙表
簡介目錄
Product Code: 92445
The United States Sealants Market size is estimated at 2.19 billion USD in 2024, and is expected to reach 2.72 billion USD by 2028, growing at a CAGR of 5.63% during the forecast period (2024-2028).
Consumer electronics register a growth of 4.3% in the United States to boost the demand for sealants
- Sealants are widely used in the construction industry because of their diverse applications, such as waterproofing, weather sealing, cracks sealing, and joint sealing. The US construction industry is expected to account for 11.1% of global growth in construction up to 2030, thus, accounting for the highest share of the US sealants market by volume. The construction industry is the primary end-user industry of sealants owing to the varied applications and high awareness of the usage of sealants in the region.
- Sealants are widely used in the automotive industry because of their applicability to various surfaces such as glass, metal, plastic, painted surfaces, etc., and their features are helpful in the automotive industry, such as for extreme weather resistance, durability, and long-lasting. They are used in engines and car gaskets. Electric vehicle sales increased by 2.4% in 2020 because of its increased demand for personal mobility. This is expected to increase the demand for automotive silicone sealants in the forecast period.
- Different sealants are widely used in electronics and electrical equipment manufacturing for potting and protecting materials. They are used for sealing sensors and cables, etc. The consumer electronics market is expected to register a 4.3% growth in the United States and increase the demand for silicone sealants in the forecast period 2022-2028. Sealants are used in the healthcare industry for assembling and sealing medical device parts. The increase in healthcare investments in the US market is also anticipated to lead to a rise in the demand for sealants over the forecast period 2022-2028.
United States Sealants Market Trends
Government's' investments such as the Infrastructure for Rebuilding America (INFRA) program of USD 7.25 billion for FY 2022-2026 to increase construction in the country
- The United States is the largest country for construction activities in the North American region. The country had a GDP of USD 25,350 per capita, with an expected growth rate of 3.7% Y-o-Y in 2022. The construction industry contributes nearly 4.2% of the US GDP. The factors affecting the US construction industry are new investments, residential & non-residential constructions, government policies, and others.
- Public sector construction spending declined in 2021, recording USD 346.3 billion compared to USD 361.2 billion in 2020. However, the private sector construction spending increased in 2021 and was valued at USD 1,245.4 billion in 2021 compared to USD 1107.9 billion in 2020.
- The residential house construction, including privately-owned housing units authorized by building permits in January, was at a seasonally adjusted annual rate of 1,899,000. This was 0.7% above the revised December rate of 1,885,000 and 0.8% above the January 2021 rate of 1,883,000.
- In March 2022, the US Department of Transportation (USDOT) announced that the Infrastructure for Rebuilding America (INFRA) program would distribute USD 7.25 billion for FY 2022-2026 to all states and regions to build multimodal freight and highway projects of national or regional significance. These factors are expected to boost construction activities in the United States over the forecast period.
Government's United States-Canada-Mexico agreement of having 75% of automobile components produced in these 3 countries will increase the automotive production
- The US automotive industry witnessed a decline in annual production by around 3.5% in 2019 due to multiple factors, such as US sanctions on China and tariffs on steel and aluminum imports, especially from Canada and Mexico, two of the largest sources for imported metals for the US automotive industry. Automotive production fell by around 20% in 2020 compared to 2019 due to operational and supply chain restrictions coupled with worker unavailability resulting from the COVID-19 pandemic and the subsequent lockdowns. The semiconductor chip shortages and other supply chain constraints in 2021, which followed the pandemic, have been holding back automotive production growth.
- In the United States, the percentage of commercial vehicles manufactured increased from 73% in 2017 to 79% in 2020. This was due to the rising demand for pickup trucks and other Light Commercial Vehicles (LCVs) because of their multipurpose utility. This growth in the demand for LCVs is expected to continue in the forecast period.
- The United States is the third largest electric vehicle manufacturer after China and Europe. Seven of the 44 major US assembly plants, representing about 16% of US production capacity, are engaged in producing electric vehicles (EVs). General Motors own three, two are owned by Tesla, and Rivian and Lucid Motors own one site each. Demand for EVs grew 85% from 2020 to 2021, and this continuously increasing demand for EVs in the country is expected to drive production growth during the forecast period as well. The implementation of the United States-Canada-Mexico agreement, which mandates 75% of the cars to be produced in one of the three participating countries to avail zero tariffs, is expected to increase automotive production during the forecast period.
US Sealants Industry Overview
The United States Sealants Market is fragmented, with the top five companies occupying 33.35%. The major players in this market are 3M, H.B. Fuller Company, Henkel AG & Co. KGaA, RPM International Inc. and Sika AG (sorted alphabetically).
Additional Benefits:
- The market estimate (ME) sheet in Excel format
- 3 months of analyst support
TABLE OF CONTENTS
1 EXECUTIVE SUMMARY & KEY FINDINGS
2 REPORT OFFERS
3 INTRODUCTION
- 3.1 Study Assumptions & Market Definition
- 3.2 Scope of the Study
- 3.3 Research Methodology
4 KEY INDUSTRY TRENDS
- 4.1 End User Trends
- 4.1.1 Aerospace
- 4.1.2 Automotive
- 4.1.3 Building and Construction
- 4.2 Regulatory Framework
- 4.2.1 United States
- 4.3 Value Chain & Distribution Channel Analysis
5 MARKET SEGMENTATION (includes market size in Value in USD and Volume, Forecasts up to 2028 and analysis of growth prospects)
- 5.1 End User Industry
- 5.1.1 Aerospace
- 5.1.2 Automotive
- 5.1.3 Building and Construction
- 5.1.4 Healthcare
- 5.1.5 Other End-user Industries
- 5.2 Resin
- 5.2.1 Acrylic
- 5.2.2 Epoxy
- 5.2.3 Polyurethane
- 5.2.4 Silicone
- 5.2.5 Other Resins
6 COMPETITIVE LANDSCAPE
- 6.1 Key Strategic Moves
- 6.2 Market Share Analysis
- 6.3 Company Landscape
- 6.4 Company Profiles (includes Global Level Overview, Market Level Overview, Core Business Segments, Financials, Headcount, Key Information, Market Rank, Market Share, Products and Services, and Analysis of Recent Developments).
- 6.4.1 3M
- 6.4.2 Arkema Group
- 6.4.3 Dow
- 6.4.4 H.B. Fuller Company
- 6.4.5 Henkel AG & Co. KGaA
- 6.4.6 Illinois Tool Works Inc.
- 6.4.7 MAPEI S.p.A.
- 6.4.8 Pecora Corporation
- 6.4.9 RPM International Inc.
- 6.4.10 Sika AG
7 KEY STRATEGIC QUESTIONS FOR ADHESIVES AND SEALANTS CEOS
8 APPENDIX
- 8.1 Global Adhesives and Sealants Industry Overview
- 8.1.1 Overview
- 8.1.2 Porter's Five Forces Framework (Industry Attractiveness Analysis)
- 8.1.3 Global Value Chain Analysis
- 8.1.4 Drivers, Restraints, and Opportunities
- 8.2 Sources & References
- 8.3 List of Tables & Figures
- 8.4 Primary Insights
- 8.5 Data Pack
- 8.6 Glossary of Terms
02-2729-4219
+886-2-2729-4219
 中國密封膠:市場佔有率分析、產業趨勢與統計、成長預測(2025-2030)印尼密封劑:市場佔有率分析、行業趨勢和統計數據、成長預測(2025-2030 年)印度密封膠:市場佔有率分析、產業趨勢與統計、2025-2030 年成長預測密封劑:市場佔有率分析、行業趨勢和統計數據、成長預測(2025-2030 年)德國密封劑:市場佔有率分析、行業趨勢和成長預測(2025-2030 年)新加坡密封劑:市場佔有率分析、行業趨勢和統計數據、成長預測(2025-2030 年)日本密封劑:市場佔有率分析、產業趨勢與統計、成長預測(2025-2030 年)法國密封劑:市場佔有率分析、行業趨勢和統計數據、成長預測(2025-2030 年)泰國密封劑:市場佔有率分析、行業趨勢和成長預測(2025-2030 年)義大利密封劑:市場佔有率分析、行業趨勢和統計數據、成長預測(2025-2030 年)
▼