


 |
市場調查報告書
商品編碼
2154392
廢棄物焚化發電廠原料:市場佔有率分析、產業趨勢和統計數據以及成長預測(2026-2031 年)Waste-to-Energy (WtE) Plant Feedstock - Market Share Analysis, Industry Trends & Statistics, Growth Forecasts (2026 - 2031) |
||||||

※ 本網頁內容可能與最新版本有所差異。詳細情況請與我們聯繫。
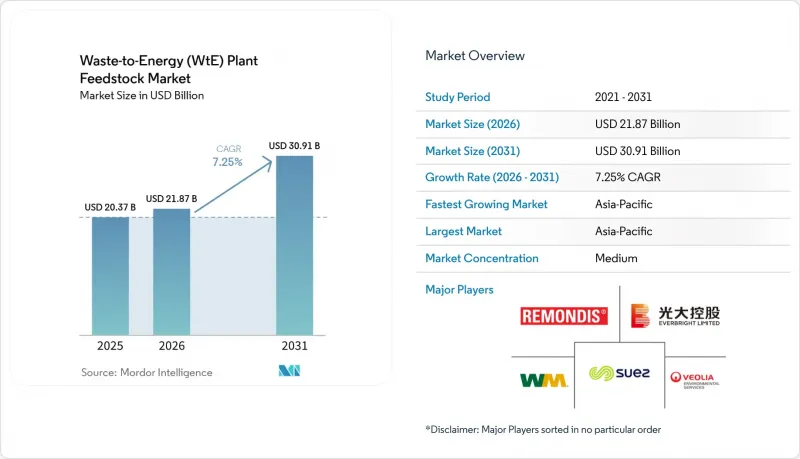
根據 Mordor Intelligence 預測,垃圾焚化發電的市場規模預計將從 2025 年的 203.7 億美元成長到 2026 年的 218.7 億美元,然後從 2026 年到 2031 年以 7.25% 的複合年成長率成長,到 2031 億美元達到 309.1 億美元。
全球垃圾焚化發電原料市場趨勢及洞察
減少垃圾掩埋廢棄物的義務以及地方政府處理能力不足
掩埋的監管規定使得市政當局在確保原料供應方面面臨合規挑戰。如果市政當局被要求對有機物進行分類或將剩餘廢棄物再利用,垃圾焚化發電發電廠的原料市場就能獲得更穩定的供應。加州的AB-70法案正在2025-2026年立法會議期間審議,預計將於2027年1月前強制將利用再利用有機廢棄物生產的管線生物甲烷納入監管範圍。佛羅裡達州2025年的立法允許為城市固態垃圾焚化發電計畫提供津貼和財政支持,包括支持廢棄物收集的基礎設施。 2025年8月,新澤西州通過了食物廢棄物回收規則,強制指定產生者進行源頭分類,並將合格的材料直接送往有資格的設施。因此,與完全依賴電價的項目相比,長期入場費合約可以為營運商提供更穩定的收入。
透過人工智慧分類和數位化燃燒控制穩定原料品質。
穩定熱輸出可提高發電量,降低設備負荷,並實現更可靠的電廠運作。在京畿道進行的一項智慧燃燒控制商業測試中,六個月內發電量提高了3.09%,一氧化碳排放量減少了60.72%,氮氧化物濃度降低了7.33%。荏原環境工廠開發了影像識別系統,用於識別合格、危險和廢棄物,廢棄物報告指出該系統已實現90%的起重機操作自動化。 2024年,Jaipur Robotics公司將電腦視覺技術引入瑞士一家廢棄物儲存設施,用於繪製熱輸出圖,並輔助操作人員在燃燒前混合料。 2025年,Canadavia公司宣布了一種電廠測試方法,該方法利用感測器數據將燃燒後爐排上的燃燒面積減少60%。在垃圾焚化發電發電廠的原料市場中,記錄品質並允許追蹤原料特性的合約預計將變得越來越重要。
前期投資高、合規成本高、授權風險大。
大規模焚化發電廠在實現獲利前需要大量資金投入。在目前北美和歐洲的成本環境下,一座年處理量達100萬噸的公用事業規模垃圾焚化發電廠可能需要12億美元的資本投資。貸款機構通常要求專案具備合約收入、成熟的技術、獨立的工程評估以及1.50或更高的負債權益比,才會提供長期企劃案融資。 MVV公司於2025年12月為其位於梅德沃斯(Medworth)的垃圾焚燒發電廠獲得了資金籌措,該廠建成後預計每年可處理高達62.5萬噸的殘餘廢棄物。此外,私人業者還面臨現有合約可能無法涵蓋的碳排放成本。在垃圾焚化發電的原料市場中,已建立的市政協議和公眾支持至關重要,因為社區的擔憂和許可證核准的延誤可能會進一步增加時間和成本。
細分市場分析
截至2025年,都市固態廢棄物佔垃圾焚化發電發電廠原料市場佔有率的68.3%。這一地位反映了歐洲、北美和東亞地區已建立的完善的收集系統以及與市政當局簽訂的特許經營協議。這些系統為營運商提供了更清晰的處理量和入場費收入預測。預計到2031年,農業和生質能殘餘物將以9.8%的複合年成長率成長。這一領域的成長動力源自於人們致力於從作物殘渣、牲畜糞便和其他農業材料中提取價值。科學文獻持續指出,將殘餘物轉化為生生質燃料和生物產品是可行的途徑,但供應的季節性波動仍是實際限制因素。
工業廢棄物是製造業叢集中的次要資源,尤其是在生產商尋求材料回收和現場能源利用的地區。隨著污水處理廠擴大厭氧消化規模,污水污泥的重要性日益凸顯。塑膠和不可回收廢棄物可以提高熱處理混合物的能量含量,但其使用必須符合回收和排放法規。醫療和生物醫學廢棄物的處理成本高昂,因為需要特殊處理和遵守相關法規。建築和拆除廢棄物由於可能含有土壤、混凝土和金屬,仍然難以利用。 2025年的一項系統性綜述表明,人工智慧(AI)和機器學習在生質能殘渣調查中的應用日益廣泛,有助於提高分類和過程建模的準確性。因此,垃圾焚化發電的原料產業正從完全依賴未經處理的混合廢棄物轉向更可控的混合和預處理。
區域分析
截至2025年,亞太地區將佔垃圾焚化發電發電廠原料市場規模的39.7%,預計2031年將以8.1%的複合年成長率成長。儘管中國擁有龐大的設備安裝規模,但政策重點正轉向提高營運品質和飛灰管理。國務院2026年計畫要求新計畫在取得施工許可的同時,必須落實飛灰處置措施。在印度,都市固體廢棄物和農業殘餘物蘊藏著巨大的成長潛力。印度政府已撥款54億印度盧比用於2026-2027財政年度的作物殘餘物管理。 2026年4月,JFE工程公司在安得拉邦的兩個專案中投資7.5億日圓(約520萬美元),收購了25%的股份。
預計到2025年,歐洲將成為該市場第二大區域。歐洲垃圾焚化發電原料市場正從大規模產能擴張轉向資產最佳化和東歐地區的選擇性開發。歐洲營運商也在積極應對日益嚴格的碳計量以及對原料特性日益成長的需求。波蘭、羅馬尼亞和捷克共和國仍然是重要的市場,因為掩埋法規正在推動新的廢棄物能力的擴張。根據Eversheds Sutherland的報告,波蘭的垃圾焚化發電資產作為長期基礎設施資產正吸引著各方的注意。歐洲垃圾焚化發電發電廠原物料市場正日益受到以下因素的影響:能否取得化石燃料含量低、生物來源材料含量高的原料,並對其碳含量進行監測。
北美、南美以及中東和非洲地區佔據了剩餘的區域需求。北美地區垃圾焚化發電的原料市場得益於廢棄物再利用措施和可再生氣體的開發,各州的相關項目也為有機垃圾處理提供了更清晰的路徑。 2026年5月,Mobius Renewables收購了液化空氣集團在美國、法國、挪威和瑞典的沼氣業務,其中包括垃圾掩埋氣製可再生天然氣的轉化設施和農業廢棄物處理設施。在南美,甘蔗渣等農業殘餘物具有巨大的潛力。中東和非洲地區則受惠於一系列城市廢棄物管理專案和計畫。印尼2025年第109號總統令規定,未來30年內,每度電價固定為0.20美元,提高了營運商的收入前景,但也使其面臨長期通膨風險。
其他好處:
- Excel格式的市場預測(ME)表
- 3個月的分析師支持
目錄
第1章:引言
- 研究假設和市場定義
- 調查範圍
第2章:調查方法
第3章執行摘要
第4章 市場狀況
- 市場概覽
- 市場促進因素
- 強制減少廢棄物掩埋量和地方政府處理能力不足
- 城市殘餘廢棄物的官民合作關係項目
- 可再生天然氣和生物液化天然氣提取合約
- 排碳權與循環經濟收入的綜效
- 透過人工智慧分類和數位化燃燒控制穩定原料品質。
- 熱需求與區域供熱系統的整合
- 市場限制因素
- 初始投資和資金籌措風險較大
- 原料污染和熱值波動
- 應對排放氣體法規和不斷上漲的改裝成本
- 當地居民的反對以及授權流程的延誤。
- 供應鏈分析
- 波特五力分析
- 科技趨勢
- 監理情勢
- 投資分析
第5章 市場規模與成長預測
- 依原料類型
- 一般廢棄物(MSW)
- 工業廢棄物
- 農業和生質能殘渣
- 醫療和生物醫學廢棄物
- 塑膠和不可回收廢棄物
- 污水污泥
- 其他(建築和拆除廢棄物等)
- 透過使用
- 發電
- 熱量和蒸氣的產生
- 熱電聯產(CHP)
- 燃料生產(RDF、沼氣、合成氣)
- 最終用戶
- 地方政府
- 工業私營發電廠
- 商業設施
- 獨立發電商(IPP)
- 按地區
- 北美洲
- 美國
- 加拿大
- 墨西哥
- 歐洲
- 德國
- 法國
- 義大利
- 西班牙
- 英國
- 波蘭
- 俄羅斯
- 其他歐洲國家
- 亞太地區
- 中國
- 印度
- 日本
- 韓國
- 澳洲
- 印尼
- 越南
- 泰國
- 其他亞太國家
- 南美洲
- 巴西
- 阿根廷
- 智利
- 其他南美國家
- 中東和非洲
- 沙烏地阿拉伯
- 阿拉伯聯合大公國
- 埃及
- 南非
- 摩洛哥
- 其他中東和非洲國家
- 北美洲
第6章 競爭情勢
- 市場集中度
- 策略趨勢
- 市佔率分析
- 公司簡介
- Waste Management, Inc.
- Republic Services, Inc.
- Veolia Environnement SA
- SUEZ Group
- Urbaser SA
- China Everbright Environment Group Limited
- Reworld
- FCC Environment
- Biffa plc
- Renewi plc
- Remondis SE & Co. KG
- Stericycle, Inc.
- Ramky Enviro Engineers Limited
- China Green Environmental Protection Group
- Cleanaway Waste Management Limited
- Sembcorp Industries Ltd
- PreZero
- Shanghai Environment Group Co., Ltd.
- Indaver NV
- GFL Environmental Inc.
第7章 市場機會與未來展望
According to Mordor Intelligence, the Waste-to-Energy plant feedstock market size is expected to grow from USD 20.37 billion in 2025 to USD 21.87 billion in 2026 and is forecast to reach USD 30.91 billion by 2031 at 7.25% CAGR over 2026-2031.
Global Waste-to-Energy (WtE) Plant Feedstock Market Trends and Insights
Landfill-Diversion Mandates and Municipal Capacity Gaps
Landfill restrictions are making feedstock access a compliance matter for municipal authorities. The waste-to-energy plant feedstock market gains more predictable volumes when municipalities must separate organics or divert residual waste. California's AB-70 is advancing through the 2025-2026 session and would require regulations to include pipeline biomethane derived from diverted organic waste by January 2027. Florida's 2025 statute permits grants and financial assistance for municipal solid-waste-to-energy projects, including infrastructure that supports waste aggregation. New Jersey adopted food-waste recycling rules in August 2025 that require source separation from designated generators and channel eligible material to permitted facilities. Long-term gate-fee agreements can therefore provide operators with steadier revenue than projects exposed only to electricity prices.
Feedstock-Quality Stabilization Through AI Sorting and Digital Combustion Control
Stable calorific value improves power output, reduces equipment stress, and supports more reliable plant operation. A commercial trial of intelligent combustion control in Gyeonggi Province increased power generation by 3.09%, reduced carbon monoxide emissions by 60.72%, and lowered nitrogen oxide concentrations by 7.33% over 6 months. EBARA Environmental Plant has developed an image-recognition system that identifies unsuitable, hazardous, and oversized waste, and it reported 90% operatorless crane control. Jaipur Robotics deployed computer vision at a Swiss waste bunker in 2024 to map calorific values and help operators blend materials before combustion. Kanadevia presented a plant-trial method in 2025 that used sensor data to reduce the combustion area on the post-combustion grate by 60%. The waste-to-energy plant feedstock market is likely to place greater value on contracts that document quality and provide traceable feedstock characteristics.
High Upfront Capital, Compliance Costs, and Permitting Risk
Large plants require substantial capital before they can generate revenue. A utility-scale facility processing 1 million tonnes annually can require capital expenditure of USD 1.2 billion under current North American and European cost conditions. Lenders commonly seek contracted revenues, proven technology, independent engineering review, and debt-service coverage above 1.50x before they provide long-tenor project finance. MVV secured financing for its Medworth facility in December 2025, which is intended to process up to 625,000 tonnes of residual waste annually once complete. Private operators also face carbon and emissions costs that may not be recoverable through existing contracts. Community concerns and slow permitting can add further time and cost, making established municipal agreements and public support important for the waste-to-energy plant feedstock market.
Other drivers and restraints analyzed in the detailed report include:
- Carbon-Credit and Circular-Economy Revenue Stacking
- Public-Private Pipelines and Renewable Gas Offtake
- Feedstock Contamination and Calorific-Value Volatility
For complete list of drivers and restraints, kindly check the Table Of Contents.
Segment Analysis
Municipal Solid Waste held 68.3% of the waste-to-energy plant feedstock market share in 2025. Its position reflects established collection systems and municipal concession agreements across Europe, North America, and East Asia. Those systems give operators better visibility on volume and gate-fee income. Agricultural & Biomass Residue is forecast to grow at a 9.8% CAGR through 2031. The segment is supported by efforts to capture value from crop residues, manure, and other farm-based materials. Scientific literature continues to identify residue conversion as a route to biofuels and bioproducts, although seasonal availability remains a practical constraint.
Industrial Waste supplies a secondary stream in manufacturing clusters, especially where producers seek material recovery and on-site energy use. Sewage sludge has become more relevant as wastewater facilities are expanding anaerobic digestion. Plastic and non-recyclable waste can improve energy content in thermal mixes, although its use must remain consistent with recycling and emissions requirements. Medical and biomedical waste commands higher processing fees because it requires specialized handling and compliance. Construction and demolition waste remains difficult to use because it can contain soil, concrete, and metals. A 2025 systematic review found growing use of artificial intelligence and machine learning in biomass-residue research, supporting better sorting and process modeling. The waste-to-energy plant feedstock industry is therefore moving toward more controlled blending and pretreatment rather than relying only on unprocessed mixed waste.
Complete Report Scope:
- By Feedstock Type
- Municipal Solid Waste (MSW)
- Industrial Waste
- Agricultural & Biomass Residue
- Medical/Biomedical Waste
- Plastic & Non-Recyclable Waste
- Sewage Sludge
- Others (Construction & Demolition Waste, etc.)
- By Application
- Electricity Generation
- Heat/Steam Generation
- Combined Heat & Power (CHP)
- Fuel Production (RDF, Biogas, Syngas)
- By End User
- Municipal Corporations
- Industrial Captive Plants
- Commercial Establishments
- Independent Power Producers (IPPs)
- By Geography
- North America
- United States
- Canada
- Mexico
- Europe
- Germany
- France
- Italy
- Spain
- United Kingdom
- Poland
- Russia
- Rest of Europe
- Asia-Pacific
- China
- India
- Japan
- South Korea
- Australia
- Indonesia
- Vietnam
- Thailand
- Rest of Asia-Pacific
- South America
- Brazil
- Argentina
- Chile
- Rest of South America
- Middle East and Africa
- Saudi Arabia
- United Arab Emirates
- Egypt
- South Africa
- Morocco
- Rest of Middle East and Africa
- North America
Geography Analysis
Asia-Pacific accounted for 39.7% of the waste-to-energy plant feedstock market size in 2025 and is forecast to grow at an 8.1% CAGR through 2031. China has a large installed base, but policy is shifting attention toward better operating quality and fly-ash management. The State Council's 2026 plan requires new projects to address fly-ash disposal along with construction approval. India offers growth potential through municipal waste and agricultural residue. The government allocated INR 5.4 billion for crop-residue management in 2026-2027. JFE Engineering invested JPY 750 million, equal to USD 5.2 million, for a 25% interest in 2 Andhra Pradesh projects in April 2026.
Europe held the second-largest regional position in 2025. The waste-to-energy plant feedstock market in Europe is shifting from broad capacity additions to asset optimization and selective development in Eastern Europe. European operators are also adapting to tighter carbon accounting and higher expectations for feedstock characterization. Poland, Romania, and the Czech Republic remain relevant because landfill rules support new waste-treatment capacity. Eversheds Sutherland reported that Polish waste-to-energy assets are attracting interest as long-term infrastructure assets. The waste-to-energy plant feedstock market in Europe is increasingly shaped by the ability to secure lower-fossil, higher-biogenic material and monitor its carbon content.
North America, South America, and the Middle East & Africa make up the remaining regional demand. The waste-to-energy plant feedstock market in North America is supported by diversion measures and renewable-gas development, with state programs providing more defined pathways for organics. Mobius Renewables acquired Air Liquide biogas activities in the United States, France, Norway, and Sweden in May 2026, including landfill-gas-to-renewable-natural-gas and farm-waste sites. South America has potential in agricultural residues, including sugarcane bagasse. The Middle East & Africa is supported by urban waste-management programs and project pipelines. Indonesia's Presidential Regulation No. 109 of 2025 set a fixed USD 0.20/kWh tariff for 30 years, which improves revenue visibility but leaves operators exposed to long-term inflation risk.
- Waste Management, Inc.
- Republic Services, Inc.
- Veolia Environnement S.A.
- SUEZ Group
- Urbaser S.A.
- China Everbright Environment Group Limited
- Reworld
- FCC Environment
- Biffa plc
- Renewi plc
- Remondis SE & Co. KG
- Stericycle, Inc.
- Ramky Enviro Engineers Limited
- China Green Environmental Protection Group
- Cleanaway Waste Management Limited
- Sembcorp Industries Ltd
- PreZero
- Shanghai Environment Group Co., Ltd.
- Indaver NV
- GFL Environmental Inc.
Additional Benefits:
- The market estimate (ME) sheet in Excel format
- 3 months of analyst support
TABLE OF CONTENTS
1 INTRODUCTION
- 1.1 Study Assumptions and Market Definition
- 1.2 Scope of the Study
2 RESEARCH METHODOLOGY
3 EXECUTIVE SUMMARY
4 MARKET LANDSCAPE
- 4.1 Market Overview
- 4.2 Market Drivers
- 4.2.1 Landfill-Diversion Mandates and Municipal Capacity Gaps
- 4.2.2 Public-Private Partnership Pipelines for Urban Residual Waste
- 4.2.3 Renewable Gas and Bio-LNG Offtake Commitments
- 4.2.4 Carbon-Credit and Circular-Economy Revenue Stacking
- 4.2.5 Feedstock-Quality Stabilization Through AI Sorting and Digital Combustion Control
- 4.2.6 Heat-Offtake and District-Energy Integration
- 4.3 Market Restraints
- 4.3.1 High Upfront Capital and Financing Risk
- 4.3.2 Feedstock Contamination and Calorific-Value Volatility
- 4.3.3 Emissions Compliance and Retrofit Cost Escalation
- 4.3.4 Community Opposition and Permitting Delays
- 4.4 Supply-Chain Analysis
- 4.5 Porter's Five Forces Analysis
- 4.5.1 Bargaining Power of Suppliers
- 4.5.2 Bargaining Power of Buyers
- 4.5.3 Threat of New Entrants
- 4.5.4 Threat of Substitutes
- 4.5.5 Competitive Rivalry
- 4.6 Technology Outlook
- 4.7 Regulatory Landscape
- 4.8 Investment Analysis
5 MARKET SIZE AND GROWTH FORECASTS
- 5.1 By Feedstock Type
- 5.1.1 Municipal Solid Waste (MSW)
- 5.1.2 Industrial Waste
- 5.1.3 Agricultural & Biomass Residue
- 5.1.4 Medical/Biomedical Waste
- 5.1.5 Plastic & Non-Recyclable Waste
- 5.1.6 Sewage Sludge
- 5.1.7 Others (Construction & Demolition Waste, etc.)
- 5.2 By Application
- 5.2.1 Electricity Generation
- 5.2.2 Heat/Steam Generation
- 5.2.3 Combined Heat & Power (CHP)
- 5.2.4 Fuel Production (RDF, Biogas, Syngas)
- 5.3 By End User
- 5.3.1 Municipal Corporations
- 5.3.2 Industrial Captive Plants
- 5.3.3 Commercial Establishments
- 5.3.4 Independent Power Producers (IPPs)
- 5.4 By Geography
- 5.4.1 North America
- 5.4.1.1 United States
- 5.4.1.2 Canada
- 5.4.1.3 Mexico
- 5.4.2 Europe
- 5.4.2.1 Germany
- 5.4.2.2 France
- 5.4.2.3 Italy
- 5.4.2.4 Spain
- 5.4.2.5 United Kingdom
- 5.4.2.6 Poland
- 5.4.2.7 Russia
- 5.4.2.8 Rest of Europe
- 5.4.3 Asia-Pacific
- 5.4.3.1 China
- 5.4.3.2 India
- 5.4.3.3 Japan
- 5.4.3.4 South Korea
- 5.4.3.5 Australia
- 5.4.3.6 Indonesia
- 5.4.3.7 Vietnam
- 5.4.3.8 Thailand
- 5.4.3.9 Rest of Asia-Pacific
- 5.4.4 South America
- 5.4.4.1 Brazil
- 5.4.4.2 Argentina
- 5.4.4.3 Chile
- 5.4.4.4 Rest of South America
- 5.4.5 Middle East and Africa
- 5.4.5.1 Saudi Arabia
- 5.4.5.2 United Arab Emirates
- 5.4.5.3 Egypt
- 5.4.5.4 South Africa
- 5.4.5.5 Morocco
- 5.4.5.6 Rest of Middle East and Africa
- 5.4.1 North America
6 COMPETITIVE LANDSCAPE
- 6.1 Market Concentration
- 6.2 Strategic Moves
- 6.3 Market Share Analysis
- 6.4 Company Profiles (includes Global Level Overview, Market Level Overview, Core Segments, Financials as available, Strategic Information, Products and Services, Recent Developments)
- 6.4.1 Waste Management, Inc.
- 6.4.2 Republic Services, Inc.
- 6.4.3 Veolia Environnement S.A.
- 6.4.4 SUEZ Group
- 6.4.5 Urbaser S.A.
- 6.4.6 China Everbright Environment Group Limited
- 6.4.7 Reworld
- 6.4.8 FCC Environment
- 6.4.9 Biffa plc
- 6.4.10 Renewi plc
- 6.4.11 Remondis SE & Co. KG
- 6.4.12 Stericycle, Inc.
- 6.4.13 Ramky Enviro Engineers Limited
- 6.4.14 China Green Environmental Protection Group
- 6.4.15 Cleanaway Waste Management Limited
- 6.4.16 Sembcorp Industries Ltd
- 6.4.17 PreZero
- 6.4.18 Shanghai Environment Group Co., Ltd.
- 6.4.19 Indaver NV
- 6.4.20 GFL Environmental Inc.
7 MARKET OPPORTUNITIES AND FUTURE OUTLOOK
- 7.1 White-Space and Unmet-Need Assessment

 廢棄物製紡織品轉化技術市場規模、佔有率和趨勢分析報告:按廢棄物類型、技術、最終用途、地區和細分市場預測(2026-2033 年)
 廢棄物預處理:替代燃料和原料(AFRs):市場佔有率分析、行業趨勢和統計數據、成長預測(2026-2031 年)固態回收燃料(SRF):市場佔有率分析、行業趨勢和統計數據以及成長預測(2026-2031 年)廢棄物衍生燃料(RDF):市場佔有率分析、行業趨勢和統計數據以及成長預測(2026-2031 年)替代燃料和原料(AFR)燃燒系統:市場佔有率分析、產業趨勢與統計、成長預測(2026-2031)新能源發電產業取代燃料與原料(AFRs):市場佔有率分析、產業趨勢與統計、成長預測(2026-2031)石油和天然氣行業的替代燃料和原料(AFR):市場佔有率分析、行業趨勢和統計數據、成長預測(2026-2031 年)美國垃圾焚化發電(WTE):市場佔有率分析、行業趨勢和統計數據以及成長預測(2026-2031 年)歐洲垃圾焚化發電:市場佔有率分析、行業趨勢和統計數據以及成長預測(2026-2031 年)
 2034年垃圾焚化發電市場預測-全球分析(依技術、廢棄物類型、能源產量、工廠產能、原料來源、應用、最終用戶、所有權結構、設施類型和地區分類)