


 |
市場調查報告書
商品編碼
2124625
海運:市場佔有率分析、產業趨勢與統計、成長預測(2026-2031)Maritime Freight Transport - Market Share Analysis, Industry Trends & Statistics, Growth Forecasts (2026 - 2031) |
||||||

※ 本網頁內容可能與最新版本有所差異。詳細情況請與我們聯繫。
據 Mordor Intelligence 稱,2025 年海運市場價值為 5997.8 億美元,預計到 2031 年將達到 8235.7 億美元,而 2026 年為 6323.6 億美元,預測期(2026-2031 年)的複合年成長率為 5.43%。
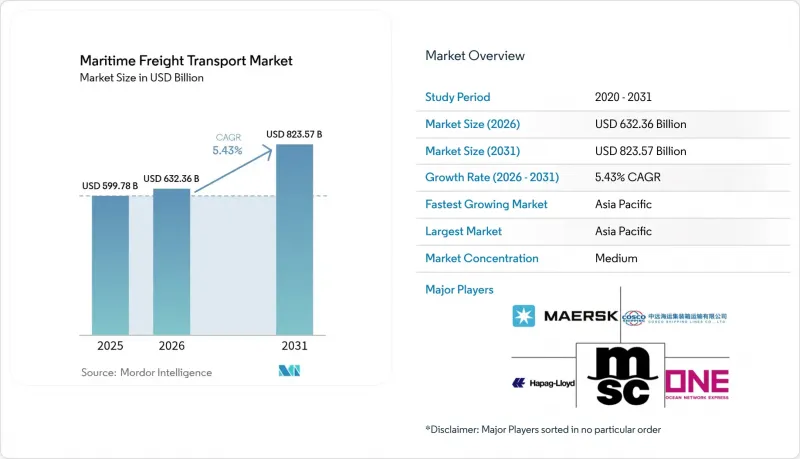
本報告按貨物類型(貨櫃貨物、乾散貨、液散貨、普通貨物、滾裝貨物)、終端用戶產業(電子及半導體、化學及石化、食品飲料等)及地區(北美、南美、亞太、歐洲、中東和非洲)進行細分。市場預測以美元計價。
全球海運市場趨勢與洞察
亞洲內部南南貿易走廊的快速發展
2023年,東協超越歐盟,成為中國最大的貿易夥伴,貿易額達4,688億美元,年增10.5%。這鞏固了亞洲貨運環線作為新成長引擎的地位。根據《中國—東協自由貿易協定》(ACFTA),逐步取消關稅正在簡化貨物流動,繞過西方轉運樞紐。計畫於2026年開通的平陸運河全長84英里,預計每年可運輸8,900萬噸貨物,降低供應鏈成本7.25億美元。製造業向東南亞轉移,增強了港口附近的產業叢集,並增加了對通往二級門戶的支線運輸的需求。由此帶來的貨物密度,促使人們投資建造15,000標準箱級的大型貨輪,這些貨輪專為短途高頻率運輸而最佳化設計。預計這些趨勢加在一起,將在預測期內使海運市場的複合年成長率提高約 1.2 個百分點。
近海捕撈正在推動沿海飼料魚的需求。
2024年,美國和墨西哥之間的跨境量創歷史新高,證實了近岸外包模式正在向墨西哥灣和加勒比海的支線航線擴展。大型航運公司現在繞過墨西哥灣的小規模港口,轉而與當地專業公司合作運營樞紐輻射式短途運輸服務,從而將門到門運輸週期縮短2至4天。 X-Press Feeders與六個歐洲港口達成協議,創建“綠色走廊”,這象徵著運營商在滿足範圍3排放目標的同時,努力抓住不斷成長的近岸運輸量。經營團隊表示,降低物流成本是主要動機,其中41%的人優先考慮接近性而非全球規模。不斷成長的需求推高了1500-2000標準箱船舶的運轉率和日租費率,使海運市場的成長軌跡提高了0.8個百分點。
港口基礎設施長期存在瓶頸
2025年,隨著新加坡和科倫坡接收途經好望角航線的船舶,這兩個港口的擁塞狀況將達到頂峰,堆場利用率將超過90%,平均泊位等待時間將增加兩倍。上海預計2025年1月迎來創紀錄的500萬標準貨櫃吞吐量,屆時正值美國關稅生效前。儘管新增了18個全自動碼頭,堆場設施仍將面臨巨大壓力。洛杉磯和長灘正面臨底盤短缺的問題,而麻六甲海峽則因氣候變遷而面臨地緣政治動盪和吃水限制。閘口自動化和連接內陸地區的鐵路建設投資緩慢,阻礙了貨物運輸速度,海運市場的長期複合年成長率下降了1.1個百分點。
細分市場分析
乾散貨運輸佔最大佔有率,預計到2025年將佔海運市場規模的28.65%,主要得益於中國鐵礦石和煤炭儲量的不斷成長,預計儲量將達到1.65億噸。然而,儘管噸位需求強勁成長,但計劃於2025年交付的3,600萬載重噸船舶可能會壓低總租金費率(TCE)。因此,營運商正將重點轉向與指數掛鉤的租船契約,以降低下行風險。對供應過剩的擔憂正在加速小型船舶的提前拆解,這抑制了特定航線的供應,並緩解了運費的下行壓力。
液體散貨運輸是成長的強勁引擎,預計到2031年將維持4.02%的複合年成長率,這主要得益於液化天然氣(LNG)液化規模的擴大和化學品貿易的多元化。預計到2025年,超大型液體散裝貨船(VLCC)的現貨收入將達到每日51,600美元,這將增加大型能源公司對定期租船的興趣。油輪船正轉向雙燃料運營,以確保綠色高價值貨物的運輸,而港口營運商則在投資建設低溫出口設施,以適應使用氨燃料的船舶。液體散貨的強勁成長勢頭為海運市場帶來了必要的多元化,並降低了其他貨物運輸的波動性。
區域分析
預計到2025年,亞太地區將佔海運市場佔有率的37.65%,並在2031年之前以5.02%的複合年成長率持續成長。這得歸功於該地區57%的區域內貿易依賴度,使其能夠實現多元化成長,擺脫對西方需求週期的依賴。上海的自動化規劃「藍圖18」(一個全自動化碼頭)正在降低每小時起重機運作次數的波動性,並為泊位效率樹立新的標竿。預計到2026年,中國平陸運河的年吞吐能力將達到8,900萬噸,屆時將消除內河運輸的瓶頸,並每年節省7.25億美元的成本。
在北美,由於關稅調整和自2025年10月起生效的301條款附加稅,中國製造船舶的成本不斷上漲,導致貨櫃吞吐量出現前所未有的1%的萎縮。然而,墨西哥貿易的復甦在一定程度上抵消了這一影響,近岸外包促進了墨西哥灣沿岸支線運輸服務的發展以及內陸鐵路的建設。在歐洲,遵守排放交易體系(ETS)每年將面臨100億歐元(110.3億美元)的成本,促使航運路線重新調整優先順序並重新評估燃料補給策略。同時,綠色走廊試點計畫正在將歐洲港口打造成為替代燃料補給的先行樞紐。
在中東,沙烏地阿拉伯45億美元的港口投資預計將使該地區物流收入在2026年達到388億美元。國際中東物流中心(IMEC)承諾透過整合鐵路和港口運營,將亞歐之間的運輸時間縮短40%,凸顯了該地區在多極貿易流量中的作用。南美洲正利用其中立地位,在供應鏈中斷的情況下,巴西對中國的黃豆出口仍在成長。隨著俄羅斯和奈及利亞之間的航運路線為金磚國家開闢農業走廊,非洲的佔有率也逐漸增加。
其他好處:
- Excel格式的市場預測(ME)表
- 3個月的分析師支持
目錄
第1章:引言
- 研究假設和市場定義
- 調查範圍
第2章:調查方法
第3章執行摘要
第4章 市場狀況
- 市場概覽
- 市場促進因素
- 亞洲內部南南貿易走廊的快速發展
- 近岸外包正在推動對沿海支線運輸的需求。
- 歐盟航運業排放交易體系(EU-ETS)正在重塑航運船隊的經濟格局。
- 此數位化貨運平台可實現運輸能力的即時匹配。
- 引入替代燃料將降低長期營運成本(OPEX)。
- 蘇伊士海峽繞行路線和巴拿馬運河擴建將增加噸英里運輸量。
- 市場限制因素
- 港口基礎設施長期存在瓶頸
- 2023-2026年貨櫃船累積訂單創歷史新高,有供應過剩風險。
- 海上網路安全威脅日益加劇
- 通貨膨脹導致燃油價格波動
- 價值供應鏈分析
- 監理情勢
- 技術展望
- 新冠疫情與地緣政治事件的影響
- 波特五力模型
第5章 市場規模與成長預測
- 按貨物類型
- 貨櫃貨物
- 乾燥
- 冷藏貨物
- 乾散貨
- 液體散貨
- 普通貨物
- 滾裝/滾卸貨物
- 貨櫃貨物
- 按最終用戶行業分類
- 電子和半導體
- 化工/石油化工
- 食品/飲料
- 藥品和醫療保健
- 零售與電子商務
- 其他
- 按地區
- 北美洲
- 美國
- 加拿大
- 墨西哥
- 南美洲
- 巴西
- 秘魯
- 智利
- 阿根廷
- 其他南美國家
- 亞太地區
- 印度
- 中國
- 日本
- 澳洲
- 韓國
- 東南亞(新加坡、馬來西亞、泰國、印尼、越南、菲律賓)
- 其他亞太國家
- 歐洲
- 英國
- 德國
- 法國
- 西班牙
- 義大利
- 比荷盧經濟聯盟(比利時、荷蘭、盧森堡)
- 北歐國家(丹麥、芬蘭、冰島、挪威、瑞典)
- 其他歐洲國家
- 中東和非洲
- 阿拉伯聯合大公國
- 沙烏地阿拉伯
- 南非
- 奈及利亞
- 其他中東和非洲國家
- 北美洲
第6章 競爭情勢
- 市場集中度
- 策略趨勢
- 市佔率分析
- 公司簡介
- Mediterranean Shipping Company(MSC)
- AP Moller-Maersk
- COSCO Shipping Lines
- Hapag-Lloyd
- Ocean Network Express(ONE)
- Evergreen Marine Corp.
- HMM Co., Ltd.
- Yang Ming Marine Transport
- ZIM Integrated Shipping
- Pacific International Lines(PIL)
- SITC International
- X-Press Feeders
- Matson Inc.
- Swire Shipping
- NYK Line
- K Line
- MOL Logistics
- CMA CGM
- Wan Hai Lines
- Emirates Shipping Line
第7章 市場機會與未來展望
According to Mordor Intelligence, the maritime freight transport market size was valued at USD 599.78 billion in 2025 and estimated to grow from USD 632.36 billion in 2026 to reach USD 823.57 billion by 2031, at a CAGR of 5.43% during the forecast period (2026-2031).
This report is Segmented by Cargo Type (Containerized Cargo, Dry Bulk Cargo, Liquid Bulk Cargo, General Cargo, Roll-On/Roll-Off Cargo), End-User Industry (Electronics & Semiconductors, Chemicals & Petrochemicals, Food & Beverage, and More), and Geography (North America, South America, Asia-Pacific, Europe, Middle East and Africa). The Market Forecasts are Provided in Terms of Value (USD).
Global Maritime Freight Transport Market Trends and Insights
Surge in South-South Intra-Asian Trade Corridors
ASEAN surpassed the European Union as China's top trading partner in 2023 at USD 468.8 billion, a 10.5% jump that cements intra-Asian cargo loops as the new growth engine. Progressive tariff eliminations under ACFTA streamline flows that bypass Western transshipment hubs, while China's 84-mile Pinglu Canal slated for 2026 will move 89 million tons annually and slice USD 725 million from supply-chain costs. Manufacturing migration toward Southeast Asia reinforces near-port industrial clusters, amplifying feeder demand to secondary gateways. The resulting cargo density underpins scale investments in 15,000 TEU workhorses optimized for shorter hauls yet higher turn-round frequencies. Collectively, these dynamics contribute an estimated 1.2 percentage-points to the Maritime freight transport market CAGR forecast period.
Near-shoring Drives Short-Sea Feeder Demand
U.S.-Mexico truck crossings hit record levels in 2024, validating near-shoring's spillover into Gulf and Caribbean feeder loops. Mainline carriers now skip smaller Gulf ports, contracting regional specialists for hub-and-spoke shuttles that compress door-to-door cycles by two to four days. X-Press Feeders' pact with six European ports to create green corridors exemplifies operators capturing rising short-sea volumes while satisfying Scope 3 emission objectives. Executives cite logistics cost reduction as the single largest incentive, with 41% prioritizing proximity over global scale. Elevated demand lifts vessel utilization and daily charter rates for 1,500-2,000 TEU ships, translating into a 0.8 percentage-point uptick in the Maritime freight transport market growth trajectory.
Chronic Port-Side Infrastructure Bottlenecks
Congestion peaked in 2025 as Singapore and Colombo absorbed Cape-routed vessels, causing yard utilization to exceed 90% and average berth wait times to triple. Shanghai processed a record 5 million TEU in January 2025 ahead of U.S. tariff enactments, stressing yard equipment even after adding 18 fully automated terminals. Los Angeles and Long Beach struggle with chassis shortages, while the Malacca Strait faces geopolitical disruptions and climate-driven draft limitations. Investment lags in gate automation and hinterland rail links hamper cargo velocity, subtracting 1.1 percentage-points from the Maritime freight transport market's long-run CAGR.
Other drivers and restraints analyzed in the detailed report include:
- EU-ETS on Maritime Emissions Reshapes Fleet Economics
- Digital Freight Platforms Enable Real-Time Capacity Matching
- Oversupply Risk from Record Container-Ship Orderbook 2023-26
For complete list of drivers and restraints, kindly check the Table Of Contents.
Segment Analysis
Dry bulk holds the lion's share, accounting for 28.65% of Maritime freight transport market size in 2025 on the back of China's 165 million-ton iron-ore and coal restocking drive. However, a 36 million dwt delivery slate scheduled for 2025 risks dampening TCE rates despite robust tonnage demand growth. Operators therefore pivot to index-linked charters to mitigate downside exposure. Overcapacity fears spur early scrapping of Handysize vessels, constraining supply in niche routes and moderating rate compression.
Liquid bulk is the standout growth engine, posting a 4.02% CAGR through 2031 as LNG liquefaction volumes scale and chemicals trades diversify. Spot VLCC earnings are forecast at USD 51,600 per day for 2025, stimulating time-charter interest among energy majors. Tanker owners install dual-fuel capability to capture green-premium cargoes, while port operators invest in cryogenic export arms to service ammonia-ready tonnage. The strengthening liquid bulk trajectory adds needed diversity to the Maritime freight transport market, cushioning volatility in other cargo streams.
Complete Report Scope:
- By Cargo Type
- Containerized Cargo
- Dry
- Reefer
- Dry Bulk Cargo
- Liquid Bulk Cargo
- General Cargo
- Roll-On/Roll-Off Cargo
- Containerized Cargo
- By End-User Industry
- Electronics & Semiconductors
- Chemicals & Petrochemicals
- Food & Beverage
- Pharmaceuticals & Healthcare
- Retail & E-commerce
- Others
- By Geography
- North America
- United States
- Canada
- Mexico
- South America
- Brazil
- Peru
- Chile
- Argentina
- Rest of South America
- Asia-Pacific
- India
- China
- Japan
- Australia
- South Korea
- South East Asia (Singapore, Malaysia, Thailand, Indonesia, Vietnam, and Philippines)
- Rest of Asia-Pacific
- Europe
- United Kingdom
- Germany
- France
- Spain
- Italy
- BENELUX (Belgium, Netherlands, and Luxembourg)
- NORDICS (Denmark, Finland, Iceland, Norway, and Sweden)
- Rest of Europe
- Middle East and Africa
- United Arab of Emirates
- Saudi Arabia
- South Africa
- Nigeria
- Rest of Middle East And Africa
- North America
Geography Analysis
Asia-Pacific commands 37.65% of Maritime freight transport market share in 2025 and is set to expand at a 5.02% CAGR to 2031, buoyed by 57% intra-regional trade dependence that diversifies growth away from Western demand cycles. Shanghai's automation blueprint-18 fully unmanned terminals-cuts crane moves per hour variance and sets new benchmarks for berth productivity. China's Pinglu Canal, capable of handling 89 million tons a year by 2026, will reduce inland transit bottlenecks and save USD 725 million annually.
North America confronts a rare 1% contraction in container throughput as tariff realignments and Section 301 levies raise costs on Chinese-built vessels beginning October 2025. Yet Mexico's trade renaissance offers partial offset, with near-shoring catalyzing Gulf feeder services and inland rail upgrades. Europe faces EUR 10 billion (USD 11.03 billion) annual ETS compliance costs that reprioritize corridor routing and bunker strategies. Simultaneously, green-corridor pilots position European ports as early-adoption nodes for alternative-fuel bunkering.
The Middle East leverages USD 4.5 billion in Saudi port investments to lift regional logistics revenue to USD 38.8 billion by 2026. IMEC promises to shorten Asia-Europe transit times by 40% via integrated rail-port linkages, underscoring the region's role in multipolar trade flows. South America capitalizes on its neutral stance; Brazilian soybean exports to China expand under disrupted supply chains. Africa's share gradually rises as Russia-Nigeria services unlock agricultural corridors for BRICS members.
- Mediterranean Shipping Company (MSC)
- A.P. Moller-Maersk
- COSCO Shipping Lines
- Hapag-Lloyd
- Ocean Network Express (ONE)
- Evergreen Marine Corp.
- HMM Co., Ltd.
- Yang Ming Marine Transport
- ZIM Integrated Shipping
- Pacific International Lines (PIL)
- SITC International
- X-Press Feeders
- Matson Inc.
- Swire Shipping
- NYK Line
- K Line
- MOL Logistics
- CMA CGM
- Wan Hai Lines
- Emirates Shipping Line
Additional Benefits:
- The market estimate (ME) sheet in Excel format
- 3 months of analyst support
TABLE OF CONTENTS
1 Introduction
- 1.1 Study Assumptions & Market Definition
- 1.2 Scope of the Study
2 Research Methodology
3 Executive Summary
4 Market Landscape
- 4.1 Market Overview
- 4.2 Market Drivers
- 4.2.1 Surge in South-South intra-Asian trade corridors
- 4.2.2 Near-shoring drives short-sea feeder demand
- 4.2.3 EU-ETS on maritime emissions reshapes fleet economics
- 4.2.4 Digital freight platforms enable real-time capacity matching
- 4.2.5 Alternative fuels adoption lowers long-term OPEX
- 4.2.6 Suez diversions & Panama expansion boost ton-miles
- 4.3 Market Restraints
- 4.3.1 Chronic port-side infrastructure bottlenecks
- 4.3.2 Oversupply risk from record container-ship orderbook 2023-26
- 4.3.3 Escalating maritime cyber-security threats
- 4.3.4 Inflation-driven bunker price volatility
- 4.4 Value / Supply-Chain Analysis
- 4.5 Regulatory Landscape
- 4.6 Technological Outlook
- 4.7 Impact of COVID-19 and Geo-Political Events
- 4.8 Porters Five Forces
- 4.8.1 Bargaining Power of Buyers
- 4.8.2 Bargaining Power of Suppliers
- 4.8.3 Threat of New Entrants
- 4.8.4 Threat of Substitutes
- 4.8.5 Competitive Rivalry
5 Market Size & Growth Forecasts (Value)
- 5.1 By Cargo Type
- 5.1.1 Containerized Cargo
- 5.1.1.1 Dry
- 5.1.1.2 Reefer
- 5.1.2 Dry Bulk Cargo
- 5.1.3 Liquid Bulk Cargo
- 5.1.4 General Cargo
- 5.1.5 Roll-On/Roll-Off Cargo
- 5.1.1 Containerized Cargo
- 5.2 By End-User Industry
- 5.2.1 Electronics & Semiconductors
- 5.2.2 Chemicals & Petrochemicals
- 5.2.3 Food & Beverage
- 5.2.4 Pharmaceuticals & Healthcare
- 5.2.5 Retail & E-commerce
- 5.2.6 Others
- 5.3 By Geography
- 5.3.1 North America
- 5.3.1.1 United States
- 5.3.1.2 Canada
- 5.3.1.3 Mexico
- 5.3.2 South America
- 5.3.2.1 Brazil
- 5.3.2.2 Peru
- 5.3.2.3 Chile
- 5.3.2.4 Argentina
- 5.3.2.5 Rest of South America
- 5.3.3 Asia-Pacific
- 5.3.3.1 India
- 5.3.3.2 China
- 5.3.3.3 Japan
- 5.3.3.4 Australia
- 5.3.3.5 South Korea
- 5.3.3.6 South East Asia (Singapore, Malaysia, Thailand, Indonesia, Vietnam, and Philippines)
- 5.3.3.7 Rest of Asia-Pacific
- 5.3.4 Europe
- 5.3.4.1 United Kingdom
- 5.3.4.2 Germany
- 5.3.4.3 France
- 5.3.4.4 Spain
- 5.3.4.5 Italy
- 5.3.4.6 BENELUX (Belgium, Netherlands, and Luxembourg)
- 5.3.4.7 NORDICS (Denmark, Finland, Iceland, Norway, and Sweden)
- 5.3.4.8 Rest of Europe
- 5.3.5 Middle East and Africa
- 5.3.5.1 United Arab of Emirates
- 5.3.5.2 Saudi Arabia
- 5.3.5.3 South Africa
- 5.3.5.4 Nigeria
- 5.3.5.5 Rest of Middle East And Africa
- 5.3.1 North America
6 Competitive Landscape
- 6.1 Market Concentration
- 6.2 Strategic Moves
- 6.3 Market Share Analysis
- 6.4 Company Profiles (includes Global level Overview, Market level overview, Core Segments, Financials as available, Strategic Information, Market Rank/Share for key companies, Products & Services, and Recent Developments)
- 6.4.1 Mediterranean Shipping Company (MSC)
- 6.4.2 A.P. Moller-Maersk
- 6.4.3 COSCO Shipping Lines
- 6.4.4 Hapag-Lloyd
- 6.4.5 Ocean Network Express (ONE)
- 6.4.6 Evergreen Marine Corp.
- 6.4.7 HMM Co., Ltd.
- 6.4.8 Yang Ming Marine Transport
- 6.4.9 ZIM Integrated Shipping
- 6.4.10 Pacific International Lines (PIL)
- 6.4.11 SITC International
- 6.4.12 X-Press Feeders
- 6.4.13 Matson Inc.
- 6.4.14 Swire Shipping
- 6.4.15 NYK Line
- 6.4.16 K Line
- 6.4.17 MOL Logistics
- 6.4.18 CMA CGM
- 6.4.19 Wan Hai Lines
- 6.4.20 Emirates Shipping Line
7 Market Opportunities & Future Outlook
- 7.1 White-space & Unmet-Need Assessment

 中國海運:市場佔有率分析、產業趨勢與統計及成長預測(2026-2031年)
 生鮮產品海運市場規模、佔有率及成長分析:依運輸方式、貨物類型、溫區、貨櫃尺寸、服務類型、最終用戶及地區分類-2026-2033年產業預測新加坡海運:市場佔有率分析、行業趨勢和統計數據以及成長預測(2026-2031 年)中國海運貨運代理:市場佔有率分析、產業趨勢與統計及成長預測(2026-2031年)美國海運貨運代理:市場佔有率分析、產業趨勢與統計及成長預測(2026-2031)
 貨運代理市場規模:按類型、服務、產業和地區分類(2026-2034 年)
 2026年全球海運市場報告2026年全球生鮮產品海運市場報告海運貨運代理:市場佔有率分析、產業趨勢與統計、成長預測(2026-2031)
 海運市場規模、佔有率及成長分析(依貨物類型、船舶類型、最終用途及地區分類)-2026-2033年產業預測