


 |
市場調查報告書
商品編碼
1937352
海運貨運代理:市場佔有率分析、產業趨勢與統計、成長預測(2026-2031)Sea Freight Forwarding - Market Share Analysis, Industry Trends & Statistics, Growth Forecasts (2026 - 2031) |
||||||
※ 本網頁內容可能與最新版本有所差異。詳細情況請與我們聯繫。
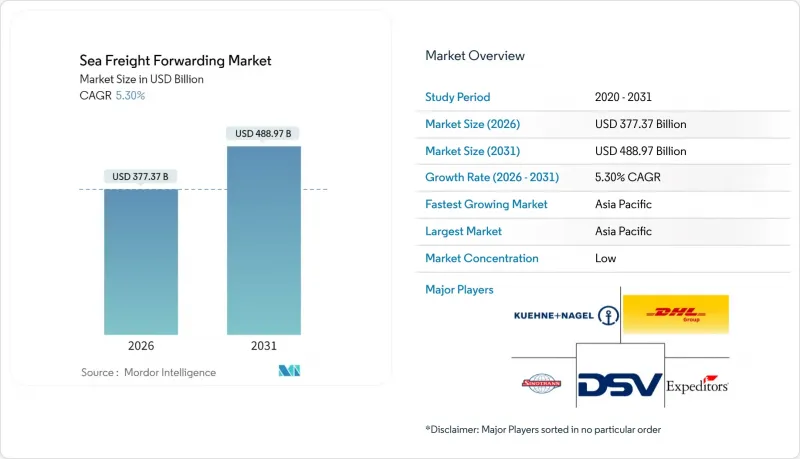
2025年,海運貨運代理市場價值為3,583.1億美元,預計到2031年將達到4,889.7億美元,而2026年為3,773.7億美元。
預計在預測期(2026-2031 年)內,複合年成長率將達到 5.30%。
強勁的貨櫃航運公司收入、向數位化訂艙標準的轉變以及全球庫存策略從準時制轉向以防萬一,都支撐了這一前景。不斷壯大的商船隊、新的港口投資以及電子商務推動的貨物分散化,為能夠保證艙位、速度和可視性的服務供應商創造了更多機會。控制80%貨櫃航運能力的聯盟已宣布2025年生效的新營運結構,進一步加強班次協調和艙位利用率。然而,2024年將有478艘新貨櫃船投入運營,超過了市場需求,給即期運價帶來壓力,並賦予托運人更大的議價優勢。
全球海運貨運代理市場趨勢與洞察
2025年至2030年間貨櫃港吞吐能力快速成長
預計到2024年,中國八大港口的貨櫃吞吐量將達到2.24億標準箱,比去年增加7%。其中,上海港的吞吐量將超過5000萬標準箱,鞏固其作為世界第一大貨櫃港口的地位。美國主要樞紐港口的吞吐量也不斷刷新紀錄,洛杉磯港的吞吐量達到1030萬標準箱,並投資建造零排放堆場設備。南沙港、長開港和大士港的新大型企劃有望重塑航運格局,並加劇貨運代理商之間的貨運量競爭。同時,船隊規模的擴張(僅2024年就將交付478艘船舶)將為托運人提供更多選擇,並使貨運代理商在運費談判中採取更積極的立場。
跨境履約網路快速擴張
預計到2027年,全球零售電商銷售額將達到8兆美元,將推動小包裹級海運貨運量激增。沃爾瑪的「港到門」服務已為電商經銷商處理了1988個標準箱(TEU),這充分證明了大型零售商自行整合物流的必要性。具備應用程式介面(API)的貨運代理可以將來自不同賣家的訂單整合到一個統一的拼箱(LCL)解決方案中,從而減少貨物滯留時間和清關阻力。
由於國際海事組織 (IMO) 2023 年硫排放法規規定的燃油附加費,貨運價格將會波動。
2024年,超低硫燃料油(VLSF)的平均價格為每噸608美元。自2025年起,經歐洲水域的航線將排放權交易體系(ETS)附加稅而增加每噸170至210美元的費用。亞洲至美國西岸(USWC)航線的燃油調整係數(BAF)已躍升至每標準箱(FEU)623美元,佔總運費的37%。貨運代理需要對沖或轉嫁這部分附加費,這在競爭激烈的競標週期中構成了一種微妙的平衡。
細分市場分析
到2025年,整箱貨運(FCL)將佔海運貨運代理市場的60.35%,繼續保持其作為製造商主要運輸方式的地位,這些製造商因疫情瓶頸而提前囤積庫存。預計FCL海運貨運代理市場規模將因港口擴容計劃和聯盟網路重組而擴大。同時,拼箱貨運(LCL)雖然規模較小,但由於電經銷商依賴拼箱來維持庫存,其複合年成長率(CAGR)也達到了4.63%。隨著API連接的訂艙平台簡化貨物拼箱和海關預清關流程,拼箱貨運的海運貨運代理市場佔有率將逐步提升。
數位化報價工具可在數秒內提供最佳的整箱 (FCL) 與拼箱 (LCL) 決策,引導中型托運人選擇每次航程最具成本效益的運輸方式。提供 48 小時裝箱保證和電子托運人帳單的貨運代理商正日益受到直接面對消費者的 B2C 平台的青睞。隨著現貨指數波動持續,包含燃油價格波動條款和碳排放強度調整的整箱合約機制將影響 2025 年競標的運費上限,進一步擴大大型業者和小規模仲介之間的定價能力差距。
區域分析
預計到2025年,亞太地區將佔全球收入的40.55%,並在2031年之前保持5.02%的區域複合年成長率,這主要得益於中國出口、東南亞的近岸採購以及活躍的區域內貿易。上海港創紀錄的5000萬標準箱吞吐量以及華南南沙港的擴建,為貨運代理商提供了充足的運輸能力。
受耐用消費品庫存補充的推動,預計到2024年,北美主要港口的進口總量將增加13%,達到2,820萬標準箱。與美國和墨西哥之間的近岸外包走廊相關的海運貨運代理市場規模正呈擴張趨勢,尤其是在汽車、電子和電池供應鏈領域。
在歐洲,蘇伊士運河繞行導致亞洲航線延誤10至14天,儘管免收通行費,但貨運量仍比尖峰時段下降了57%。歐盟排放交易體系(EU-ETS)和歐盟燃油海運法規強制要求的碳足跡審核,正逐漸成為一項服務差異化優勢。
中東和非洲地區正受益於沿岸地區的大型計劃和非洲之角走廊的改善,散貨和計劃貨物貨運代理預測,風力發電機和煉油廠模組將主導出口包機業務。
南美洲正利用其中立地位吸引多元化貿易。巴拿馬運河在2025年1月至5月期間的船舶通行量達到創紀錄的1,200艘,鞏固了其作為國際門戶的地位。
其他福利:
- Excel格式的市場預測(ME)表
- 分析師支持(3個月)
目錄
第1章 引言
- 研究假設和市場定義
- 調查範圍
第2章調查方法
第3章執行摘要
第4章 市場情勢
- 市場概覽
- 市場促進因素
- 2025年至2030年間貨櫃港吞吐能力快速成長
- 跨境履約網路快速擴張
- 適用於許多航空公司的數位預訂平台和API連接
- 擴大電池級原料的近岸外包
- 脫碳政策正在推動對端到端二氧化碳審核物流的需求。
- 透過在全球範圍內推廣海運保險參數產品來降低貨物風險
- 市場限制
- 國際海事組織 (IMO) 2023 年燃油硫含量上限規定導致運費波動。
- 航運公司的垂直整合給獨立貨運代理商的利潤率帶來了壓力。
- 傳統交通管理系統 (TMS) 的網路安全風險
- 運河航線的地緣政治動盪(蘇伊士運河和巴拿馬運河的限制草案)
- 價值/供應鏈分析
- 監管環境
- 技術展望
- 對地緣政治因素及疫情影響的回顧
- 票價及附加費趨勢分析
- 波特五力模型
- 供應商的議價能力
- 買方的議價能力
- 新進入者的威脅
- 替代品的威脅
- 競爭對手之間的競爭
第5章 市場規模及成長預測(價值,十億美元)
- 按服務類型
- FCL
- LCL
- 按貨物類型
- 乾燥
- 冷藏
- 按最終用戶行業分類
- 電子和半導體
- 化學品和石油化工
- 食品/飲料
- 製藥和醫療保健
- 零售與電子商務
- 其他
- 按地區
- 北美洲
- 美國
- 加拿大
- 墨西哥
- 南美洲
- 巴西
- 秘魯
- 智利
- 阿根廷
- 其他南美洲
- 亞太地區
- 印度
- 中國
- 日本
- 澳洲
- 韓國
- 東南亞(新加坡、馬來西亞、泰國、印尼、越南、菲律賓)
- 亞太其他地區
- 歐洲
- 英國
- 德國
- 法國
- 西班牙
- 義大利
- 比荷盧經濟聯盟(比利時、荷蘭、盧森堡)
- 北歐國家(丹麥、芬蘭、冰島、挪威、瑞典)
- 其他歐洲地區
- 中東和非洲
- 阿拉伯聯合大公國
- 沙烏地阿拉伯
- 南非
- 奈及利亞
- 其他中東和非洲地區
- 北美洲
第6章 競爭情勢
- 市場集中度
- 策略趨勢
- 市佔率分析
- 公司簡介
- Kuehne+Nagel
- DHL Global Forwarding
- Sinotrans
- DSV A/S
- Expeditors International
- CH Robinson Worldwide
- CEVA Logistics
- Kerry Logistics
- Nippon Express
- Hellmann Worldwide Logistics
- Geodis
- Yusen Logistics
- Rhenus Logistics
- UPS Supply Chain Solutions
- Savino Del Bene
- Kintetsu World Express
- LX Pantos
- Ningbo Port Southeast Logistics Group
- Worldwide Logistics Group
- CTS International Logistics
第7章 市場機會與未來展望
The Sea Freight Forwarding Market was valued at USD 358.31 billion in 2025 and estimated to grow from USD 377.37 billion in 2026 to reach USD 488.97 billion by 2031, at a CAGR of 5.30% during the forecast period (2026-2031).
Robust earnings at container lines, the march toward digital booking standards, and a global pivot from just-in-time to just-in-case inventory strategies underpin this outlook. Merchant-fleet capacity additions, fresh port investments, and e-commerce-linked shipment fragmentation are widening the opportunity set for service providers that can guarantee space, speed, and visibility. Alliances controlling 80% of container capacity have announced new operating structures that take effect in 2025, further tightening schedule coordination and slot utilization. Yet the arrival of 478 new boxships in 2024 outpaced demand, pressuring spot rates and handing shippers negotiating leverage.
Global Sea Freight Forwarding Market Trends and Insights
Surge in container-port capacity additions 2025-2030
China's top eight gateways lifted 224 million TEU in 2024, up 7%, while Shanghai crossed 50 million TEU, cementing its rank as the world's busiest container port. Major U.S. hubs also broke throughput records; the Port of Los Angeles hit 10.3 million units and is investing in zero-emission yard gear. New megaprojects at Nansha, Chancay, and Tuas promise to reset sailing patterns, intensifying competition among freight forwarders for volume commitments. Parallel fleet growth-478 deliveries in 2024 alone hands shippers more slot choice, enabling forwarders to bargain harder for rates.
Rapid scaling of cross-border e-commerce fulfillment networks
Global retail e-commerce sales are tracking toward USD 8 trillion by 2027, producing a wave of parcel-sized ocean consignments. Walmart's "port-to-door" service has already cleared 1,988 TEU for marketplace sellers, exemplifying how major retailers are internalizing logistics. Forwarders embracing application-program-interface connectivity can batch disparate seller orders into cohesive Less-than-Container-Load solutions, trimming dwell time and customs friction.
Freight-rate volatility linked to IMO 2023 fuel-sulfur cap surcharges
Very-Low-Sulfur Fuel Oil averaged USD 608 per ton in 2024; ETS levies will add USD 170-210 per ton for voyages touching European waters from 2025. Bunker Adjustment Factors jumped to USD 623 per FEU on Asia-USWC contracts, consuming 37% of all-in rates. Forwarders must hedge or pass through surcharges, a delicate balancing act in competitive bid cycles.
Other drivers and restraints analyzed in the detailed report include:
- Widespread carrier digital booking platforms and API connectivity
- Growing near-shoring of battery-grade raw materials
- Ocean-carrier vertical integration squeezing independent forwarder margins
For complete list of drivers and restraints, kindly check the Table Of Contents.
Segment Analysis
Full-Container-Load shipments secured 60.35% of the sea freight forwarding market in 2025, upholding their status as the workhorse for manufacturers that frontloaded inventory during pandemic bottlenecks. The sea freight forwarding market size for FCL is forecast to climb alongside port-capacity projects and alliance network revamps. Conversely, Less-than-Container-Load, though smaller, benefits from a 4.63% CAGR as e-commerce sellers lean on LCL consolidations to maintain SKU availability. The sea freight forwarding market share of LCL will inch higher as API-linked booking platforms simplify cargo co-loading and customs pre-clearance steps.
Digital quoting tools now surface optimal FCL vs. LCL decisions in seconds, nudging mid-volume shippers toward the most cost-efficient mode per sailing. Consolidators that guarantee 48-hour container stuffing windows and electronic House Bills are attracting B2C platforms that ship direct to consumer. As volatility lingers in spot indexes, FCL contract mechanisms featuring bunker float clauses and carbon-intensity adjustments will shape rate ceilings for 2025 tenders, reinforcing the pricing sophistication gap between scale players and smaller brokers.
The Sea Freight Forwarding Market Report is Segmented by Service Type (Full-Container-Load, Less-Than-Container-Load), Cargo Type (Dry, Reefer), End-User Industry (Electronics & Semiconductors, Chemicals & Petrochemicals, Food & Beverage, Pharmaceuticals & Healthcare, and More), and Geography (North America, South America, Asia-Pacific, Europe, Middle East and Africa). The Market Forecasts are Provided in Terms of Value (USD).
Geography Analysis
Asia-Pacific generated 40.55% of 2025 revenue and posts a regional 5.02% CAGR to 2031, buoyed by Chinese exports, Southeast-Asian near-sourcing, and intense intra-Asian trade. Shanghai's record 50 million TEU milestone and South-China's Nansha expansion give forwarders abundant sailings to fill.
North America saw combined import volumes at its top ports jump 13% to 28.2 million TEU in 2024, aided by restocking in consumer durables AJOT. The sea freight forwarding market size tied to U.S.-Mexico near-shoring corridors is swelling, especially for automotive, electronics, and battery supply chains.
Europe wrestles with Suez detours that add 10-14 days to Asia rotations; traffic is still 57% below peak despite toll breaks. Carbon-footprint auditing, mandated by the EU-ETS and FuelEU Maritime rules, emerges as a service differentiator.
Middle East & Africa benefits from giga-projects across the Gulf and Horn of Africa corridor upgrades. Breakbulk and project forwarders anticipate wind-turbine and refinery modules to dominate outbound charters.
South America leverages its neutrality to court diversification trade; Panama Canal set a 1,200-transit record in the January-May 2025 window, cementing its gateway role.
- Kuehne + Nagel
- DHL Global Forwarding
- Sinotrans
- DSV A/S
- Expeditors International
- C.H. Robinson Worldwide
- CEVA Logistics
- Kerry Logistics
- Nippon Express
- Hellmann Worldwide Logistics
- Geodis
- Yusen Logistics
- Rhenus Logistics
- UPS Supply Chain Solutions
- Savino Del Bene
- Kintetsu World Express
- LX Pantos
- Ningbo Port Southeast Logistics Group
- Worldwide Logistics Group
- CTS International Logistics
Additional Benefits:
- The market estimate (ME) sheet in Excel format
- 3 months of analyst support
TABLE OF CONTENTS
1 Introduction
- 1.1 Study Assumptions and Market Definition
- 1.2 Scope of the Study
2 Research Methodology
3 Executive Summary
4 Market Landscape
- 4.1 Market Overview
- 4.2 Market Drivers
- 4.2.1 Surge in container-port capacity additions 2025-2030
- 4.2.2 Rapid scaling of cross-border e-commerce fulfilment networks
- 4.2.3 Widespread carrier digital booking platforms and API connectivity
- 4.2.4 Growing near-shoring of battery-grade raw-materials
- 4.2.5 Decarbonisation mandates driving demand for end-to-end CO2-audited logistics
- 4.2.6 Global roll-out of maritime-insurance parametric products lowering cargo risk
- 4.3 Market Restraints
- 4.3.1 Freight-rate volatility linked to IMO 2023 fuel-sulphur cap surcharges
- 4.3.2 Ocean-carrier vertical integration squeezing independent forwarder margins
- 4.3.3 Cyber-security exposure of legacy transport-management systems (TMS)
- 4.3.4 Canal-route geopolitical disruptions (Suez, Panama draught limits)
- 4.4 Value / Supply-Chain Analysis
- 4.5 Regulatory Landscape
- 4.6 Technological Outlook
- 4.7 Geopolitical and Pandemic Impact Review
- 4.8 Freight-Rate and Surcharges Trend Analysis
- 4.9 Porter's Five Forces
- 4.9.1 Bargaining Power of Suppliers
- 4.9.2 Bargaining Power of Buyers
- 4.9.3 Threat of New Entrants
- 4.9.4 Threat of Substitutes
- 4.9.5 Competitive Rivalry
5 Market Size and Growth Forecasts (Value, USD Bn)
- 5.1 By Service Type
- 5.1.1 Full-Container-Load (FCL)
- 5.1.2 Less-than-Container-Load (LCL)
- 5.2 By Cargo Type
- 5.2.1 Dry
- 5.2.2 Reefer
- 5.3 By End-User Industry
- 5.3.1 Electronics and Semiconductors
- 5.3.2 Chemicals and Petrochemicals
- 5.3.3 Food and Beverage
- 5.3.4 Pharmaceuticals and Healthcare
- 5.3.5 Retail and E-commerce
- 5.3.6 Others
- 5.4 By Geography
- 5.4.1 North America
- 5.4.1.1 United States
- 5.4.1.2 Canada
- 5.4.1.3 Mexico
- 5.4.2 South America
- 5.4.2.1 Brazil
- 5.4.2.2 Peru
- 5.4.2.3 Chile
- 5.4.2.4 Argentina
- 5.4.2.5 Rest of South America
- 5.4.3 Asia-Pacific
- 5.4.3.1 India
- 5.4.3.2 China
- 5.4.3.3 Japan
- 5.4.3.4 Australia
- 5.4.3.5 South Korea
- 5.4.3.6 South East Asia (Singapore, Malaysia, Thailand, Indonesia, Vietnam, and Philippines)
- 5.4.3.7 Rest of Asia-Pacific
- 5.4.4 Europe
- 5.4.4.1 United Kingdom
- 5.4.4.2 Germany
- 5.4.4.3 France
- 5.4.4.4 Spain
- 5.4.4.5 Italy
- 5.4.4.6 BENELUX (Belgium, Netherlands, and Luxembourg)
- 5.4.4.7 NORDICS (Denmark, Finland, Iceland, Norway, and Sweden)
- 5.4.4.8 Rest of Europe
- 5.4.5 Middle East and Africa
- 5.4.5.1 United Arab of Emirates
- 5.4.5.2 Saudi Arabia
- 5.4.5.3 South Africa
- 5.4.5.4 Nigeria
- 5.4.5.5 Rest of Middle East And Africa
- 5.4.1 North America
6 Competitive Landscape
- 6.1 Market Concentration
- 6.2 Strategic Moves
- 6.3 Market Share Analysis
- 6.4 Company Profiles (includes Global level Overview, Market level overview, Core Segments, Financials as available, Strategic Information, Market Rank/Share for key companies, Products and Services, and Recent Developments)
- 6.4.1 Kuehne + Nagel
- 6.4.2 DHL Global Forwarding
- 6.4.3 Sinotrans
- 6.4.4 DSV A/S
- 6.4.5 Expeditors International
- 6.4.6 C.H. Robinson Worldwide
- 6.4.7 CEVA Logistics
- 6.4.8 Kerry Logistics
- 6.4.9 Nippon Express
- 6.4.10 Hellmann Worldwide Logistics
- 6.4.11 Geodis
- 6.4.12 Yusen Logistics
- 6.4.13 Rhenus Logistics
- 6.4.14 UPS Supply Chain Solutions
- 6.4.15 Savino Del Bene
- 6.4.16 Kintetsu World Express
- 6.4.17 LX Pantos
- 6.4.18 Ningbo Port Southeast Logistics Group
- 6.4.19 Worldwide Logistics Group
- 6.4.20 CTS International Logistics
7 Market Opportunities and Future Outlook
- 7.1 White-space and Unmet-Need Assessment


