


 |
市場調查報告書
商品編碼
2065449
中國海運貨運代理:市場佔有率分析、產業趨勢與統計及成長預測(2026-2031年)China Sea Freight Forwarding - Market Share Analysis, Industry Trends & Statistics, Growth Forecasts (2026 - 2031) |
||||||

※ 本網頁內容可能與最新版本有所差異。詳細情況請與我們聯繫。
中國海運貨運代理市場規模預計將從 2025 年的 665.3 億美元擴大到 2026 年的 698.9 億美元,到 2031 年達到 884.1 億美元,2026 年至 2031 年的複合年成長率為 4.81%。
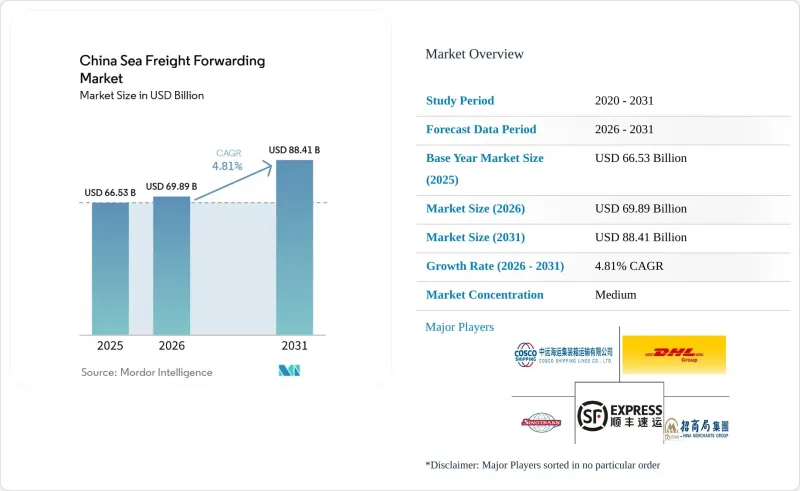
這一擴張反映了運輸體系從以沿海地區為中心的集散中心轉向以內陸多模態路線為主,透過「新國際陸海貿易走廊」連接西部省份的工廠和港口。本報告按服務類型(整箱貨運 (FCL)、拼箱貨運 (LCL))、貨物類型(乾貨/普通貨物、冷藏貨物)、終端用戶行業(電子及半導體、製造及工業、零售及電子商務、其他)和地區(北部、東北部、東部、中部、南部、西南部、西北)進行細分。市場預測以美元 (USD) 為單位。
中國海運貨運代理市場的趨勢與洞察
跨境電子商務出口量不斷成長
根據中國海關發布的報告,2025年跨境電商出口額預計將達到2.75兆元(約3,860億美元),較2020年成長69.7%。這一成長導致訂單量下降,促使貨運代理商從整箱貨運(FCL)轉向更頻繁的拼箱貨運(LCL),後者每標準箱(TEU)的利潤率更高。物流策略的這種轉變反映了電商供應鏈日益複雜化,而這又是由消費者對更快、更靈活的配送方式的需求所驅動的。此外,拼箱貨運量的成長也促使貨運代理商實施創新解決方案,以最佳化貨櫃利用率並減少營運低效環節。這些變化正在重塑物流行業的格局,要求相關人員適應不斷變化的市場動態和消費者期望。
作為永續性措施的一部分,阿里巴巴旗下的菜鳥網路不僅減少了16.9萬噸包裝,還計畫在2025年實現99%的配送車輛使用新能源車。此舉凸顯了一個更廣泛的趨勢:末端物流的永續性目標正在影響上游的貨櫃運輸。在杭州和深圳,保稅倉庫正在利用預清關服務來簡化營運。這項創新使得經銷商能夠在收到線上訂單的當天裝箱,從而將前置作業時間縮短兩到三天。此外,使用基於API的報關服務的貨運代理可以即時取得小包裹數據,從而減少貨物在倉庫的停留時間,並提高貨櫃的整體利用率。這些進展凸顯了跨境電商物流正在經歷一場由技術融合、營運效率提升和永續性措施共同驅動的變革。
東部和南部樞紐港口的自動化和吞吐能力擴張
預計2026年,上海小陽山自動化碼頭的吞吐能力將增加1,160萬個標準箱。同時,於2026年2月投入營運的廣州南沙港四期,其24小時峰值吞吐能力已達4.52萬標準箱。這些發展表明,中國致力於加強港口基礎設施建設,以應對日益成長的貿易量並提高營運效率。這些碼頭的擴建預計將在強化中國物流網路、保持其在全球貿易中的競爭力方面發揮關鍵作用。此外,這些發展也符合港口產業自動化發展的大趨勢,而自動化正被日益廣泛地應用於提升營運效率和降低成本。
同期,寧波舟山港吞吐量較去年同期成長19.8%,2026年1月及2月達到798.7萬標準箱。這項成長主要得益於潮州門航道疏浚工程的進展,使得20萬噸級船舶能夠不受潮汐影響通航。自動化已被證明可將每批貨物的人工成本降低高達40%,但其所需的大量資本投入更有利於擁有固定泊位的國有港口和大型貨運代理。相較之下,依賴非自動化碼頭的中小型貨運代理則面臨卡車排隊時間過長、短程運輸成本較高等營運挑戰。這些差異凸顯了自動化碼頭和非自動化碼頭在效率和成本效益方面日益擴大的差距,進一步強調了自動化在瞬息萬變的港口產業中的戰略重要性。
運費波動和船舶供應過剩
2026年4月,上海貨櫃運價指數(SCFI)跌至1875.26點。這主要是由於新船投入運營,新增運力約240萬個標準箱(TEU),佔全球航運運力的8%至10%。運力的增加對上海至洛杉磯的即期運價構成下行壓力,運價跌至每標準箱2,239美元。市場運力過剩給業內相關人員帶來了巨大挑戰,尤其是在運價下跌的情況下維持盈利。此外,由於航運公司難以有效管理過剩運力,人們越來越擔心運價的長期永續性。
受2024年合約約束的貨運代理商目前面臨著重新談判和適應不斷變化的市場動態的壓力。同時,依賴即期運價的貨運代理商由於運價波動,難以準確預測利潤率。此外,聯盟主導的取消訂單導致貨物積壓,進而增加了重新訂艙和倉儲費用,推高了成本。這些干擾凸顯了航運業在有效平衡供需方面持續面臨的挑戰。市場的不確定性進一步加劇了航運公司和貨運代理商的營運規劃難度,加重了產業的財務負擔。
細分市場分析
2025年,整箱貨運(FCL)服務將佔中國海運貨運市場的67.33%,而拼箱貨運(LCL)市場預計到2031年將以每年7.53%的速度成長。在深圳、上海和寧波營運保稅倉庫的拼箱貨運代理商的運轉率高達85-90%,利潤率比整箱貨運高出15-20%。隨著貨物匹配透過數位化平台自動化,沒有自有拼箱設施的貨運代理商正將部分收入拱手讓給軟體仲介業者。整箱貨運仍然是運輸電子產品和機械設備的重要方式,但由於船舶供應過剩,正面臨貨運壓力。上海至大阪航線上的日本通運品牌貨櫃表明,整箱貨運業者正透過貨櫃安全保障和一體化清關服務提供增值服務。
拼箱(LCL)業務佔有率的成長表明,中國海運貨代市場正在適應小批量出口的需求。菜鳥和順豐正在將國內快遞與海運拼箱業務相結合,從而將訂單到港口的運輸時間縮短2-3天。利用基於API的報關流程的貨代可以更快地完成拼箱貨物的清關,這一優勢加強了與無法裝滿貨櫃的中小經銷商的聯繫。整箱(FCL)營運商正在將業務重心轉向高價值倉儲和多模態,以應對商品化班輪運費的競爭。
其他好處:
- Excel格式的市場預測(ME)表
- 3個月的分析師支持
目錄
第1章:引言
- 研究假設和市場定義
- 調查範圍
第2章:調查方法
第3章執行摘要
第4章 市場狀況
- 市場概覽
- 市場促進因素
- 跨境電子商務出口量不斷成長
- 東部和南部樞紐區域港口的自動化和加工能力擴建
- 透過「一帶一路」計劃發展新的海上走廊。
- 引進數位化貨運平台和電子單據
- 中國高科技巨頭必須購買碳中和產品。
- 平陸運河的開通為廣西內陸工業打通了出海口。
- 市場限制因素
- 票價波動和過剩的航運能力
- 地緣政治貿易限制與關稅不確定性
- 尖峰時段期間冷藏設施重新佈置的不平衡
- 內陸貨運站人手不足導致短程運輸出現瓶頸。
- 法律規範
- 價值鍊和通路分析
- 技術創新的前景
- 波特五力模型
- 票價和附加費趨勢分析
- 地緣政治事件對供應鏈轉型的影響
第5章 市場規模與成長預測
- 按服務
- 整箱貨(FCL)
- 拼箱 (LCL)
- 貨物類型
- 乾貨/雜貨
- 冷藏貨櫃
- 按最終用戶行業分類
- 電子和半導體
- 化工/石油化工
- 食品/飲料
- 藥品和醫療保健
- 零售與電子商務
- 其他
- 按地區
- 北
- 東北
- 東方
- 中部
- 南
- 西南
- 西北
第6章 競爭情勢
- 市場集中度
- 關鍵策略趨勢
- 市佔率分析
- 公司簡介
- SINOTRANS Limited
- COSCO Shipping Logistics Co., Ltd.
- China Merchants Logistics Group Co., Ltd.
- DHL Group
- Kuehne+Nagel
- DSV A/S(Including DB Schenker)
- CMA CGM Group(Including CEVA Logistics)
- Nippon Express Holdings
- NYK Line(Including Yusen Logistics Global Management Co., Ltd)
- AP Moller-Maersk
- SF Holdings(KEX-SF)
- SITC International Holdings Co., Ltd.
- Toll Group
- Rhenus Logistics
- AIT Worldwide Logistics, Inc.
- SEKO Logistics
- CIMC Logistics(CIMC Shilianda)
- Huamao International Freight Forwarding Co., Ltd.
- CTS International Logistics Corporation
- Basenton Logistics Co., Ltd.
- Shenzhen King-Hor Supply Chain Co., Ltd
第7章 市場機會與未來展望
According to Mordor Intelligence, the china sea freight forwarding market size is expected to increase from USD 66.53 billion in 2025 to USD 69.89 billion in 2026 and reach USD 88.41 billion by 2031, growing at a CAGR of 4.81% over 2026-2031.
The measured expansion reflects a shift from coast-centric consolidation to inland multimodal routing that links factories in western provinces to seaports through the New International Land-Sea Trade Corridor. This report is Segmented by Service (Full-Container-Load (FCL), Less-Than-Container-Load (LCL)), by Cargo Type (Dry/General, Reefer), by End User Industry (Electronics and Semiconductors, Manufacturing and Industrial, Retail and E-Commerce, and Others), and by Region (North, Northeast, East, Central, South, Southwest, Northwest). The Market Forecasts are Provided in Terms of Value (USD).
China Sea Freight Forwarding Market Trends and Insights
Rising Cross-Border E-Commerce Export Volumes
In 2025, China Customs reported cross-border e-commerce exports of RMB 2.75 trillion (USD 386 billion), a 69.7% increase from 2020. This surge has led to smaller order sizes, prompting forwarders to transition from full-container load workflows to more frequent LCL shipments, capitalizing on higher margins per TEU. The shift in logistics strategies reflects the growing complexity of e-commerce supply chains, driven by consumer demand for faster, more flexible delivery options. Additionally, the rise in LCL shipments has encouraged forwarders to adopt innovative solutions to optimize container utilization and reduce operational inefficiencies. These changes are reshaping the logistics landscape, requiring stakeholders to adapt to evolving market dynamics and consumer expectations.
In a nod to sustainability, Alibaba's Cainiao not only eliminated 169,000 tons of packaging but also achieved 99% coverage with new-energy vehicles for 2025 distributions. This move underscores a broader trend: last-mile sustainability goals are now influencing upstream container operations. In Hangzhou and Shenzhen, bonded warehouses are streamlining operations with pre-clearance services. This innovation enables sellers to load containers on the same day an online order is made, trimming lead times by 2-3 days. Furthermore, forwarders utilizing API-linked customs filing can capture parcel data in real-time, leading to reduced dwell times and enhanced overall container utilization. These advancements highlight the ongoing transformation of the cross-border e-commerce logistics landscape, driven by technological integration, operational efficiency, and sustainability initiatives.
Regional Port Automation and Capacity Expansion in East/South Hubs
In 2026, Shanghai's Xiaoyangshan automated terminal is set to boost its capacity by 11.6 million TEUs. Meanwhile, Guangzhou Nansha Phase IV, which commenced operations in February 2026, achieved a peak handling of 45,200 TEUs within a 24-hour span. These developments underscore China's commitment to enhancing its port infrastructure to accommodate growing trade volumes and improve operational efficiency. The expansion of these terminals is expected to play a pivotal role in strengthening China's logistics network and maintaining its competitive edge in global trade. Additionally, these advancements align with the broader trend of automation in the port sector, which is increasingly being adopted to streamline operations and reduce costs.
Over the same period, Ningbo-Zhoushan saw a 19.8% year-on-year increase, processing 7.987 million TEUs in January and February 2026. This growth followed the deepening of the Tiaozhoumen Channel, enabling 200,000-ton ships to transit at any tide, as highlighted by. Automation has proven to reduce labor per lift by up to 40%, but the high capital investment required favors state-owned ports and large forwarders with guaranteed berth windows. In contrast, smaller forwarders relying on non-automated terminals face operational challenges, including longer truck queues and higher drayage costs. These disparities highlight the growing divide in efficiency and cost-effectiveness between automated and non-automated terminals, further emphasizing the strategic importance of automation in the evolving port industry.
Freight-Rate Volatility and Vessel Overcapacity
The Shanghai Containerized Freight Index declined to 1,875.26 in April 2026, as the addition of newbuilds contributed approximately 2.4 million TEU, representing 8-10% of global capacity. This increase in capacity exerted downward pressure on Shanghai-Los Angeles spot rates, which fell to USD 2,239 per TEU. The oversupply in the market has created significant challenges for industry stakeholders, particularly in maintaining profitability amidst falling rates. The situation has also raised concerns about the long-term sustainability of freight rates, as carriers struggle to manage excess capacity effectively.
Forwarders bound by 2024 contracts are now renegotiating under pressure, seeking to adapt to the changing market dynamics. Meanwhile, those relying on spot rates face difficulties in accurately predicting margins due to the volatility. Additionally, alliance-driven blank sailings have left cargo stranded, leading to increased costs from rebooking and storage fees. These disruptions highlight the ongoing struggles within the shipping industry to balance supply and demand effectively. The market uncertainty has further complicated operational planning for both carriers and forwarders, adding to the industry's financial strain.
Other drivers and restraints analyzed in the detailed report include:
- Belt and Road Initiative Opening New Maritime Corridors
- Digital Freight Platforms and E-Documentation Adoption
- Geopolitical Trade Restrictions and Tariff Uncertainty
For complete list of drivers and restraints, kindly check the Table Of Contents.
Segment Analysis
Full-container-load services accounted for 67.33% of the China sea freight forwarding market size in 2025, yet the China sea freight forwarding market for LCL is projected to grow 7.53% annually to 2031. LCL consolidators operating bonded warehouses in Shenzhen, Shanghai, and Ningbo achieved 85-90% utilization, earning margins 15-20% above FCL rates. Digital platforms automate cargo matching, so forwarders without proprietary consolidation facilities cede revenue to software intermediaries. FCL remains essential for electronics and machinery but faces rate pressure from vessel overcapacity. Nippon Express-branded containers on the Shanghai-Osaka run show FCL players adding value with guaranteed equipment and integrated customs brokerage.
The LCL share rise indicates how the China sea freight forwarding market adapts to parcel-level exports. Cainiao and SF integrate domestic express with seaborne LCL, shrinking order-to-port times by 2-3 days. Forwarders leveraging API customs filing can clear mixed consignments faster, a feature that strengthens stickiness with small and midsize sellers that cannot fill a full box. FCL players pivot to value-added warehousing and multimodal bundles to counter commoditized liner rates.
List of Companies Covered in this Report:
- SINOTRANS Limited
- COSCO Shipping Logistics Co., Ltd.
- China Merchants Logistics Group Co., Ltd.
- DHL Group
- Kuehne+Nagel
- DSV A/S (Including DB Schenker)
- CMA CGM Group (Including CEVA Logistics)
- Nippon Express Holdings
- NYK Line (Including Yusen Logistics Global Management Co., Ltd)
- A.P. Moller-Maersk
- SF Holdings (KEX-SF)
- SITC International Holdings Co., Ltd.
- Toll Group
- Rhenus Logistics
- AIT Worldwide Logistics, Inc.
- SEKO Logistics
- CIMC Logistics (CIMC Shilianda)
- Huamao International Freight Forwarding Co., Ltd.
- CTS International Logistics Corporation
- Basenton Logistics Co., Ltd.
- Shenzhen King-Hor Supply Chain Co., Ltd
Additional Benefits:
- The market estimate (ME) sheet in Excel format
- 3 months of analyst support
TABLE OF CONTENTS
1 Introduction
- 1.1 Study Assumptions and Market Definition
- 1.2 Scope of the Study
2 Research Methodology
3 Executive Summary
4 Market Landscape
- 4.1 Market Overview
- 4.2 Market Drivers
- 4.2.1 Rising Cross-Border E-Commerce Export Volumes
- 4.2.2 Regional Port Automation and Capacity Expansion in East/South Hubs
- 4.2.3 Belt and Road Initiative Opening New Maritime Corridors
- 4.2.4 Digital Freight Platforms and E-Documentation Adoption
- 4.2.5 Carbon-Neutral Procurement Mandates from Chinese Tech Giants
- 4.2.6 Pinglu Canal Unlocking Sea Access for Inland Guangxi Industries
- 4.3 Market Restraints
- 4.3.1 Freight-Rate Volatility and Vessel Overcapacity
- 4.3.2 Geopolitical Trade Restrictions and Tariff Uncertainty
- 4.3.3 Reefer-Equipment Repositioning Imbalances During Harvest Peaks
- 4.3.4 Inland Depot Labor Shortages Causing Drayage Bottlenecks
- 4.4 Regulatory Framework
- 4.5 Value Chain and Distribution Channel Analysis
- 4.6 Technology Innovations Outlook
- 4.7 Porter's Five Forces
- 4.7.1 Threat of New Entrants
- 4.7.2 Bargaining Power of Suppliers
- 4.7.3 Bargaining Power of Buyers
- 4.7.4 Threat of Substitutes
- 4.7.5 Rivalry Among Competitors
- 4.8 Freight-Rate and Surcharges Trend Analysis
- 4.9 Impact of Geo-Political Events on Supply Chain Shifts
5 Market Size and Growth Forecasts
- 5.1 By Service
- 5.1.1 Full-Container-Load (FCL)
- 5.1.2 Less-than-Container-Load (LCL)
- 5.2 By Cargo Type
- 5.2.1 Dry/General
- 5.2.2 Reefer
- 5.3 By End User Industry
- 5.3.1 Electronics and Semiconductors
- 5.3.2 Chemicals and Petrochemicals
- 5.3.3 Food and Beverage
- 5.3.4 Pharmaceuticals and Healthcare
- 5.3.5 Retail and E-commerce
- 5.3.6 Others
- 5.4 By Region
- 5.4.1 North
- 5.4.2 Northeast
- 5.4.3 East
- 5.4.4 Central
- 5.4.5 South
- 5.4.6 Southwest
- 5.4.7 Northwest
6 Competitive Landscape
- 6.1 Market Concentration
- 6.2 Key Strategic Moves
- 6.3 Market Share Analysis
- 6.4 Company Profiles (includes Global level Overview, Market level overview, Core Segments, Financials as available, Strategic Information, Products and Services, and Recent Developments)
- 6.4.1 SINOTRANS Limited
- 6.4.2 COSCO Shipping Logistics Co., Ltd.
- 6.4.3 China Merchants Logistics Group Co., Ltd.
- 6.4.4 DHL Group
- 6.4.5 Kuehne+Nagel
- 6.4.6 DSV A/S (Including DB Schenker)
- 6.4.7 CMA CGM Group (Including CEVA Logistics)
- 6.4.8 Nippon Express Holdings
- 6.4.9 NYK Line (Including Yusen Logistics Global Management Co., Ltd)
- 6.4.10 A.P. Moller-Maersk
- 6.4.11 SF Holdings (KEX-SF)
- 6.4.12 SITC International Holdings Co., Ltd.
- 6.4.13 Toll Group
- 6.4.14 Rhenus Logistics
- 6.4.15 AIT Worldwide Logistics, Inc.
- 6.4.16 SEKO Logistics
- 6.4.17 CIMC Logistics (CIMC Shilianda)
- 6.4.18 Huamao International Freight Forwarding Co., Ltd.
- 6.4.19 CTS International Logistics Corporation
- 6.4.20 Basenton Logistics Co., Ltd.
- 6.4.21 Shenzhen King-Hor Supply Chain Co., Ltd
7 Market Opportunities and Future Outlook
- 7.1 White-space and Unmet-Need Assessment

 生鮮產品海運市場規模、佔有率及成長分析:依運輸方式、貨物類型、溫區、貨櫃尺寸、服務類型、最終用戶及地區分類-2026-2033年產業預測
 新加坡海運:市場佔有率分析、行業趨勢和統計數據以及成長預測(2026-2031 年)美國海運貨運代理:市場佔有率分析、產業趨勢與統計及成長預測(2026-2031)
 貨運代理市場規模:按類型、服務、產業和地區分類(2026-2034 年)
 2026年全球海運市場報告2026年全球生鮮產品海運市場報告海運貨運代理:市場佔有率分析、產業趨勢與統計、成長預測(2026-2031)海運:市場佔有率分析、產業趨勢與統計、成長預測(2026-2031)
 海運市場規模、佔有率及成長分析(依貨物類型、船舶類型、最終用途及地區分類)-2026-2033年產業預測
 全球海運市場