


 |
市場調查報告書
商品編碼
2072633
新加坡海運:市場佔有率分析、行業趨勢和統計數據以及成長預測(2026-2031 年)Singapore Sea Freight Transport - Market Share Analysis, Industry Trends & Statistics, Growth Forecasts (2026 - 2031) |
||||||

※ 本網頁內容可能與最新版本有所差異。詳細情況請與我們聯繫。
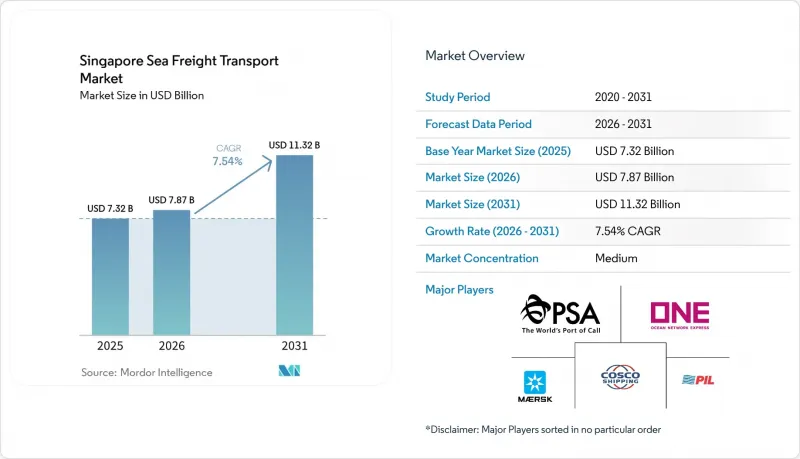
根據 Mordor Intelligence 估計,新加坡海運市場在 2026 年的價值將達到 78.7 億美元,高於 2025 年的 73.2 億美元,預計到 2031 年將達到 113.2 億美元。
預計從 2026 年到 2031 年,其複合年成長率將達到 7.54%。
本報告按貨物類型(貨櫃貨物、散裝貨等)、終端用戶產業(電子和半導體、化學和石化、食品和飲料等)、貿易路線(亞洲內部、北美等)以及區域/港口叢集(西部地區、中部地區等)對產業進行分類。市場預測以美元計價。
新加坡海運市場趨勢與洞察
大士港的整合將增加貨物吞吐量。
新加坡正透過整合傳統都市區碼頭至大士超級港(Tuas Megaport)的舉措,提升其競爭力。預計到2040年代,該港口的規劃吞吐能力將達到6500萬標準箱(TEU),幾乎是2021年3750萬標準箱吞吐能力的兩倍。在2022年啟用的第一階段,已部署了200多輛自動導引運輸車(AGV),並採用事件驅動的數位化骨幹系統即時協調堆場內的船舶作業。由於港口位於單一連續的海岸線上,港內轉運次數顯著減少,從而提高了起重機的運轉率和船舶週轉時間。因此,營運的可預測性增強,航運公司可以簡化同一航線上的兩次靠泊,從而將多餘的船舶停泊時間用於其他作業。由此帶來的直接結果是,航運公司透過縮短港口停留時間,實現了成本降低和溫室氣體排放減少,進一步鞏固了新加坡作為國際航運樞紐的地位。
製造地向東協轉移正在推動出口貨櫃數量成長。
電子產品、精密機械和耐用消費品生產設施從北亞向東協轉移,正推動經新加坡出口的新出口激增。聯華電子(UMC)投資50億美元的半導體晶圓廠以及其他類似投資,帶動了晶圓製造設備、化學品和成品晶片的生產,這些產品先透過支線航班運往海外,再轉運至海運航線。越南的工業擴張也遵循類似的模式,利用新加坡作為整合中心,並透過YCH集團和越南郵政正在建造的數位貿易走廊進行整合。供應商基地的擴張分散了地緣政治風險,並提高了網路密度。這表明,即使全球經濟週期放緩,東協地區的需求仍將繼續支撐港口泊位的使用率。
燃油價格波動劇烈,導致運費上漲。
受紅海繞道工程推動,上海至歐洲航線貨運量激增256%,到2024年底,多條長途貿易航線的貨櫃即期運費加倍以上。新加坡的生質燃料加註量在2023年成長了兩倍,在新加坡的船用燃料體系中樹立了新的價格標桿,並對航運公司的燃料成本產生了影響。雖然替代燃料有助於實現脫碳目標,但其供應鏈仍在發展中,導致燃油附加額外費用波動。因此,托運人優先選擇停留時間最短的港口,以確保船用燃料消耗的可預測性。新加坡效率的提高將緩解但無法消除這種波動。
細分市場分析
到2025年,貨櫃貨物將佔新加坡海運市場的60.35%,隨著冷藏貨櫃的普及,這一主導地位預計將持續到2031年。隨著疫苗和生物製藥對溫控貨櫃的需求日益成長,新加坡港務集團(PSA)正在擴大電力連接點和氣調監測系統,使貨櫃運輸成為生命科學出口商的策略驅動力。受生質燃料摻混和早期綠色氨計畫(需要裕廊島專用泊位)的推動,液體散貨預計將以7.75%的複合年成長率實現最高成長。由於區域建築需求,乾散貨貨運量正溫和成長,而普通貨物和滾裝船(RO-RO)貨運仍保持穩定的細分市場地位。自動化、數位雙胞胎和區塊鏈技術在這些領域的整合將提高可預測性,使碼頭營運商能夠針對每種貨物類別最佳化堆場調度。
其他好處:
- Excel格式的市場預測(ME)表
- 3個月的分析師支持
目錄
第1章:引言
- 研究假設和市場定義
- 調查範圍
第2章:調查方法
第3章執行摘要
第4章 市場狀況
- 市場概覽
- 市場促進因素
- 城市航站樓與大士港的整合提高了旅客吞吐量。
- 製造業向東協轉移正在推動新加坡的出口貨櫃數量成長。
- 透過優惠貿易協定(RCEP、CPTPP)降低海運成本
- 透過引入 DigitalPORT@SG 和電子載貨證券。
- 擴大藥品和生鮮食品的低溫運輸運輸能力。
- 綠色數位航運走廊舉措
- 市場限制因素
- 燃油價格波動導致綜合運費上漲。
- 來自巴生港和丹絨佩雷帕斯港的支線航班票價帶來了競爭壓力。
- 旺季期間40英尺高立方冷藏貨櫃短缺
- 裕廊島的首末段貨車運輸能力緊張。
- 價值供應鏈分析
- 監管和技術展望
- 波特五力模型
第5章 市場規模與成長預測
- 貨物類型
- 貨櫃貨物
- 乾燥
- 冷藏貨櫃
- 乾散貨
- 液體散貨
- 普通貨物
- 滾裝/滾卸貨物
- 貨櫃貨物
- 按最終用戶行業分類
- 電子和半導體
- 化工/石油化工
- 食品/飲料
- 藥品和醫療保健
- 零售與電子商務
- 其他
- 透過貿易路線
- 亞洲內部
- 北美洲
- 歐洲
- 中東
- 非洲
- 南美洲
- 大洋洲
- 按區域/按連接埠叢集
- 西部地區(大士和裕廊)
- 中部地區(巴西班讓和吉寶)
- 北部地區(三巴旺)
- 東部地區(樟宜和洛陽)
第6章 競爭情勢
- 市場集中度
- 策略趨勢
- 市佔率分析
- 公司簡介
- PSA International
- Ocean Network Express(ONE)
- Pacific International Lines(PIL)
- AP Moller-Maersk
- CMA CGM
- Evergreen Marine
- Hapag-Lloyd
- Cosco Shipping Lines
- Yang Ming
- X-Press Feeders
- DHL Group
- Kuehne+Nagel
- NYK Line(Yusen Logistics)
- DSV
- Sinotrans
- Toll Group
- OOCL
- Eastern Pacific Shipping
- ALPS Global Logistics Pte Ltd
- PAL Line Pte Ltd.*
第7章 市場機會與未來展望
According to Mordor Intelligence, singapore sea freight transport market size in 2026 is estimated at USD 7.87 billion, growing from 2025 value of USD 7.32 billion with 2031 projections showing USD 11.32 billion, growing at 7.54% CAGR over 2026-2031.
This report Segments the Industry Into by Cargo Type (Containerized Cargo, Dry Bulk Cargo and More), by End User Industry (Electronics and Semiconductors, Chemicals and Petrochemicals, Food and Beverage and More), by Trade Lane (Intra-Asia, North America and More) and by Region/Port Cluster(West Region, Central Region and More). The Market Forecasts are Provided in Terms of Value (USD).
Singapore Sea Freight Transport Market Trends and Insights
Tuas Mega-Port Consolidation Elevating Throughput
The consolidation of legacy city terminals into Tuas Mega-Port is transforming Singapore's competitiveness by pushing planned capacity toward 65 million TEUs in the 2040s-almost double the 37.5 million TEUs handled in 2021. Phase 1, opened in 2022, already deploys more than 200 Automated Guided Vehicles, while an event-driven digital backbone orchestrates yard moves in real time. Because the facility sits on a single contiguous coastline, internal trans-shifts fall sharply, improving crane utilisation and vessel turnaround. The resulting predictability lets carriers rationalise dual calls on the same loop, freeing vessel days for extra sailings. An immediate inference is that shipping lines gain both cost savings and greenhouse-gas reductions through shorter port dwell, tightening Singapore's hold on hub status.
ASEAN Manufacturing Shift Driving Export TEUs
Relocation of electronics, precision-engineering and consumer-durables production from North Asia into ASEAN is pumping new export volumes through Singapore. United Microelectronics Corp.'s USD 5 billion semiconductor fab and similar investments pull in wafer tools, chemicals and finished chips that ride outbound feeder services before transhipment onto deep-sea loops. Vietnam's industrial expansion follows an identical pattern, using Singapore as its load-centre gateway via digital trade corridors being built by YCH Group and Vietnam Post. The widened supplier footprint spreads geopolitical risk and deepens network density, indicating that intra-ASEAN demand will support berth utilisation even when global cycles soften.
Volatile Bunker Prices Translating into Higher Freight Rates
Container spot rates on several long-haul trades more than doubled through late 2024, propelled by a 256 % spike on the Shanghai-Europe route tied to Red Sea diversions. Biofuel bunkering volumes in Singapore tripled in 2023, creating a new pricing reference within the Singapore bunker fuel ecosystem and influencing carriers' fuel costs. Although alternative grades help with decarbonisation targets, their nascent supply chains inject volatility into index-linked fuel surcharges. Shippers therefore prioritise ports with minimal in-harbour delay so that bunker burn remains predictable; Singapore's efficiency gains cushion, but do not eliminate, that volatility.
Other drivers and restraints analyzed in the detailed report include:
- Preferential Trade Agreements Cutting Sea-Freight Costs
- DigitalPORT@SG & Electronic Bill-of-Lading Adoption
- Competitive Pressure from Port Klang and Tanjung Pelepas
For complete list of drivers and restraints, kindly check the Table Of Contents.
Segment Analysis
Containerised cargo commands a 60.35% Singapore Sea Freight market share in 2025, and its prominence is expected to persist through 2031 as reefer adoption widens. Higher uptake of temperature-controlled boxes for vaccines and biologics is pushing PSA to add plug points and controlled-atmosphere monitoring, making container operations a strategic enabler for life-science exporters. Liquid bulk shows the fastest forecast growth at 7.75% CAGR, propelled by biofuel blending and nascent green-ammonia projects that need dedicated berths on Jurong Island. Dry bulk volumes grow modestly on the back of regional construction demand, while general cargo and roll-on/roll-off remain stable niches. The interplay of automation, digital twins, and blockchain within these segments boosts predictability, allowing terminal operators to fine-tune yard staging for each commodity class.
Complete Report Scope:
- By Cargo Type
- Containerized Cargo
- Dry
- Reefer
- Dry Bulk Cargo
- Liquid Bulk Cargo
- General Cargo
- Roll-On/Roll-Off Cargo
- Containerized Cargo
- By End-User Industry
- Electronics & Semiconductors
- Chemicals & Petrochemicals
- Food & Beverage
- Pharmaceuticals & Healthcare
- Retail & E-commerce
- Others
- By Trade Lane
- Intra-Asia
- North America
- Europe
- Middle East
- Africa
- South America
- Oceania
- By Region / Port Cluster
- West Region (Tuas & Jurong)
- Central Region (Pasir Panjang & Keppel)
- North Region (Sembawang)
- East Region (Changi & Loyang)
List of Companies Covered in this Report:
- PSA International
- Ocean Network Express (ONE)
- Pacific International Lines (PIL)
- A.P. Moller-Maersk
- CMA CGM
- Evergreen Marine
- Hapag-Lloyd
- Cosco Shipping Lines
- Yang Ming
- X-Press Feeders
- DHL Group
- Kuehne + Nagel
- NYK Line (Yusen Logistics)
- DSV
- Sinotrans
- Toll Group
- OOCL
- Eastern Pacific Shipping
- ALPS Global Logistics Pte Ltd
- PAL Line Pte Ltd.*
Additional Benefits:
- The market estimate (ME) sheet in Excel format
- 3 months of analyst support
TABLE OF CONTENTS
1 Introduction
- 1.1 Study Assumptions & Market Definition
- 1.2 Scope of the Study
2 Research Methodology
3 Executive Summary
4 Market Landscape
- 4.1 Market Overview
- 4.2 Market Drivers
- 4.2.1 Consolidation of City Terminals into Tuas Mega-Port Elevating Throughput
- 4.2.2 ASEAN Manufacturing Shift Driving Export TEUs from Singapore
- 4.2.3 Preferential Trade Agreements (RCEP, CPTPP) Cutting Sea-Freight Costs
- 4.2.4 DigitalPORT@SG & Electronic Bill-of-Lading Adoption Shortening Dwell-Time
- 4.2.5 Expansion of Cold-Chain TEUs for Pharma & Perishables
- 4.2.6 Green & Digital Shipping-Corridor Initiatives
- 4.3 Market Restraints
- 4.3.1 Volatile Bunker Prices Translating into Higher All-in Freight Rates
- 4.3.2 Competitive Pressure from Port Klang & Tanjung Pelepas Feeder Rates
- 4.3.3 Shortage of 40-ft High-Cube Reefers During Peak Season
- 4.3.4 Tight Trucking Capacity for First/Last-Mile on Jurong Island
- 4.4 Value / Supply-Chain Analysis
- 4.5 Regulatory & Technological Outlook
- 4.6 Porter's Five Forces
- 4.6.1 Threat of New Entrants
- 4.6.2 Bargaining Power of Buyers
- 4.6.3 Bargaining Power of Suppliers
- 4.6.4 Threat of Substitutes
- 4.6.5 Intensity of Competitive Rivalry
5 Market Size & Growth Forecasts (Value, USD)
- 5.1 By Cargo Type
- 5.1.1 Containerized Cargo
- 5.1.1.1 Dry
- 5.1.1.2 Reefer
- 5.1.2 Dry Bulk Cargo
- 5.1.3 Liquid Bulk Cargo
- 5.1.4 General Cargo
- 5.1.5 Roll-On/Roll-Off Cargo
- 5.1.1 Containerized Cargo
- 5.2 By End-User Industry
- 5.2.1 Electronics & Semiconductors
- 5.2.2 Chemicals & Petrochemicals
- 5.2.3 Food & Beverage
- 5.2.4 Pharmaceuticals & Healthcare
- 5.2.5 Retail & E-commerce
- 5.2.6 Others
- 5.3 By Trade Lane
- 5.3.1 Intra-Asia
- 5.3.2 North America
- 5.3.3 Europe
- 5.3.4 Middle East
- 5.3.5 Africa
- 5.3.6 South America
- 5.3.7 Oceania
- 5.4 By Region / Port Cluster
- 5.4.1 West Region (Tuas & Jurong)
- 5.4.2 Central Region (Pasir Panjang & Keppel)
- 5.4.3 North Region (Sembawang)
- 5.4.4 East Region (Changi & Loyang)
6 Competitive Landscape
- 6.1 Market Concentration
- 6.2 Strategic Moves
- 6.3 Market Share Analysis
- 6.4 Company Profiles {(includes Global level Overview, Market level overview, Core Segments, Financials as available, Strategic Information, Market Rank/Share, Products & Services, Recent Developments)}
- 6.4.1 PSA International
- 6.4.2 Ocean Network Express (ONE)
- 6.4.3 Pacific International Lines (PIL)
- 6.4.4 A.P. Moller-Maersk
- 6.4.5 CMA CGM
- 6.4.6 Evergreen Marine
- 6.4.7 Hapag-Lloyd
- 6.4.8 Cosco Shipping Lines
- 6.4.9 Yang Ming
- 6.4.10 X-Press Feeders
- 6.4.11 DHL Group
- 6.4.12 Kuehne + Nagel
- 6.4.13 NYK Line (Yusen Logistics)
- 6.4.14 DSV
- 6.4.15 Sinotrans
- 6.4.16 Toll Group
- 6.4.17 OOCL
- 6.4.18 Eastern Pacific Shipping
- 6.4.19 ALPS Global Logistics Pte Ltd
- 6.4.20 PAL Line Pte Ltd.*
7 Market Opportunities & Future Outlook

 生鮮產品海運市場規模、佔有率及成長分析:依運輸方式、貨物類型、溫區、貨櫃尺寸、服務類型、最終用戶及地區分類-2026-2033年產業預測
 中國海運貨運代理:市場佔有率分析、產業趨勢與統計及成長預測(2026-2031年)美國海運貨運代理:市場佔有率分析、產業趨勢與統計及成長預測(2026-2031)
 貨運代理市場規模:按類型、服務、產業和地區分類(2026-2034 年)
 2026年全球海運市場報告2026年全球生鮮產品海運市場報告海運貨運代理:市場佔有率分析、產業趨勢與統計、成長預測(2026-2031)海運:市場佔有率分析、產業趨勢與統計、成長預測(2026-2031)
 海運市場規模、佔有率及成長分析(依貨物類型、船舶類型、最終用途及地區分類)-2026-2033年產業預測
 全球海運市場