


 |
市場調查報告書
商品編碼
2122940
金融科技:市場佔有率分析、產業趨勢與統計、成長預測(2025-2030)Fintech - Market Share Analysis, Industry Trends & Statistics, Growth Forecasts (2025 - 2030) |
||||||

※ 本網頁內容可能與最新版本有所差異。詳細情況請與我們聯繫。
據 Mordor Intelligence 稱,2025 年金融科技市場價值 2,783.1 億美元,預計到 2030 年將從 2025 年的 3,208.1 億美元成長至 6,528 億美元,預測期(2025-2030 年)複合年成長率為 15.27%。
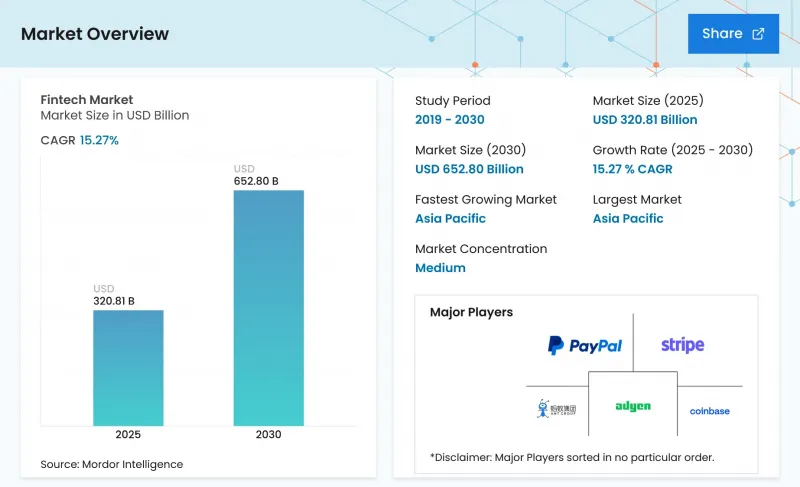
本報告按服務類型(數位支付、數位借貸和資金籌措、數位投資、保險科技、新銀行)、最終用戶(個人和企業)、用戶介面(行動應用程式、網頁/瀏覽器、POS/物聯網設備)以及地區(北美、南美、歐洲、亞太、中東和非洲)進行細分。市場預測以美元計價。
全球金融科技市場趨勢與洞察
即時支付的強制實施正在加速金融科技的普及。
美國的FedNow和歐洲的SEPA即時信用轉帳等中央銀行系統正大幅縮短結算時間,從數小時縮短至數秒。結算速度的提升正在為資金管理、小額貸款和現金流分析等領域帶來新的價值提案,並使金融科技市場能夠觸達先前依賴速度較慢的批量處理的企業客戶。預計到2025年,美國的即時交易量將達到74億筆,中國、英國和香港也呈現類似的成長動能。整合了請求支付、自動匹配和即時融資等疊加服務的供應商,正基於相同的結算基礎設施獲得穩定的收入來源。在監管機構設定了明確的過渡期限並更新了結算確認規則的地區,這些技術的普及速度最為迅猛。結算網路之間的互通性仍然是一個挑戰,但連接國內高速結算系統的試點計畫已經展示了可行的跨境模式。
透過開放銀行和API標準化擴大資料存取範圍。
歐洲的PSD2和巴西的開放金融計劃表明,統一的API規範能夠大規模地實現帳戶聚合、餘額確認和直接銀行支付。標準化的授權流程正在將競爭的焦點從資料累積轉移到資料利用,從而促進預測性信用評估和高度個人化預算工具的開發。監管機構目前正將開放金融定位為一項關鍵的數位基礎設施,這正在推動美洲和亞太部分地區的採用。將銀行數據與來自商家、電信業者或社群媒體的訊號結合的金融科技平台正在建構更複雜的風險模型,降低違約率,並擴大信貸覆蓋範圍。這一趨勢正在培育一個可互通的金融科技市場生態系統,在這個生態系統中,小規模的服務供應商可以利用第三方分析,並在服務品質而非基本客群規模方面與老牌公司競爭。
對「先買後付」模式的監管收緊
英國、美國和澳洲的消費者保護機構正在製定相關法規,將「先買後付」(BNPL)產品歸類為信貸產品,並強制要求進行還款能力評估、標準化資訊揭露以及製定處理財務困難的程序。服務提供者需要與信用查詢機構合作,加強糾紛解決流程,並調整收入模式,減少對滯納金的依賴。不斷上漲的合規成本可能會推動產業整合,並促使企業與已持有貸款執照的受監管貸款機構建立合作關係。對於零售商而言,短期內「先買後付」支付方式的普及速度可能會放緩,但透明的使用條款預計將在長期內擴大其客戶群。一旦統一的框架建立,積極整合受監管資料欄位和還款分析功能的金融科技公司將擁有強大的競爭優勢。
細分市場分析
儘管新銀行目前僅佔金融科技市場的一小部分,但預計到2030年,其複合年成長率將高達18.7%,這標誌著銀行業正從分店為中心轉向以應用程式為中心發生決定性轉變。快速的功能擴展、透明的定價和個人化的洞察,正幫助新銀行吸引更年輕、更「行動優先」的消費者。現有金融機構正在透過加速建立數位子公司和升級核心銀行系統來應對這一趨勢,縮小用戶體驗差距,同時增加技術預算。到2024年,數位支付解決方案將佔據金融科技市場46.2%的佔有率,並將繼續成為獲取客戶的關鍵切入點。服務提供者正在將詐欺分析、忠誠度計畫整合和營運資金貸款等功能整合到支付基礎設施中,將低利潤的支付處理轉變為捆綁式增值提案,從而提高客戶終身收入。
除了電子錢包和銀行卡之外,保險科技(Insurtech)、財富科技(Wealthtech)和監管科技(Regtech)正在開創新的專業領域,透過資料科學和自動化變革傳統流程。基於承保範圍的保險和人工智慧驅動的理賠優先排序正在降低保險公司的賠付率,保險公司與雲端供應商之間的合資企業也日益活躍。在資產管理領域,持分所有權和自動再平衡正在使投資更加民主化,而合規自動化工具則正在將新的報告義務貨幣化。能否在單一用戶體驗中整合多種提案將決定未來的贏家,金融科技平台正朝著模組化架構發展,用戶可以自由切換支付、信貸、儲蓄和保險等服務。
區域分析
預計到2024年,亞太地區將佔據全球金融科技市場44.86%的佔有率,並在2030年前以16.02%的複合年成長率成長。中國的超級應用生態系統和印度的統一支付介面(UPI)基礎設施,以及東南亞降低准入門檻的數位銀行牌照項目,都在推動該地區的成長。世界各國政府正將金融科技定位為促進經濟普惠的手段,簡化電子身分驗證(e-KYC)標準,並建立監管沙盒。該地區的成熟企業推出戰略創投基金,為新創企業注入資金,利用自身新能力,同時規避顛覆性風險。
儘管北美地區的用戶普及率已趨於成熟,但它仍然是創新中心。人工智慧驅動的個人化服務、加密貨幣服務和雲端原生核心銀行系統正在成為差異化服務,監管機構也正在就穩定幣和數位資產託管提供更清晰的指南。創業投資資金集中在擁有安全資料交換協議的公司,這反映了從備受矚目的網路安全事件中學到的教訓。該地區的金融科技市場繼續受益於雄厚的資本市場,這些市場重視已驗證的收入留存率和交叉銷售指標。
歐洲的監管領導力正在塑造該地區的金融科技格局。 PSD2推動了開放銀行平台的發展,MiCA使加密貨幣發行更加透明,而DORA則建立了嚴格的營運彈性規則。這些框架催生了專業的監管科技供應商和合規即服務(CaaS)產品,從而創造了新的收入來源。歐洲大陸的新型銀行正在利用牌照通行證計畫擴大業務規模,並在多幣種體系下實現服務本地化。此外,對綠色金融的需求正在刺激氣候數據金融科技平台的發展,這些平台能夠在交易層面衡量範圍3的碳排放。
在南美洲,以巴西即時支付網路PIX為中心,行動支付的普及速度正快速成長。大規模人口沒有銀行帳戶,加上「行動優先」的生活方式,為電子錢包提供者、數位貸款機構和微額保險計劃創造了肥沃的土壤。監管機構對沙盒測試的開放態度吸引了國際資本,而領先的本土企業正透過提供低成本匯款服務和基於公用事業收費繳費記錄的信用評分,將業務拓展至區域範圍。隨著基礎設施的日趨成熟,該地區正將其人才和產品框架輸出到其他新興市場。
中東和非洲蘊藏著多元化的商業機會。波灣合作理事會(GCC)成員國正在發放數位銀行牌照,經營政府支持的金融科技加速器,並利用主權財富基金投資以人工智慧為中心的金融計畫。非洲的行動支付網路交易量依然位居全球領先地位,匯款管道與海外僑民的電子錢包相連。該地區的主要金融科技主題包括符合伊斯蘭教法的嵌入式金融、低手續費的國際匯款以及利用衛星農業數據的農業貸款。
其他好處:
- Excel格式的市場預測(ME)表
- 3個月的分析師支持
目錄
第1章:引言
- 研究假設和市場定義
- 調查範圍
第2章:調查方法
第3章執行摘要
第4章 市場狀況
- 市場概覽
- 市場促進因素
- 即時支付(FedNow、SEPA即時信用轉帳)的強制實施正在加速金融科技的普及。
- 開放銀行和API標準化(PSD2,巴西開放金融)擴大資料訪問
- 中國和印度的央行數位貨幣試點計畫正在推動金融科技基礎設施的升級。
- 亞洲電子商務平台嵌入式金融的興起
- 中東、北非和南美洲中小企業之間的信貸差距正在推動數位借貸平台的成長。
- 在歐洲,與環境、社會和治理 (ESG) 相關的金融科技解決方案正在吸引綠色投資基金。
- 市場限制因素
- 針對「先買後付」模式的監管執法
- 複雜的詐騙和深度造假帶來的身份驗證風險
- 雲端集中化帶來的風險:單點故障的出現。
- 「資金籌措」和「企業價值調整」阻礙了規模擴大。
- 價值供應鏈分析
- 監理展望
- 技術展望
- 波特五力模型
- 投資和資金籌措分析
第5章 市場規模與成長預測
- 服務方案
- 數位支付
- 數位借貸和金融
- 數位投資
- 保險科技
- 新銀行
- 最終用戶
- 零售
- 公司
- 透過使用者介面
- 行動應用
- 網頁/瀏覽器
- POS/物聯網設備
- 按地區
- 北美洲
- 美國
- 加拿大
- 墨西哥
- 南美洲
- 巴西
- 阿根廷
- 智利
- 哥倫比亞
- 其他南美國家
- 歐洲
- 英國
- 德國
- 法國
- 西班牙
- 義大利
- 比荷盧經濟聯盟(比利時、荷蘭、盧森堡)
- 北歐國家(瑞典、挪威、丹麥、芬蘭、冰島)
- 其他歐洲國家
- 亞太地區
- 中國
- 印度
- 日本
- 韓國
- 澳洲
- 東南亞(新加坡、印尼、馬來西亞、泰國、越南、菲律賓)
- 其他亞太國家
- 中東和非洲
- 阿拉伯聯合大公國
- 沙烏地阿拉伯
- 南非
- 奈及利亞
- 其他中東和非洲國家
- 北美洲
第6章 競爭情勢
- 市場集中度
- 策略趨勢
- 市佔率分析
- 公司簡介
- PayPal Holdings Inc.
- Ant Group Co. Ltd.
- Stripe Inc.
- Block Inc.(Square, Cash App)
- Adyen NV
- Coinbase Global Inc.
- Robinhood Markets Inc.
- Revolut Ltd.
- Klarna Bank AB
- N26 GmbH
- SoFi Technologies Inc.
- Nubank(Nu Holdings)
- Wise plc
- Juspay
- FIS Global
- Fiserv Inc.
- Intuit Inc.
- M-PESA(Vodafone/Safaricom)
- Paytm Digital Payments Ltd.
- Razorpay Software Pvt Ltd.
第7章 市場機會與未來展望
According to Mordor Intelligence, the fintech market size was valued at USD 278.31 billion in 2025 and is estimated to grow from USD 320.81 billion in 2025 to reach USD 652.80 billion by 2030, at a CAGR of 15.27% during the forecast period (2025-2030).
This report is Segmented by Service Proposition (Digital Payments, Digital Lending and Financing, Digital Investments, Insurtech, and Neobanking), by End-User (Retail and Businesses), by User Interface (Mobile Applications, Web / Browser, and POS / IoT Devices), and by Region (North America, South America, Europe, Asia-Pacific, & Middle East and Africa). The Market Forecasts are Provided in Terms of Value (USD).
Global Fintech Market Trends and Insights
Real-time payments mandates accelerating fintech adoption
Central-bank systems such as FedNow in the United States and SEPA Instant Credit Transfer in Europe are transforming settlement expectations from hours to seconds. Faster clearing underpins new value propositions in treasury management, micro-lending, and cash-flow analytics, helping the fintech market reach enterprise customers that once relied on slower batch processes. In 2025, U.S. real-time transactions are expected to hit 7.4 billion, and similar momentum is visible in China, the United Kingdom, and Hong Kong. Providers that integrate overlay services - request to pay, automated reconciliation, and just-in-time financing - gain sticky revenue streams grounded in the same rails. Adoption is most rapid where regulators set explicit migration deadlines and update settlement finality rules. Payment-network interoperability remains the next hurdle, but pilots linking domestic faster-payment systems already demonstrate viable cross-border models.
Open-banking & API standardization broadening data access
PSD2 in Europe and Brazil's Open Finance regime prove that uniform API specifications can unlock account aggregation, balance verification, and direct-from-bank payments at scale. Standardized consent flows shift competition away from data hoarding toward data utilization, encouraging predictive underwriting and hyper-personalized budgeting tools. Regulators now treat open finance as critical digital infrastructure, prompting adoption across the Americas and parts of Asia-Pacific. Fintech platforms that pair bank-sourced data with merchant, telecom, or social signals create richer risk models, lowering default rates and broadening credit access. The pattern is fostering interoperable fintech market ecosystems where smaller providers tap third-party analytics to compete against incumbents on service quality rather than raw customer reach.
Regulatory clamp-down on BNPL models
Consumer-protection agencies in the United Kingdom, the United States, and Australia are drafting rules that classify BNPL products as credit, mandating affordability checks, standardized disclosures, and hardship protocols. Providers must integrate soft-pull credit bureaus, upgrade dispute-resolution workflows, and adjust revenue models away from late-fee dependency. Compliance costs rise, encouraging consolidation and alliances with regulated lenders that already hold lending licenses. Retailers may experience slower BNPL checkout adoption in the near term, but transparent terms could expand the addressable base over time. Fintech firms that pre-emptively embed regulation-ready data fields and repayment analytics create defensible positions once uniform frameworks crystallize.
Other drivers and restraints analyzed in the detailed report include:
- CBDC pilots in China & India driving infrastructure upgrades
- Rise of embedded finance among Asian e-commerce platforms
- Sophisticated fraud & deepfake-based identity risks
For complete list of drivers and restraints, kindly check the Table Of Contents.
Segment Analysis
Neobanking accounts for a modest slice of the fintech market size yet posts the fastest 18.7% CAGR to 2030, signaling a decisive shift from branch-centric to app-centric banking. Feature velocity, transparent pricing, and personalized insights allow neobanks to capture young, mobile-first consumers. Established lenders react with digital subsidiaries and accelerated core-bank modernization, narrowing the experiential gap but raising technology budgets. Digital-payments solutions hold 46.2% of the fintech market share in 2024 and remain vital gateways for customer acquisition. Providers layer fraud-analytics, loyalty integrations, and working-capital loans onto payment rails, turning low-margin processing into bundled value propositions that lift customer lifetime revenue.
Expanding beyond wallets and cards, insurtech, wealth-tech, and reg-tech carve specialized lanes where data science and automation can upend legacy processes. Usage-based insurance and AI-driven claims triage cut carrier loss ratios, attracting joint ventures between insurers and cloud vendors. In wealth management, fractional ownership and automated rebalancing democratize investing, while compliance-automation tools monetize new reporting mandates. The ability to orchestrate multiple service propositions within a single experience defines future winners, pushing fintech platforms toward modular architectures that let users toggle between payments, credit, savings, and protection.
Complete Report Scope:
- By Service Proposition
- Digital Payments
- Digital Lending and Financing
- Digital Investments
- Insurtech
- Neobanking
- By End-User
- Retail
- Businesses
- By User Interface
- Mobile Applications
- Web / Browser
- POS / IoT Devices
- By Region
- North America
- United States
- Canada
- Mexico
- South America
- Brazil
- Argentina
- Chile
- Colombia
- Rest of South America
- Europe
- United Kingdom
- Germany
- France
- Spain
- Italy
- Benelux (Belgium, Netherlands, and Luxembourg)
- Nordics (Sweden, Norway, Denmark, Finland, and Iceland)
- Rest of Europe
- Asia-Pacific
- China
- India
- Japan
- South Korea
- Australia
- South-East Asia (Singapore, Indonesia, Malaysia, Thailand, Vietnam, and Philippines)
- Rest of Asia-Pacific
- Middle East and Africa
- United Arab Emirates
- Saudi Arabia
- South Africa
- Nigeria
- Rest of Middle East and Africa
- North America
Geography Analysis
Asia-Pacific commanded 44.86% of the fintech market in 2024 and is on track for a 16.02% CAGR through 2030. China's super-app ecosystem and India's UPI rails anchor regional growth, joined by Southeast Asian digital-bank license programs that lower entry barriers. Governments treat fintech as a lever for economic inclusion, streamlining e-KYC norms and nurturing sandboxes. Regional incumbents respond with strategic venture arms that inject capital into start-ups, hedging disruption risk while tapping novel capabilities.
North America remains an innovative powerhouse despite maturing user penetration. AI-driven personalization, crypto-asset services, and cloud-native core banking differentiate offerings as regulators provide clearer guidance on stablecoins and digital-asset custody. Venture funding gravitates toward firms with secure data-exchange protocols, reflecting lessons from high-profile cyber incidents. The fintech market in the region continues to benefit from deep capital markets that reward proven revenue retention and cross-selling metrics.
Europe's regulatory leadership shapes its fintech trajectory. PSD2 catalyzed open-banking platforms, MiCA brings clarity to crypto-asset issuance, and DORA sets stringent operational-resilience rules. These frameworks spawn specialized reg-tech vendors and compliance-as-a-service products, adding new revenue layers. Continental neobanks localize services across multi-currency regimes while passporting licenses to scale. Additionally, green-finance imperatives stimulate climate-data fintech platforms that measure scope-3 emissions at the transaction level.
South America showcases rising adoption curves anchored by Brazil's PIX instant-payment network. Large unbanked populations and mobile-first behavior create fertile ground for wallet providers, digital lenders, and micro-insurance schemes. Regulatory openness to sandbox testing attracts international capital, and domestic champions scale regionally by offering low-cost remittances and credit scoring tied to utility-bill histories. As the infrastructure matures, the region exports talent and product frameworks to other emerging markets.
Middle East and Africa present heterogeneous opportunity sets. Gulf Cooperation Council states issue digital-bank licenses, host government-backed fintech accelerators, and invest sovereign wealth in AI-centric finance ventures. Africa's mobile-money rails remain world-leading in transaction volume, and remittance corridors integrate with diaspora wallets abroad. Regional fintech themes include Sharia-compliant embedded finance, low-fee cross-border transfers, and agricultural-input lending facilitated via satellite agronomy data.
List of Companies Covered in this Report:
- PayPal Holdings Inc.
- Ant Group Co. Ltd.
- Stripe Inc.
- Block Inc. (Square, Cash App)
- Adyen N.V.
- Coinbase Global Inc.
- Robinhood Markets Inc.
- Revolut Ltd.
- Klarna Bank AB
- N26 GmbH
- SoFi Technologies Inc.
- Nubank (Nu Holdings)
- Wise plc
- Juspay
- FIS Global
- Fiserv Inc.
- Intuit Inc.
- M-PESA (Vodafone / Safaricom)
- Paytm Digital Payments Ltd.
- Razorpay Software Pvt Ltd.
Additional Benefits:
- The market estimate (ME) sheet in Excel format
- 3 months of analyst support
TABLE OF CONTENTS
1 Introduction
- 1.1 Study Assumptions & Market Definition
- 1.2 Scope of the Study
2 Research Methodology
3 Executive Summary
4 Market Landscape
- 4.1 Market Overview
- 4.2 Market Drivers
- 4.2.1 Real-time Payments Mandates (FedNow, SEPA Instant Credit Transfer) Accelerating Fintech Adoption
- 4.2.2 Open-Banking & API Standardization (PSD2, Brazil Open Finance) Broadening Data Access
- 4.2.3 CBDC Pilots in China & India Driving Fintech Infrastructure Upgrades
- 4.2.4 Rise of Embedded-Finance Among Asian E-commerce Platforms
- 4.2.5 SME Credit Gap in MENA & South America Fueling Digital Lending Platforms
- 4.2.6 ESG-Linked Fintech Solutions Attracting Green-Investment Funds in Europe
- 4.3 Market Restraints
- 4.3.1 Regulatory Clamp-down on BNPL Models
- 4.3.2 Sophisticated Fraud & Deepfake?based Identity Risks
- 4.3.3 Cloud-Concentration Risk Creating Single Points-of-Failure
- 4.3.4 Funding Winter & Valuation Corrections Curbing Scale-ups
- 4.4 Value / Supply-Chain Analysis
- 4.5 Regulatory Outlook
- 4.6 Technological Outlook
- 4.7 Porter's Five Forces
- 4.7.1 Threat of New Entrants
- 4.7.2 Bargaining Power of Buyers/Consumers
- 4.7.3 Bargaining Power of Suppliers
- 4.7.4 Threat of Substitutes
- 4.7.5 Intensity of Competitive Rivalry
- 4.8 Investment & Funding Trend Analysis
5 Market Size & Growth Forecasts (Value)
- 5.1 By Service Proposition
- 5.1.1 Digital Payments
- 5.1.2 Digital Lending and Financing
- 5.1.3 Digital Investments
- 5.1.4 Insurtech
- 5.1.5 Neobanking
- 5.2 By End-User
- 5.2.1 Retail
- 5.2.2 Businesses
- 5.3 By User Interface
- 5.3.1 Mobile Applications
- 5.3.2 Web / Browser
- 5.3.3 POS / IoT Devices
- 5.4 By Region
- 5.4.1 North America
- 5.4.1.1 United States
- 5.4.1.2 Canada
- 5.4.1.3 Mexico
- 5.4.2 South America
- 5.4.2.1 Brazil
- 5.4.2.2 Argentina
- 5.4.2.3 Chile
- 5.4.2.4 Colombia
- 5.4.2.5 Rest of South America
- 5.4.3 Europe
- 5.4.3.1 United Kingdom
- 5.4.3.2 Germany
- 5.4.3.3 France
- 5.4.3.4 Spain
- 5.4.3.5 Italy
- 5.4.3.6 Benelux (Belgium, Netherlands, and Luxembourg)
- 5.4.3.7 Nordics (Sweden, Norway, Denmark, Finland, and Iceland)
- 5.4.3.8 Rest of Europe
- 5.4.4 Asia-Pacific
- 5.4.4.1 China
- 5.4.4.2 India
- 5.4.4.3 Japan
- 5.4.4.4 South Korea
- 5.4.4.5 Australia
- 5.4.4.6 South-East Asia (Singapore, Indonesia, Malaysia, Thailand, Vietnam, and Philippines)
- 5.4.4.7 Rest of Asia-Pacific
- 5.4.5 Middle East and Africa
- 5.4.5.1 United Arab Emirates
- 5.4.5.2 Saudi Arabia
- 5.4.5.3 South Africa
- 5.4.5.4 Nigeria
- 5.4.5.5 Rest of Middle East and Africa
- 5.4.1 North America
6 Competitive Landscape
- 6.1 Market Concentration
- 6.2 Strategic Moves
- 6.3 Market Share Analysis
- 6.4 Company Profiles (includes Global level Overview, Market Level Overview, Core Segments, Financials as available, Strategic Information, Market Rank/Share for Key Companies, Products & Services, and Recent Developments)
- 6.4.1 PayPal Holdings Inc.
- 6.4.2 Ant Group Co. Ltd.
- 6.4.3 Stripe Inc.
- 6.4.4 Block Inc. (Square, Cash App)
- 6.4.5 Adyen N.V.
- 6.4.6 Coinbase Global Inc.
- 6.4.7 Robinhood Markets Inc.
- 6.4.8 Revolut Ltd.
- 6.4.9 Klarna Bank AB
- 6.4.10 N26 GmbH
- 6.4.11 SoFi Technologies Inc.
- 6.4.12 Nubank (Nu Holdings)
- 6.4.13 Wise plc
- 6.4.14 Juspay
- 6.4.15 FIS Global
- 6.4.16 Fiserv Inc.
- 6.4.17 Intuit Inc.
- 6.4.18 M-PESA (Vodafone / Safaricom)
- 6.4.19 Paytm Digital Payments Ltd.
- 6.4.20 Razorpay Software Pvt Ltd.
7 Market Opportunities & Future Outlook
- 7.1 White-space & Unmet-Need Assessment

 中東和北非金融科技:市場佔有率分析、行業趨勢和統計數據以及成長預測(2026-2031 年)亞太地區金融科技:市場佔有率分析、產業趨勢與統計及成長預測(2026-2031)北美金融科技:市佔率分析、產業趨勢與統計及成長預測(2026-2031)德國金融科技:市場佔有率分析、產業趨勢與統計及成長預測(2026-2031)新加坡金融科技:市場佔有率分析、產業趨勢與統計及成長預測(2026-2031)歐洲金融科技:市場佔有率分析、產業趨勢與統計及成長預測(2026-2031)越南金融科技:市場佔有率分析、產業趨勢與統計及成長預測(2026-2031)馬來西亞金融科技:市場佔有率分析、產業趨勢與統計及成長預測(2026-2031)印度金融科技:市場佔有率分析、產業趨勢與統計及成長預測(2026-2031)
 金融科技即服務 (FaaS) 市場 - 全球市場預測 2026-2032