


 |
市場調查報告書
商品編碼
2121392
英國石油與天然氣:市場佔有率分析、產業趨勢與統計、成長預測(2026-2031)United Kingdom Oil And Gas - Market Share Analysis, Industry Trends & Statistics, Growth Forecasts (2026 - 2031) |
||||||

※ 本網頁內容可能與最新版本有所差異。詳細情況請與我們聯繫。
根據 Mordor Intelligence 預測,英國石油和天然氣市場規模將從 2025 年的 108.5 億美元成長到 2026 年的 111.4 億美元,然後在 2031 年達到 127.2 億美元,2026 年至 2031 年的複合年成長率為 2.69%。
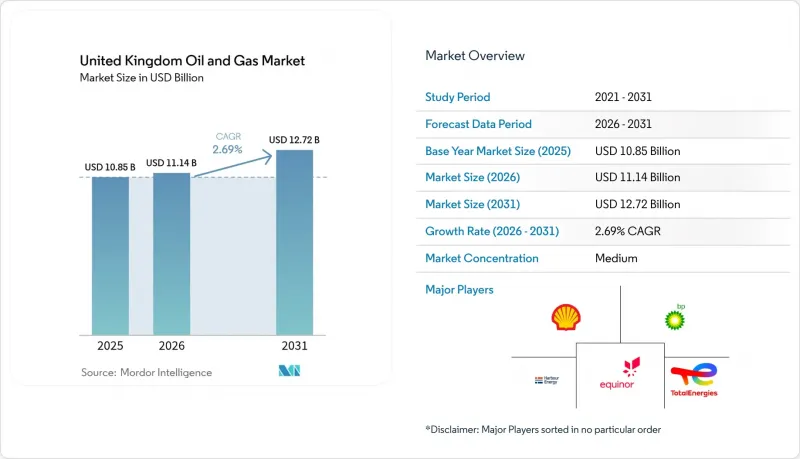
本報告按行業(上游、中游、下游)、部署地點(陸上、海上)和服務(建設、維護/檢修、退役)進行細分。市場規模和預測均以美元計價。
英國油氣市場趨勢與洞察
北海地區較低的採礦成本提高了營運效率。
北海的開採成本已大幅下降,使英國營運商在全球能源市場面臨挑戰時擁有了競爭優勢。自2020年以來,海底系統的技術進步和鑽井技術的改進已使每桶原油的開採成本降低了15%至20%,即使在日益成長的財務壓力下也能保持獲利能力。這種成本降低的趨勢使英國油田在與國際競爭對手的較量中處於有利地位,尤其是在能源安全問題日益突出、國內生產價值日益凸顯的情況下。這種效率的提升得益於先進的儲存管理系統和最佳化的生產計劃,這些系統在最大限度地提高採收率的同時,最大限度地降低了營運成本。營運商正利用這些成本優勢來延長油田的壽命,並為繼續投資於可能面臨提前退役的成熟資產提供合理的理由。
英國北海「過渡協議」的獎勵正在重塑投資重點。
英國北海轉型協議為在實現淨零排放目標方面取得顯著進展的企業提供系統性的財政獎勵,從根本上改變了整個產業的資本配置決策。投資抵免和折舊免稅額率獎勵那些將碳捕獲、利用與儲存(CCUS)技術整合到營運中的公司,符合條件的項目可獲得相當於符合資格稅額扣抵抵免。該政策框架已承諾從2024年起投入超過20億英鎊用於CCUS投資,將以往無利可圖的項目轉變為可行的發展機會。該協議為在減排方面展現技術領先地位的企業提供了競爭優勢,並有效地津貼了向低碳油氣生產的轉型。取得ISO 14001環境管理系統認證對於充分利用這些激勵措施變得越來越重要,企業正在大力投資建立合規體系。
CCS課稅的加速徵收給企業的現金流帶來了壓力。
針對上游業者的加速捕碳封存(CCS)課稅的訂定,立即給英國大陸棚帶來了巨大的財務壓力,主要生產商的合規成本估計每年高達1.5億至2億英鎊。此法規結構要求營運商無論是否參與具體項目,都必須為國家CCS基礎設施的建設做出貢獻,實際上是透過產業專項課稅津貼更廣泛的能源轉型目標。這種課稅結構對缺乏規模來承擔這些額外成本的中小型獨立運營商造成了不成比例的影響,可能會加速行業重組,因為無利可圖的運營商可能會尋求大規模的合作夥伴或徹底退出市場。遵守課稅要求需要加強監測和報告能力,這進一步增加了營運的複雜性和資源負擔。
細分市場分析
2025年上游業務佔71.65%的市場佔有率,這反映了開採在英國油氣產業中持續的核心地位;而中游業務到2031年的複合年成長率(CAGR)為4.18%,顯示投資重心正從基礎設施和加工環節轉向上游。上游業務受益於先進的開採技術和油田延壽計劃,這些措施最大限度地提高了現有北海資產的價值。像Harbour Energy這樣的業者在2024年投資超過13億美元用於資產收購,以增強產能。中游業務的加速成長主要受二氧化碳捕集、利用與儲存(CCUS)專案關鍵基礎設施需求的驅動,這些專案需要對管道網路和加工設施進行重大升級,以滿足二氧化碳運輸和氫氣生產的需求。由於對成品油的需求旺盛,下游業務依然強勁,但該產業面臨電氣化趨勢和可再生燃料強制令的長期挑戰。
中游基礎設施的投資尤其集中在東海岸叢集,其中Keras Midstream的H2NorthEast工廠擁有1吉瓦的藍氫生產能力,這將需要對現有管道進行大規模維修並安裝新的壓縮站。預計到2025年,英國油氣市場的中游業務規模將達到21.9億美元,年成長率比產業平均高出1.5個百分點。英國天然氣輸送系統由超過7,600公里的高壓管道組成,國家電網每年投資25億英鎊用於維護和加強該網路,以支援傳統天然氣輸送和新興的氫能應用。浮體式生產儲卸油船(FPSO)的引入正在擴大處理能力,使以前難以開發的蘊藏量得以開發。同時,儲能基礎設施也受惠於戰略石油儲備的需求以及平衡季節性需求的需要。
其他好處:
- Excel格式的市場預測(ME)表
- 3個月的分析師支持
目錄
第1章:引言
- 研究假設和市場定義
- 調查範圍
第2章:調查方法
第3章執行摘要
第4章 市場狀況
- 市場概覽
- 市場促進因素
- 北海裝運成本降低
- 根據英國《北海過渡協議》享有的優惠待遇
- 浮體式海上風電平台數量激增(降低了探勘和生產成本)
- 蒂斯河畔亨伯地區的再工業化(藍氫的需求)
- 利用人工智慧進行地震波成像的成功率
- 市場限制因素
- 加快對上游企業課稅碳捕獲與封存稅。
- 併網離岸風力發電將蠶食天然氣尖峰時段需求。
- 提高退役保證金要求
- 供應鏈分析
- 監理情勢
- 技術展望
- 原油產量和消費量預測
- 天然氣生產與消費預測
- 管道設置容量分析
- 非傳統資源(緻密油、油砂、深海油田)資本投資預測
- 波特五力模型
- PESTLE分析
第5章 市場規模與成長預測
- 按行業
- 上游
- 中游
- 下游
- 按部署位置
- 陸上
- 離岸
- 按服務
- 建造
- 保守黨的轉變
- 退休
第6章 競爭情勢
- 市場集中度
- 策略趨勢(併購、聯盟、購電協議)
- 市場佔有率分析(主要公司的市場排名和佔有率)
- 公司簡介
- Shell plc
- BP plc
- Harbour Energy plc
- TotalEnergies SE
- Equinor ASA
- Chevron Corp.
- Centrica plc
- Valaris plc
- INEOS Group Ltd
- ConocoPhillips UK Ltd
- EnQuest plc
- Ithaca Energy plc
- Neptune Energy Group
- Cadent Gas Ltd
- Dana Petroleum Ltd
- ESSO UK Ltd
- BG Group Ltd
- Premier Oil(Chrysaor)
- Wood plc
- Subsea 7 SA
第7章 市場機會與未來展望
According to Mordor Intelligence, the United Kingdom oil and gas market size is expected to grow from USD 10.85 billion in 2025 to USD 11.14 billion in 2026 and is forecast to reach USD 12.72 billion by 2031 at 2.69% CAGR over 2026-2031.
This report is Segmented by Sector (Upstream, Downstream, and Midstream), Location (Onshore and Offshore), and Service (Construction, Maintenance and Turn-Around, and Decommissioning). The Market Sizes and Forecasts are Provided in Terms of Value (USD).
United Kingdom Oil And Gas Market Trends and Insights
Declining North Sea Lifting Costs Drive Operational Efficiency
North Sea lifting costs have decreased substantially, creating competitive advantages for UK operators amid global energy market challenges. Technological breakthroughs in subsea systems and enhanced drilling techniques have cut per-barrel extraction costs by 15-20% since 2020, sustaining production viability despite heightened fiscal pressures. This cost reduction trajectory positions UK fields favorably against international alternatives, particularly as energy security concerns elevate domestic production value. The efficiency gains result from advanced reservoir management systems and optimized production scheduling, which maximize recovery rates while minimizing operational expenses. Operators leverage these cost improvements to extend field life and justify continued investment in mature assets that might otherwise face early decommissioning.
UK North Sea Transition Deal Incentives Reshape Investment Priorities
The UK North Sea Transition Deal offers structured fiscal incentives to operators demonstrating measurable progress toward net-zero emissions targets, thereby fundamentally altering capital allocation decisions across the sector. Investment allowances and enhanced depletion rates reward companies that integrate carbon capture, utilization, and storage technologies into their operations, with qualifying projects receiving accelerated tax relief worth up to 40% of eligible expenditures. This policy framework has catalyzed over £2 billion in committed CCUS investments since 2024, transforming previously uneconomical projects into viable development opportunities. The deal creates competitive advantages for operators demonstrating technological leadership in emissions reduction, effectively subsidizing the transition toward lower-carbon hydrocarbon production. ISO 14001 environmental management certification has become increasingly critical for accessing these incentives, with operators investing heavily in compliance processes.
Accelerated CCS Levy Strains Operator Cash Flows
The introduction of accelerated carbon capture and storage levies on upstream operators has created immediate financial pressure across the UK Continental Shelf, with compliance costs estimated at £150-200 million annually for major producers. This regulatory framework requires operators to contribute to national CCS infrastructure development regardless of their individual project participation, effectively subsidizing broader energy transition objectives through sector-specific taxation. The levy structure disproportionately impacts smaller independents who lack the scale to absorb these additional costs, potentially accelerating consolidation as marginal operators seek larger partners or exit the market entirely. Compliance with the levy requirements demands enhanced monitoring and reporting capabilities, which add operational complexity and further strain resources.
Other drivers and restraints analyzed in the detailed report include:
- Floating Wind Platform Integration Reduces Operational Carbon Intensity
- Teesside and Humber Industrial Clusters Create Blue Hydrogen Demand
- Offshore Wind Grid Integration Reduces Peak Gas Demand
For complete list of drivers and restraints, kindly check the Table Of Contents.
Segment Analysis
The upstream segment's commanding 71.65% market share in 2025 reflects the continued centrality of extraction activities to UK oil and gas operations, yet the midstream segment's 4.18% CAGR through 2031 signals a fundamental shift toward infrastructure and processing investments. Upstream activities benefit from enhanced recovery techniques and extended field life programs that maximize value from existing North Sea assets. Operators like Harbour Energy have invested over USD 1.3 billion in asset acquisitions during 2024 to consolidate production capabilities. The midstream segment's accelerated growth stems from critical infrastructure requirements for carbon capture, utilization, and storage projects, with pipeline networks and processing facilities requiring substantial upgrades to handle CO2 transport and hydrogen production. Downstream operations maintain steady performance through refined product demand, though the segment faces long-term headwinds from electrification trends and renewable fuel mandates.
Midstream infrastructure investments are particularly concentrated in the East Coast Cluster, where Kellas Midstream's H2NorthEast facility represents a 1 GW blue hydrogen production capability that necessitates extensive pipeline modifications and the installation of new compression stations. The UK oil and gas market size for midstream operations reached USD 2.19 billion in 2025, with annual growth rates exceeding the sector average by 1.5 percentage points. The UK's gas transmission system spans over 7,600 km of high-pressure pipelines, with National Grid investing £2.5 billion annually in network maintenance and enhancement projects that support both traditional gas transport and emerging hydrogen applications. Processing capabilities are expanding through the deployment of floating production, storage, and offloading vessels, which enable the development of previously stranded reserves. Meanwhile, storage infrastructure benefits from strategic petroleum reserve requirements and seasonal demand balancing needs.
Complete Report Scope:
- By Sector
- Upstream
- Midstream
- Downstream
- By Location of Deployment
- Onshore
- Offshore
- By Service
- Construction
- Maintenance and Turn-around
- Decommissioning
List of Companies Covered in this Report:
- Shell plc
- BP plc
- Harbour Energy plc
- TotalEnergies SE
- Equinor ASA
- Chevron Corp.
- Centrica plc
- Valaris plc
- INEOS Group Ltd
- ConocoPhillips UK Ltd
- EnQuest plc
- Ithaca Energy plc
- Neptune Energy Group
- Cadent Gas Ltd
- Dana Petroleum Ltd
- ESSO UK Ltd
- BG Group Ltd
- Premier Oil (Chrysaor)
- Wood plc
- Subsea 7 SA
Additional Benefits:
- The market estimate (ME) sheet in Excel format
- 3 months of analyst support
TABLE OF CONTENTS
1 Introduction
- 1.1 Study Assumptions & Market Definition
- 1.2 Scope of the Study
2 Research Methodology
3 Executive Summary
4 Market Landscape
- 4.1 Market Overview
- 4.2 Market Drivers
- 4.2.1 Declining North Sea lifting costs
- 4.2.2 UK "North Sea Transition Deal" incentives
- 4.2.3 Surge in floating-wind-powered platforms (E&P cost cuts)
- 4.2.4 Re-industrialisation of Teesside & Humber (blue hydrogen demand)
- 4.2.5 AI-enabled seismic imaging success rates
- 4.3 Market Restraints
- 4.3.1 Accelerated CCS levy on upstream operators
- 4.3.2 Grid-connected offshore wind cannibalising peak-time gas demand
- 4.3.3 Heightened decommissioning bond requirements
- 4.4 Supply-Chain Analysis
- 4.5 Regulatory Landscape
- 4.6 Technological Outlook
- 4.7 Crude-Oil Production & Consumption Outlook
- 4.8 Natural-Gas Production & Consumption Outlook
- 4.9 Installed Pipeline Capacity Analysis
- 4.10 Unconventional Resources CAPEX Outlook (tight oil, oil sands, deep-water)
- 4.11 Porter's Five Forces
- 4.11.1 Bargaining Power of Suppliers
- 4.11.2 Bargaining Power of Consumers
- 4.11.3 Threat of New Entrants
- 4.11.4 Threat of Substitutes
- 4.11.5 Intensity of Competitive Rivalry
- 4.12 PESTLE Analysis
5 Market Size & Growth Forecasts
- 5.1 By Sector
- 5.1.1 Upstream
- 5.1.2 Midstream
- 5.1.3 Downstream
- 5.2 By Location of Deployment
- 5.2.1 Onshore
- 5.2.2 Offshore
- 5.3 By Service
- 5.3.1 Construction
- 5.3.2 Maintenance and Turn-around
- 5.3.3 Decommissioning
6 Competitive Landscape
- 6.1 Market Concentration
- 6.2 Strategic Moves (M&A, Partnerships, PPAs)
- 6.3 Market Share Analysis (Market Rank/Share for key companies)
- 6.4 Company Profiles (includes Global level Overview, Market level overview, Core Segments, Financials as available, Strategic Information, Products & Services, and Recent Developments)
- 6.4.1 Shell plc
- 6.4.2 BP plc
- 6.4.3 Harbour Energy plc
- 6.4.4 TotalEnergies SE
- 6.4.5 Equinor ASA
- 6.4.6 Chevron Corp.
- 6.4.7 Centrica plc
- 6.4.8 Valaris plc
- 6.4.9 INEOS Group Ltd
- 6.4.10 ConocoPhillips UK Ltd
- 6.4.11 EnQuest plc
- 6.4.12 Ithaca Energy plc
- 6.4.13 Neptune Energy Group
- 6.4.14 Cadent Gas Ltd
- 6.4.15 Dana Petroleum Ltd
- 6.4.16 ESSO UK Ltd
- 6.4.17 BG Group Ltd
- 6.4.18 Premier Oil (Chrysaor)
- 6.4.19 Wood plc
- 6.4.20 Subsea 7 SA
7 Market Opportunities & Future Outlook
- 7.1 White-space & Unmet-Need Assessment

 義大利石油和天然氣:市場佔有率分析、行業趨勢和統計數據以及成長預測(2026-2031 年)馬來西亞油氣:市場佔有率分析、產業趨勢與統計及成長預測(2026-2031)中國油氣市場:市場佔有率分析、產業趨勢與統計及成長預測(2026-2031年)印尼油氣市場:市場佔有率分析、產業趨勢與統計及成長預測(2026-2031年)東南亞油氣市場:市場佔有率分析、產業趨勢與統計及成長預測(2026-2031年)美國石油和天然氣:市場佔有率分析、行業趨勢和統計數據以及成長預測(2026-2031 年)印度石油和天然氣:市場佔有率分析、行業趨勢和統計數據以及成長預測(2026-2031 年)
 2026年全球油氣管道及相關結構建設市場報告
 石油和天然氣市場規模、佔有率和成長分析(按產品類型、產業類型、部署類型、應用和地區分類)-2026-2033年產業預測越南石油天然氣:市場佔有率分析、產業趨勢與統計、成長預測(2026-2031年)