


 |
市場調查報告書
商品編碼
2066419
印度石油和天然氣:市場佔有率分析、行業趨勢和統計數據以及成長預測(2026-2031 年)India Oil and Gas - Market Share Analysis, Industry Trends & Statistics, Growth Forecasts (2026 - 2031) |
||||||

※ 本網頁內容可能與最新版本有所差異。詳細情況請與我們聯繫。
根據 Mordor Intelligence 預測,印度石油和天然氣市場規模將從 2025 年的 232.8 億美元成長到 2026 年的 244.2 億美元,到 2031 年將達到 312.4 億美元,2026 年至 2031 年的複合年成長率為 5.05%。
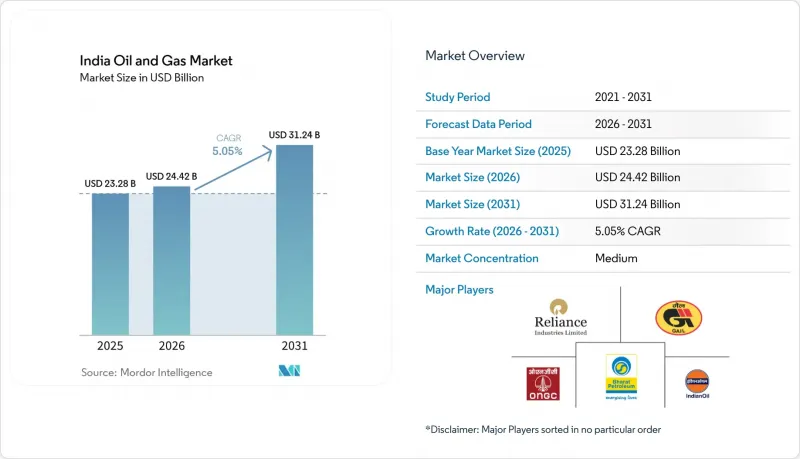
本報告按行業(上游、中游、下游)、地區(陸上和海上)和服務(建設、維護/檢修、退役)進行細分。市場規模和預測均以美元計價。
印度油氣市場趨勢與洞察
國內探勘與生產(E&P)許可證競標程序更加嚴格。
根據未開發區塊許可政策(OALP),在2025年進行的OALP-VIII輪招標中,共分配了14個區塊,允許私人探勘公司進入該盆地,此前該盆地僅限於國有企業。包括凱恩石油天然氣公司在內的獨立公司目前持有22個探勘區塊的權益,這縮短了評估週期,並促進了二次採油試點項目的開展,從而在短期內提高了產量。收入分成財政模式在原油價格下跌時減少了政府的佔有率,提高了未開發盆地的經濟可行性。監管機構嚴格執行工作計畫里程碑,因此營運商依靠基於機器學習的地震探勘工具在三年內完成資料收集。這些趨勢共同推動了鑽井活動,並對印度的油氣市場產生了積極影響。
天然氣相關產業叢集的快速成長
到2027年,新建的甲醇制烯烴轉化裝置和直接鐵還原(DRI)裝置將新增每日1200萬標準立方米的天然氣需求,從而拓展傳統化肥買家以外的更廣泛的需求基礎。光是在古吉拉突邦的達赫傑-哈吉拉走廊,每年就有42億立方公尺的天然氣透過照付不議合約得到保障,維持了管線運輸量。在泰米爾納德邦,一座年產120萬噸乙烯的裂解裝置預計將於2026年運作,該裝置將吸收來自Enoa公司的再氣化液化天然氣,並進一步收緊區域供需平衡。隨著布蘭特原油價格超過每桶70美元,每百萬英熱單位70印度盧比的統一關稅上限將迫使管線運輸與石腦油運輸競爭。與燃煤發電廠相比,燃氣電廠更高的熱效率促使能源密集型製造商遵守環保法規。
受環境、社會及治理(ESG)因素驅動,資本從化石燃料資產流出。
隨著2025年淨零排放目標的落實,機構投資人已拋售了價值約18億美元的印度石化燃料相關股票。儘管股票市場歷來提供上游項目三分之一的資金,但如今私人營運商被迫支付比基準利率高出150-200個基點的利差來為專案獲利能力,這削弱了它們的資金籌措。印度天然氣公司(GAIL)價值21億美元的賈格迪什普爾-哈爾迪亞管道項目難以從國際貸款機構資金籌措,迫使該公司依賴即將達到風險敞口上限的國內銀行。環境、社會和治理(ESG)篩檢也限制了中下游項目,因為資訊揭露框架要求公司量化範圍3的排放,這使得天然氣項目在一些全球基金的青睞下處於劣勢。由此導致的資金短缺正在推遲最終的投資決策,並減緩印度油氣市場的成長。
細分市場分析
2025年,上游產業佔印度油氣市場收入的69.1%,但由於成熟油田人工開採的依賴性增強,其營業利潤率下降至34%,抽油成本上升至每桶22美元。下游產業(煉油和石化)年均成長率為5.4%,其中信實工業2025會計年度的煉油毛利率達到每桶11.80美元,比新加坡基準高出7.30美元,這主要得益於聚合物加工量佔其總加工量的18%。中游產業佔據剩餘佔有率,但統一的價格上限限制了其收入潛力,即便加工量有所成長。
價值獲取結構正在改變。能夠管理從油井到聚合物桶整個流程的一體化公司正在獲得更高的利潤率。石化業務的併入不僅提升了利潤率,也保護了煉油廠免受汽車燃料價格波動的影響,下游資產在印度油氣市場的戰略重要性日益凸顯。上游公司正積極響應這一趨勢,開展諸如Khan的聚合物注入法等增產技術的試點計畫。此方法預計將使產量增加1.4億桶,反映了下游產業流程最佳化的概念。
其他好處:
- Excel格式的市場預測(ME)表
- 3個月的分析師支持
目錄
第1章:引言
- 研究假設和市場定義
- 調查範圍
第2章:調查方法
第3章執行摘要
第4章 市場狀況
- 市場概覽
- 市場促進因素
- 國內油氣探勘開發許可證競標程序更加嚴格。
- 天然氣產業叢集的快速成長
- 城市燃氣供應(CGD)網路擴建
- 增加私人投資用於煉油廠現代化改造
- 在成熟盆地引入數位化油田
- 甲烷外洩減少義務
- 市場限制因素
- 間接稅制度下原物料價格的波動
- 主要管道用地徵用延誤
- 深海採礦區的損益平衡點較高
- 受環境、社會及公司治理(ESG)因素驅動,石化燃料資產資本外流。
- 供應鏈分析
- 監理情勢
- 技術展望
- 原油產量和消費量預測
- 天然氣生產與消費預測
- 管道設置容量分析
- 非傳統資源(緻密油、油砂、深海油田)資本投資預測
- 波特五力模型
- PESTLE分析
第5章 市場規模與成長預測
- 按行業
- 上游部門
- 中游
- 下游
- 按位置
- 陸上
- 離岸
- 按服務
- 建造
- 保守黨的轉變
- 退休
第6章 競爭情勢
- 市場集中度
- 策略趨勢(併購、聯盟、購電協議)
- 市場佔有率分析(主要公司的市場排名和佔有率)
- 公司簡介
- Oil and Natural Gas Corporation(ONGC)
- Oil India Limited
- Reliance Industries Ltd.
- Indian Oil Corporation Ltd.
- Bharat Petroleum Corporation Ltd.
- Hindustan Petroleum Corporation Ltd.
- GAIL(India)Ltd.
- Cairn Oil & Gas(Vedanta)
- Petronet LNG Ltd.
- Adani Total Gas Ltd.
- Nayara Energy Ltd.
- ONGC Videsh Ltd.
- Oil and Natural Gas Services(OVL)
- Larsen & Toubro-Hydrocarbon
- Schlumberger India
- Halliburton India
- Baker Hughes India
- Jindal Drilling & Industries Ltd.
- Essar Oil & Gas Exploration & Production
- HPCL-Mittal Energy Ltd.
- Gujarat State Petroleum Corporation(GSPC)
- Numaligarh Refinery Ltd.
- Chennai Petroleum Corporation Ltd.
- Mangalore Refinery & Petrochemicals Ltd.
第7章 市場機會與未來展望
According to Mordor Intelligence, the india oil and gas market size is expected to grow from USD 23.28 billion in 2025 to USD 24.42 billion in 2026 and is forecast to reach USD 31.24 billion by 2031 at 5.05% CAGR over 2026-2031.
This report is Segmented by Sector (Upstream, Midstream, and Downstream), Location (Onshore and Offshore), and Service (Construction, Maintenance and Turn-Around, and Decommissioning). The Market Sizes and Forecasts are Provided in Terms of Value (USD).
India Oil and Gas Market Trends and Insights
Tightening Domestic E&P Licensing Rounds
The Open Acreage Licensing Policy awarded 14 blocks in the OALP-VIII round during 2025, bringing private explorers into basins historically reserved for state-owned firms. Cairn Oil & Gas and other independents now hold interests in 22 exploration blocks, compressing appraisal timelines and encouraging secondary-recovery pilots that raise near-term production. The revenue-sharing fiscal model lowers the government's take when crude prices soften, improving frontier basin economics. Regulators enforce strict work-program milestones, so operators rely on machine-learning seismic tools to finish data acquisition within three-year windows. These developments collectively lift drilling activity and underpin the positive impact on the Indian oil and gas market.
Surge in Gas-Based Industrial Clusters
New methanol-to-olefins and direct-reduced iron facilities added 12 million scm per day of gas demand by 2027, broadening the buyer base beyond legacy fertilizer offtakers. Gujarat's Dahej-Hazira corridor alone locked in 4.2 bcm of annual supply under take-or-pay contracts, sustaining pipeline throughput for. Tamil Nadu's Cuddalore complex will commission a 1.2 Mt ethylene cracker in 2026, absorbing regasified LNG from Ennore and tightening regional balances. A unified tariff cap of INR 70 per MMBtu keeps pipeline transport competitive with naphtha when Brent exceeds USD 70 per barrel. Higher thermal efficiency of gas-fired units relative to coal bolsters environmental compliance for energy-intensive manufacturers.
ESG-Driven Capital Flight from Fossil Assets
Institutional investors divested roughly USD 1.8 billion from Indian fossil equities in 2025 as net-zero mandates took hold. Equity markets had historically supplied one-third of upstream project capital, so private operators now pay 150-200 basis-point spreads above benchmarks to secure debt, eroding project economics. GAIL's USD 2.1 billion Jagdishpur-Haldia pipeline struggled to attract international lenders, pushing the firm toward domestic banks that approach exposure ceilings. ESG screens also constrain midstream and downstream projects because disclosure frameworks force companies to quantify Scope 3 emissions, which positions gas unfavorably for some global funds. The resulting capital scarcity delays final investment decisions and tempers growth in the Indian oil and gas market.
Other drivers and restraints analyzed in the detailed report include:
- Expansion of City-Gas Distribution Networks
- Rising Private Investments in Refinery Upgrades
- Slow Land-Acquisition for Trunk Pipelines Constrains Infrastructure Development
For complete list of drivers and restraints, kindly check the Table Of Contents.
Segment Analysis
Upstream held 69.1% of the Indian oil and gas market revenue in 2025, yet its operating margin fell to 34% as mature fields required more artificial lift, pushing lifting costs to USD 22 per barrel. Downstream refining and petrochemicals expanded at 5.4% a year, and Reliance's FY2025 gross refining margin of USD 11.80 per barrel exceeded the Singapore benchmark by USD 7.30 because 18% of throughput became polymers. Midstream held the balance, but a unified tariff cap limits upside even as volumes grow.
Value capture is shifting: integrated players controlling molecules from the wellhead to the barrel of polymer command higher returns. Petrochemical add-ons boost margins while insulating refineries from motor-fuel cyclicality, making downstream assets increasingly strategic to the Indian oil and gas market. Upstream firms are responding with enhanced-oil-recovery pilots such as Cairn's polymer flood that could add 140 million barrels, mirroring downstream process-optimization philosophies.
List of Companies Covered in this Report:
- Oil and Natural Gas Corporation (ONGC)
- Oil India Limited
- Reliance Industries Ltd.
- Indian Oil Corporation Ltd.
- Bharat Petroleum Corporation Ltd.
- Hindustan Petroleum Corporation Ltd.
- GAIL (India) Ltd.
- Cairn Oil & Gas (Vedanta)
- Petronet LNG Ltd.
- Adani Total Gas Ltd.
- Nayara Energy Ltd.
- ONGC Videsh Ltd.
- Oil and Natural Gas Services (OVL)
- Larsen & Toubro - Hydrocarbon
- Schlumberger India
- Halliburton India
- Baker Hughes India
- Jindal Drilling & Industries Ltd.
- Essar Oil & Gas Exploration & Production
- HPCL-Mittal Energy Ltd.
- Gujarat State Petroleum Corporation (GSPC)
- Numaligarh Refinery Ltd.
- Chennai Petroleum Corporation Ltd.
- Mangalore Refinery & Petrochemicals Ltd.
Additional Benefits:
- The market estimate (ME) sheet in Excel format
- 3 months of analyst support
TABLE OF CONTENTS
1 Introduction
- 1.1 Study Assumptions & Market Definition
- 1.2 Scope of the Study
2 Research Methodology
3 Executive Summary
4 Market Landscape
- 4.1 Market Overview
- 4.2 Market Drivers
- 4.2.1 Tightening domestic E&P licensing rounds
- 4.2.2 Surge in gas-based industrial clusters
- 4.2.3 Expansion of city-gas distribution (CGD) networks
- 4.2.4 Rising private investments in refinery upgrades
- 4.2.5 Digital oil-field adoption for mature basins
- 4.2.6 Methane-slip abatement mandates
- 4.3 Market Restraints
- 4.3.1 Feedstock volatility under Indirect Tax regime
- 4.3.2 Slow land-acquisition for trunk pipelines
- 4.3.3 High breakeven of deep-water prospects
- 4.3.4 ESG-driven capital flight from fossil assets
- 4.4 Supply-Chain Analysis
- 4.5 Regulatory Landscape
- 4.6 Technological Outlook
- 4.7 Crude-Oil Production & Consumption Outlook
- 4.8 Natural-Gas Production & Consumption Outlook
- 4.9 Installed Pipeline Capacity Analysis
- 4.10 Unconventional Resources CAPEX Outlook (tight oil, oil sands, deep-water)
- 4.11 Porter's Five Forces
- 4.11.1 Threat of New Entrants
- 4.11.2 Bargaining Power of Suppliers
- 4.11.3 Bargaining Power of Buyers
- 4.11.4 Threat of Substitutes
- 4.11.5 Intensity of Competitive Rivalry
- 4.12 PESTLE Analysis
5 Market Size & Growth Forecasts
- 5.1 By Sector
- 5.1.1 Upstream
- 5.1.2 Midstream
- 5.1.3 Downstream
- 5.2 By Location
- 5.2.1 Onshore
- 5.2.2 Offshore
- 5.3 By Service
- 5.3.1 Construction
- 5.3.2 Maintenance and Turn-around
- 5.3.3 Decommissioning
6 Competitive Landscape
- 6.1 Market Concentration
- 6.2 Strategic Moves (M&A, Partnerships, PPAs)
- 6.3 Market Share Analysis (Market Rank/Share for key companies)
- 6.4 Company Profiles (includes Global level Overview, Market level overview, Core Segments, Financials as available, Strategic Information, Products & Services, and Recent Developments)
- 6.4.1 Oil and Natural Gas Corporation (ONGC)
- 6.4.2 Oil India Limited
- 6.4.3 Reliance Industries Ltd.
- 6.4.4 Indian Oil Corporation Ltd.
- 6.4.5 Bharat Petroleum Corporation Ltd.
- 6.4.6 Hindustan Petroleum Corporation Ltd.
- 6.4.7 GAIL (India) Ltd.
- 6.4.8 Cairn Oil & Gas (Vedanta)
- 6.4.9 Petronet LNG Ltd.
- 6.4.10 Adani Total Gas Ltd.
- 6.4.11 Nayara Energy Ltd.
- 6.4.12 ONGC Videsh Ltd.
- 6.4.13 Oil and Natural Gas Services (OVL)
- 6.4.14 Larsen & Toubro - Hydrocarbon
- 6.4.15 Schlumberger India
- 6.4.16 Halliburton India
- 6.4.17 Baker Hughes India
- 6.4.18 Jindal Drilling & Industries Ltd.
- 6.4.19 Essar Oil & Gas Exploration & Production
- 6.4.20 HPCL-Mittal Energy Ltd.
- 6.4.21 Gujarat State Petroleum Corporation (GSPC)
- 6.4.22 Numaligarh Refinery Ltd.
- 6.4.23 Chennai Petroleum Corporation Ltd.
- 6.4.24 Mangalore Refinery & Petrochemicals Ltd.
7 Market Opportunities & Future Outlook
- 7.1 White-space & Unmet-need Assessment

 石油和天然氣市場規模、佔有率、成長、全球產業分析、區域趨勢以及 2026 年至 2034 年的預測。
 義大利石油和天然氣:市場佔有率分析、行業趨勢和統計數據以及成長預測(2026-2031 年)英國石油與天然氣:市場佔有率分析、產業趨勢與統計、成長預測(2026-2031)馬來西亞油氣:市場佔有率分析、產業趨勢與統計及成長預測(2026-2031)中國油氣市場:市場佔有率分析、產業趨勢與統計及成長預測(2026-2031年)印尼油氣市場:市場佔有率分析、產業趨勢與統計及成長預測(2026-2031年)東南亞油氣市場:市場佔有率分析、產業趨勢與統計及成長預測(2026-2031年)美國石油和天然氣:市場佔有率分析、行業趨勢和統計數據以及成長預測(2026-2031 年)
 2026年全球油氣管道及相關結構建設市場報告
 石油和天然氣市場規模、佔有率和成長分析(按產品類型、產業類型、部署類型、應用和地區分類)-2026-2033年產業預測