


 |
市場調查報告書
商品編碼
2120402
東南亞油氣市場:市場佔有率分析、產業趨勢與統計及成長預測(2026-2031年)Southeast Asia Oil And Gas - Market Share Analysis, Industry Trends & Statistics, Growth Forecasts (2026 - 2031) |
||||||

※ 本網頁內容可能與最新版本有所差異。詳細情況請與我們聯繫。
據 Mordor Intelligence 稱,東南亞油氣市場在 2025 年的價值為 389.7 億美元,預計到 2031 年將達到 534.4 億美元,而 2026 年為 410.8 億美元,預測期(2026-2031 年)的複合年成長率為 5.40%。
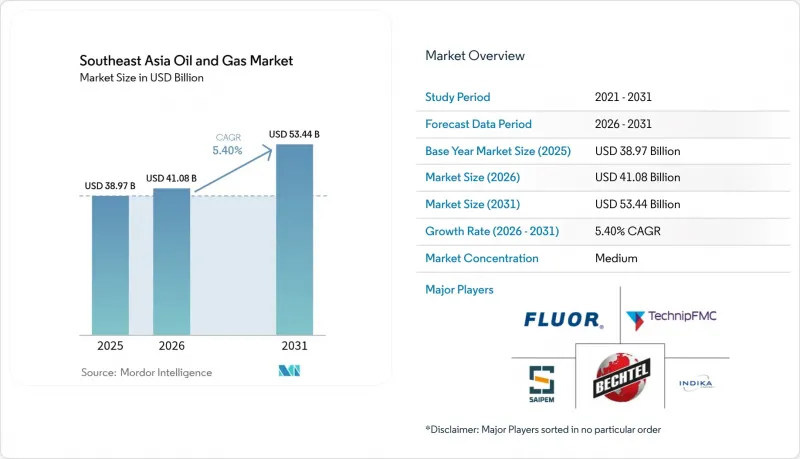
本報告按行業(上游、中游、下游)、位置(陸上和海上)、服務(建造、維護/檢修、退役)和地區(印尼、馬來西亞、泰國、越南、菲律賓、新加坡、緬甸及其他東南亞國家)進行細分。市場規模和預測均以美元計價。
東南亞油氣市場趨勢與洞察
疫情後的投資復甦加速了上游產業的復甦。
2024年,東南亞上游項目的資本支出成長34%,達到285億美元,原因是營運商重啟了先前延期的探勘和開發項目。馬來西亞國家石油公司(Petronas)向其在馬來西亞的近海業務投資了82億美元,印尼國家石油公司(PT Pertamina)則撥款47億美元用於印尼的擴張項目,這表明市場對不斷成長的需求重拾信心。其中約40%的投資投向了已確定的液化天然氣(LNG)供應鏈,馬來西亞的浮體式液化天然氣(FLNG)項目和印尼的陸上液化設施受益最大。這項快速投資清理了2020年至2022年間延期的項目積壓,使該地區成為亞洲重要的LNG供應地。即時儲存分析和海底回接技術正在縮短投資回收期,進一步提振了上游產業的投資熱情。
能源安全需求正在推動國內資源開發。
世界各國政府正加強降低進口依賴。菲律賓於2024年啟動了一項戰略石油儲備計劃,以確保30天的石油供應;越南將其天然氣儲存能力提高了25%;泰國國家石油公司(PTT)將泰國灣的探勘支出增加了45%,以彌補成熟油田產量下降的影響;緬甸不顧政治風險,劃撥了12個新的區塊。修訂後的財務條款——提高成本回收上限和加快折舊——正在提升專案的經濟可行性,並吸引國內外資本。這些努力與東協確保在全球市場動盪時期供應韌性的總體目標一致。
現有油田減產的速度超過了補充蘊藏量的努力速度。
預計到2024年,印尼盆地的油氣資源年消耗率將達到8%至12%,遠高於5%至7%的全球平均。馬來西亞老化的海上油氣資產到2026年需要23億美元的維護成本才能維持目前的產量水平,這將加重營運商的現金流負擔。該地區的蘊藏量補充率已降至0.7倍,凸顯了新發現油氣資源數量的不足。加密鑽井和增產技術只是權宜之計。營運商正面臨不斷飆升的採礦成本和與廢棄礦山相關的日益成長的債務,這可能導致更嚴格的資本管制和前沿探勘的延誤。
細分市場分析
2025年,上游業務收入佔總營收的72.15%,預計到2031年將以5.67%的年均成長率成長,持續維持其在東南亞油氣市場的最大佔有率。印尼的阿巴迪液化天然氣計畫和馬來西亞的卡薩瓦利天然氣開發計畫等大型計畫是上游業務支出的主要來源,同時,中游網路也同步擴張,以滿足新增產能的需求。由於更嚴格的排放標準限制了新煉油廠的建設,下游產能成長落後。
數位化儲存模型和先進的海底處理技術正在提高採收率,進一步鞏固上游產業的主導地位。各國政府優先發展國內生產以增強能源安全,新的財政獎勵引導資本流向探勘而非煉油廠現代化。憑藉提高採收率(EOR)技術和非傳統資源試點項目,上游產業將持續引領東南亞油氣產業的發展。
其他好處:
- Excel格式的市場預測(ME)表
- 3個月的分析師支持
目錄
第1章:引言
- 研究假設和市場定義
- 調查範圍
第2章:調查方法
第3章執行摘要
第4章 市場狀況
- 市場概覽
- 市場促進因素
- 疫情後上游產業及液化天然氣供應鏈投資的復甦
- 在能源安全的背景下,促進國內生產和儲備。
- 液化天然氣進口終端和再氣化能力的快速擴張
- 碳捕獲與封存(CCS)技術的引進使得開發高二氧化碳含量的天然氣田成為可能。
- 現有天然氣管網中生質燃料/氫氣混合示範項目
- 數位化使無利可圖的油田商業化成為可能。
- 市場限制因素
- 現有油田產量下降與補充蘊藏量。
- 東協成員國的監理與金融不確定性
- 受環境、社會及公司治理(ESG)因素驅動,石化燃料資產資本外流。
- 由於南海海事爭端,鑽探工作被推遲。
- 供應鏈分析
- 監理情勢
- 技術展望
- 原油產量和消費量預測
- 天然氣生產與消費預測
- 管道設置容量分析
- 非傳統資源(緻密油、油砂、深海油田)資本投資預測
- 波特五力模型
第5章 市場規模與成長預測
- 按行業
- 上游部門
- 中游
- 下游產業
- 按位置
- 陸上
- 離岸
- 按服務
- 建造
- 保守黨的轉變
- 退休
- 按地區
- 印尼
- 馬來西亞
- 泰國
- 越南
- 菲律賓
- 新加坡
- 緬甸
- 其他東南亞國家
第6章 競爭情勢
- 市場集中度
- 策略趨勢(併購、聯盟、購電協議)
- 市場佔有率分析(主要公司的市場排名和市場佔有率)
- 公司簡介
- PETRONAS
- PT Pertamina Persero
- PTT Exploration & Production PLC
- ExxonMobil Corp.
- Shell PLC
- Chevron Corp.
- TotalEnergies SE
- Harbour Energy PLC
- ConocoPhillips
- BP PLC
- Sinopec Engineering Group
- TechnipFMC PLC
- Saipem SpA
- Bechtel Corp.
- Fluor Corp.
- John Wood Group PLC
- Petrofac Ltd.
- Samsung Engineering Co. Ltd.
- PT Indika Energy Tbk
- PT Rekayasa Industri
- PT Meindo Elang Indah
第7章 市場機會與未來展望
According to Mordor Intelligence, the Southeast Asia oil and gas market size was valued at USD 38.97 billion in 2025 and estimated to grow from USD 41.08 billion in 2026 to reach USD 53.44 billion by 2031, at a CAGR of 5.40% during the forecast period (2026-2031).
This report is Segmented by Sector (Upstream, Midstream, and Downstream), Location (Onshore and Offshore), Service (Construction, Maintenance and Turn-Around, and Decommissioning), and Geography (Indonesia, Malaysia, Thailand, Vietnam, Philippines, Singapore, Myanmar, and Rest of Southeast Asia). The Market Sizes and Forecasts are Provided in Terms of Value (USD).
Southeast Asia Oil And Gas Market Trends and Insights
Post-pandemic investment rebound accelerates upstream recovery
Capital spending on Southeast Asian upstream projects increased by 34% in 2024 to USD 28.5 billion, as operators reinstated delayed exploration and development programs. PETRONAS dedicated USD 8.2 billion to Malaysian offshore work, and PT Pertamina allocated USD 4.7 billion for Indonesian expansions, signaling restored confidence in demand growth. Approximately 40% of that is spent on targeted LNG supply chains, with Malaysia's floating LNG and Indonesia's onshore liquefaction benefiting most. The rapid outlays clear a project backlog dating from 2020-2022 deferrals and position the region as a swing LNG supplier for wider Asia. Real-time reservoir analytics and subsea tie-backs are compressing payback periods, further stimulating upstream commitments.
Energy-security imperatives drive domestic resource development
Governments are intensifying efforts to cut import dependence. The Philippines initiated a strategic petroleum reserve program in 2024, which provides 30 days of coverage, while Vietnam increased its gas storage capacity by 25%. Thailand's PTT boosted exploration spending 45% in the Gulf of Thailand to offset mature-field decline, and Myanmar awarded 12 new blocks despite political risks. Revised fiscal terms-higher cost-recovery ceilings and accelerated depreciation-have improved project economics, drawing both local and foreign capital. These actions align with broader ASEAN goals of supply resiliency amid volatile global markets.
Legacy field decline outpaces reserve-replacement efforts
Indonesian basins recorded 8-12% annual depletion in 2024, exceeding the global 5-7% norm.Malaysia's aging offshore assets need USD 2.3 billion of maintenance by 2026 to sustain plateau output, straining operator cash flow. The regional reserve-replacement ratio fell to 0.7 times, underscoring the insufficient number of discoveries. Infill drilling and enhanced recovery provide only tactical relief. Operators face steeper lift costs and heightened abandonment liabilities, which intensify capital discipline and can delay frontier exploration.
Other drivers and restraints analyzed in the detailed report include:
- LNG-terminal construction transforms regional gas infrastructure
- Biofuel integration pilots transform gas-network utilization
- Regulatory fragmentation creates investment uncertainty
For complete list of drivers and restraints, kindly check the Table Of Contents.
Segment Analysis
Upstream activities generated 72.15% of 2025 revenue, and the segment is projected to grow at a rate of 5.67% through 2031, maintaining its largest share of the Southeast Asia oil and gas market. Massive projects such as Indonesia's Abadi LNG and Malaysia's Kasawari gas development underpin spending, while midstream networks expand in tandem to evacuate new volumes. Downstream capacity growth lags because stricter emission standards curb new refinery builds.
Digital reservoir models and advanced subsea processing are elevating recovery factors, reinforcing upstream leadership. Governments favor domestic production to enhance energy security, and new fiscal incentives tend to direct capital toward exploration rather than refining upgrades. Enhanced oil recovery and unconventional resource pilots will keep the upstream segment at the forefront of the Southeast Asia oil and gas industry.
Complete Report Scope:
- By Sector
- Upstream
- Midstream
- Downstream
- By Location
- Onshore
- Offshore
- By Service
- Construction
- Maintenance and Turn-around
- Decommissioning
- By Geography
- Indonesia
- Malaysia
- Thailand
- Vietnam
- Philippines
- Singapore
- Myanmar
- Rest of Southeast Asia
List of Companies Covered in this Report:
- PETRONAS
- PT Pertamina Persero
- PTT Exploration & Production PLC
- ExxonMobil Corp.
- Shell PLC
- Chevron Corp.
- TotalEnergies SE
- Harbour Energy PLC
- ConocoPhillips
- BP PLC
- Sinopec Engineering Group
- TechnipFMC PLC
- Saipem SpA
- Bechtel Corp.
- Fluor Corp.
- John Wood Group PLC
- Petrofac Ltd.
- Samsung Engineering Co. Ltd.
- PT Indika Energy Tbk
- PT Rekayasa Industri
- PT Meindo Elang Indah
Additional Benefits:
- The market estimate (ME) sheet in Excel format
- 3 months of analyst support
TABLE OF CONTENTS
1 Introduction
- 1.1 Study Assumptions & Market Definition
- 1.2 Scope of the Study
2 Research Methodology
3 Executive Summary
4 Market Landscape
- 4.1 Market Overview
- 4.2 Market Drivers
- 4.2.1 Post-pandemic investment rebound in upstream & LNG supply chains
- 4.2.2 Energy-security push for domestic production & storage
- 4.2.3 Rapid build-out of LNG import terminals & regas capacity
- 4.2.4 CCS deployment unlocking high-CO2 gas fields
- 4.2.5 Biofuel / hydrogen blending pilots in existing gas networks
- 4.2.6 Digitalisation enabling marginal field commercialisation
- 4.3 Market Restraints
- 4.3.1 Declining legacy fields & reserve replacement gap
- 4.3.2 Regulatory & fiscal uncertainty across ASEAN members
- 4.3.3 ESG-driven capital flight from fossil assets
- 4.3.4 South China Sea maritime disputes delaying drilling
- 4.4 Supply-Chain Analysis
- 4.5 Regulatory Landscape
- 4.6 Technological Outlook
- 4.7 Crude-Oil Production & Consumption Outlook
- 4.8 Natural-Gas Production & Consumption Outlook
- 4.9 Installed Pipeline Capacity Analysis
- 4.10 Unconventional Resources CAPEX Outlook (tight oil, oil sands, deep-water)
- 4.11 Porters Five Forces
- 4.11.1 Bargaining Power of Suppliers
- 4.11.2 Bargaining Power of Buyers
- 4.11.3 Threat of New Entrants
- 4.11.4 Threat of Substitutes
- 4.11.5 Industry Rivalry
5 Market Size & Growth Forecasts
- 5.1 By Sector
- 5.1.1 Upstream
- 5.1.2 Midstream
- 5.1.3 Downstream
- 5.2 By Location
- 5.2.1 Onshore
- 5.2.2 Offshore
- 5.3 By Service
- 5.3.1 Construction
- 5.3.2 Maintenance and Turn-around
- 5.3.3 Decommissioning
- 5.4 By Geography
- 5.4.1 Indonesia
- 5.4.2 Malaysia
- 5.4.3 Thailand
- 5.4.4 Vietnam
- 5.4.5 Philippines
- 5.4.6 Singapore
- 5.4.7 Myanmar
- 5.4.8 Rest of Southeast Asia
6 Competitive Landscape
- 6.1 Market Concentration
- 6.2 Strategic Moves (M&A, Partnerships, PPAs)
- 6.3 Market Share Analysis (Market Rank/Share for key companies)
- 6.4 Company Profiles (includes Global level Overview, Market level overview, Core Segments, Financials as available, Strategic Information, Products & Services, and Recent Developments)
- 6.4.1 PETRONAS
- 6.4.2 PT Pertamina Persero
- 6.4.3 PTT Exploration & Production PLC
- 6.4.4 ExxonMobil Corp.
- 6.4.5 Shell PLC
- 6.4.6 Chevron Corp.
- 6.4.7 TotalEnergies SE
- 6.4.8 Harbour Energy PLC
- 6.4.9 ConocoPhillips
- 6.4.10 BP PLC
- 6.4.11 Sinopec Engineering Group
- 6.4.12 TechnipFMC PLC
- 6.4.13 Saipem SpA
- 6.4.14 Bechtel Corp.
- 6.4.15 Fluor Corp.
- 6.4.16 John Wood Group PLC
- 6.4.17 Petrofac Ltd.
- 6.4.18 Samsung Engineering Co. Ltd.
- 6.4.19 PT Indika Energy Tbk
- 6.4.20 PT Rekayasa Industri
- 6.4.21 PT Meindo Elang Indah
7 Market Opportunities & Future Outlook
- 7.1 White-space & Unmet-Need Assessment

 義大利石油和天然氣:市場佔有率分析、行業趨勢和統計數據以及成長預測(2026-2031 年)英國石油與天然氣:市場佔有率分析、產業趨勢與統計、成長預測(2026-2031)馬來西亞油氣:市場佔有率分析、產業趨勢與統計及成長預測(2026-2031)中國油氣市場:市場佔有率分析、產業趨勢與統計及成長預測(2026-2031年)印尼油氣市場:市場佔有率分析、產業趨勢與統計及成長預測(2026-2031年)美國石油和天然氣:市場佔有率分析、行業趨勢和統計數據以及成長預測(2026-2031 年)印度石油和天然氣:市場佔有率分析、行業趨勢和統計數據以及成長預測(2026-2031 年)
 2026年全球油氣管道及相關結構建設市場報告
 石油和天然氣市場規模、佔有率和成長分析(按產品類型、產業類型、部署類型、應用和地區分類)-2026-2033年產業預測越南石油天然氣:市場佔有率分析、產業趨勢與統計、成長預測(2026-2031年)