


 |
市場調查報告書
商品編碼
2120284
美國石油和天然氣:市場佔有率分析、行業趨勢和統計數據以及成長預測(2026-2031 年)United States Oil And Gas - Market Share Analysis, Industry Trends & Statistics, Growth Forecasts (2026 - 2031) |
||||||

※ 本網頁內容可能與最新版本有所差異。詳細情況請與我們聯繫。
根據Mordor Intelligence預測,美國油氣市場規模預計在2026年達到1,493.2億美元,高於2025年的1,428.1億美元。預計到2031年,該市場規模將達到1,866.3億美元,2026年至2031年的複合年成長率為4.56%。
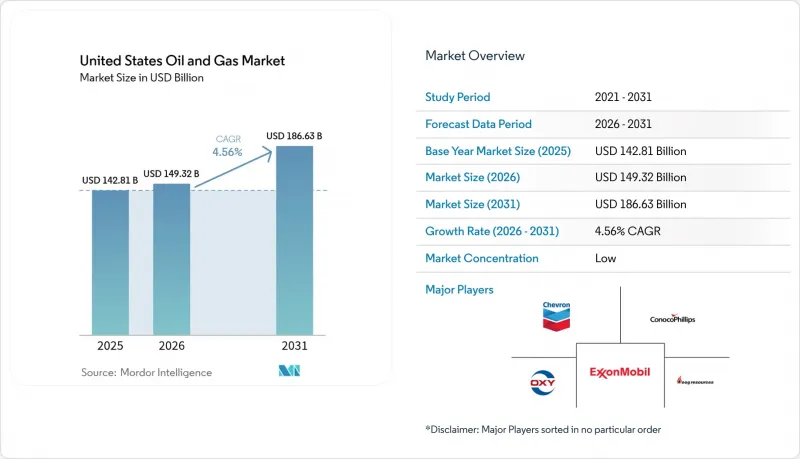
本報告按行業(上游、中游、下游)、地點(陸上和海上)和服務(建造、維護/檢修、退役)進行細分。市場規模和預測均以美元計價。
美國油氣市場趨勢與洞察
提高二疊紀盆地緻密油的產量
先進的設計和人工智慧驅動的鑽井技術推動二疊紀盆地的石油日產量在2024年達到630萬桶。儘管鑽井鑽機數量減少,但這仍占美國石油總產量成長的60%。更長的水平井、更高的丙烷充注率以及即時壓裂最佳化技術提高了單井採收率,同時降低了成本。埃克森美孚對先鋒公司的整合旨在透過標準化作業和基礎設施共用,進一步提高產量15%。獨立鑽井公司也採取類似策略以保持競爭力。因此,效率的提高為持續的產量成長奠定了基礎,並增強了美國油氣市場抵禦價格波動的能力。
液化天然氣出口能力快速成長
墨西哥灣沿岸新建的液化工廠正在重塑需求結構,將國內供應與全球價格溢價連結起來。 Venture Global公司的Prakmins終端將於2024年新增2,000萬噸/年的加工能力,隨後Golden Pass終端也將運作,預計年處理量為1,560萬噸。出口激增帶動了阿巴拉契亞和海恩斯維爾地區的鑽探活動,一條總價值150億美元的新管道正在將石油向南輸送。與全球市場連接性的增強正在緩解亨利樞紐的季節性價格波動,為生產商和中游運營商提供了更清晰的前景,進一步推動了美國油氣市場的擴張。
基於 OOOOb/c 的遵守 EPA 甲烷排放法規的成本
自2024年起,甲烷排放量超過設定閾值將受到附加稅,罰款金額從每噸900美元起,到2026年將增加至每噸1,500美元。新增的監測和修復項目將使典型頁岩油井的營運成本增加每桶2至4美元,對小規模生產商的影響最大。合規要求將加速產業重組,並促進連續洩漏檢測等技術的快速應用,從而改變美國油氣市場的成本結構。
細分市場分析
截至2025年,上游產業將占美國油氣市場的71.85%,預計到2031年將以4.84%的複合年成長率成長。中游產業將佔18.40%,這主要得益於管線擴建和LNG接收站的成長。同時,由於產能限制和更嚴格的排放法規,下游煉油業僅佔9.75%。目前,營運商的目標是在原油價格為每桶60美元的情況下實現15%或更高的內部收益率(IRR),並將資本轉移到高利潤的頁岩氣井和精心挑選的長週期項目中。康菲石油公司的Willow計畫就是這種轉變的典型例子,其30年的蘊藏量確保了現金流的永續性,這在短週期頁岩氣計畫中極為罕見。鑽井效率的提高和審慎的再投資將使上游產業繼續成為美國油氣市場持續成長的核心。
上游產業的主導地位得益於生產效率的快速提升,這使得成本維持在每桶低於40美元的損益平衡點附近。隨著液化天然氣(LNG)的成長帶動了儲存和運輸需求,中游產業仍然充滿機遇,但嚴格的資本管理抑制了投機性項目。下游產業的利潤率因可再生柴油的競爭以及監管合規成本而不斷下降。這些趨勢共同凸顯了上游產業對美國油氣市場獲利趨勢的顯著影響。
其他好處:
- Excel格式的市場預測(ME)表
- 3個月的分析師支持
目錄
第1章:引言
- 研究假設和市場定義
- 調查範圍
第2章:調查方法
第3章執行摘要
第4章 市場狀況
- 市場概覽
- 市場促進因素
- 提高二疊紀盆地緻密油的產量
- 液化天然氣出口能力激增-(墨西哥灣沿岸地區新生產線)
- 利用人工智慧進行地震波分析以提高邊際油井產量
- IRA 45Q 和 45V稅額扣抵降低了 CCS 成本。
- 企業綠色債券資金籌措將擴大中產階級規模
- 先進塑膠產業對石油基原料的小眾需求
- 市場限制因素
- 根據 EPA 000b/c 條款繳納甲烷排放費的成本
- 擴大州一級(如科羅拉多、新墨西哥州等)的建築退讓距離規定
- 二疊紀盆地水應力對裂縫發育的限制
- WTI原油和布蘭特原油之間的價格差異持續存在,對出口造成負面影響。
- 供應鏈分析
- 監理情勢
- 技術展望
- 原油產量和消費量預測
- 天然氣生產與消費預測
- 管道容量分析
- 非傳統資源(緻密油、油砂、深海油田)資本投資預測
- 波特五力模型
- PESTLE分析
第5章 市場規模與成長預測
- 按行業
- 上游部門
- 中游產業
- 下游產業
- 地點
- 陸上
- 離岸
- 按服務
- 建造
- 維護和檢修
- 退休
第6章 競爭情勢
- 市場集中度
- 策略趨勢(併購、聯盟、購電協議)
- 市場佔有率分析(主要公司的市場排名和佔有率)
- 公司簡介
- Exxon Mobil Corp.
- Chevron Corp.
- ConocoPhillips Co.
- EOG Resources Inc.
- Occidental Petroleum Corp.
- Pioneer Natural Resources Co.
- Phillips 66 Co.
- Valero Energy Corp.
- Marathon Petroleum Corp.
- Hess Corp.
- Devon Energy Corp.
- BP PLC
- Shell PLC
第7章 市場機會與未來展望
According to Mordor Intelligence, the United States oil and gas market size in 2026 is estimated at USD 149.32 billion, growing from 2025 value of USD 142.81 billion with 2031 projections showing USD 186.63 billion, growing at 4.56% CAGR over 2026-2031.
This report is Segmented by Sector (Upstream, Midstream, and Downstream), Location (Onshore and Offshore), and Service (Construction, Maintenance and Turn-Around, and Decommissioning). The Market Sizes and Forecasts are Provided in Terms of Value (USD).
United States Oil And Gas Market Trends and Insights
Tight-oil Productivity Gains in the Permian
Advanced completion designs and AI-guided drilling lifted Permian Basin output to 6.3 million barrels per day in 2024, representing 60% of total US growth despite a leaner rig fleet. Longer laterals, higher proppant loading, and real-time frac optimization push recovery per well higher while trimming costs. ExxonMobil's integration of Pioneer aims for a further 15% uplift through standardized execution and shared infrastructure. Independent drillers mirror these tactics to remain competitive. Efficiency, therefore, anchors continued output gains that fortify the US oil and gas market against price swings
Surging LNG Export Capacity
New Gulf Coast liquefaction trains reshape demand by linking domestic supply to global price premia. Venture Global's Plaquemines terminal added 20 million tpa capacity in 2024, with Golden Pass to follow at 15.6 million tpa. The export surge boosts Appalachian and Haynesville drilling, while USD 15 billion of new pipelines funnel volumes south. Closer alignment with world markets tempers seasonal Henry Hub volatility, strengthening forward visibility for producers and midstream players, and reinforcing expansion in the US oil and gas market.
Methane-fee Compliance Costs Under EPA OOOOb/c
Beginning in 2024, methane emissions exceeding set thresholds incur fees starting at USD 900 per metric ton and rising to USD 1,500 by 2026. Added monitoring and repair programs raise operating costs by USD 2-4 per barrel for typical shale wells, hitting smaller producers hardest. Compliance demands speed consolidation and quick adoption of technology, such as continuous leak detection, to alter cost structures within the US oil and gas market.
Other drivers and restraints analyzed in the detailed report include:
- AI-driven Seismic Analytics for Marginal Well Recovery
- IRA 45Q & 45V Tax Credits Lowering CCS Costs
- Water-stress Limits on Permian Fracturing
For complete list of drivers and restraints, kindly check the Table Of Contents.
Segment Analysis
Upstream claimed 71.85% of the US oil and gas market size in 2025 and is on track for a 4.84% CAGR to 2031. Midstream captured 18.40%, buoyed by pipeline additions and LNG terminal build-outs, while downstream refining held 9.75% amid capacity limits and tighter emissions rules. Operators now target internal rates above 15% at USD 60 oil, steering capital toward high-return shale laterals and select long-cycle projects. ConocoPhillips' Willow development illustrates the shift, with 30-year reserves offering cash-flow depth rare in short-cycle shale projects. Drilling efficiency and disciplined reinvestment keep the upstream segment at the center of continued gains in the US oil and gas market.
Upstream's dominance rests on rapid productivity gains that hold costs near sub-USD 40 per barrel breakevens. Midstream remains an opportunity-rich sector as LNG growth drives storage and takeaway needs, yet capital discipline tempers speculative projects. Downstream margins are tightening amid competition from renewable diesel and the cost of regulatory upgrades. Together, these dynamics reinforce the upstream sector's outsized influence on revenue trends within the US oil and gas market.
Complete Report Scope:
- By Sector
- Upstream
- Midstream
- Downstream
- By Location
- Onshore
- Offshore
- By Service
- Construction
- Maintenance and Turn-around
- Decommissioning
List of Companies Covered in this Report:
- Exxon Mobil Corp.
- Chevron Corp.
- ConocoPhillips Co.
- EOG Resources Inc.
- Occidental Petroleum Corp.
- Pioneer Natural Resources Co.
- Phillips 66 Co.
- Valero Energy Corp.
- Marathon Petroleum Corp.
- Hess Corp.
- Devon Energy Corp.
- BP PLC
- Shell PLC
Additional Benefits:
- The market estimate (ME) sheet in Excel format
- 3 months of analyst support
TABLE OF CONTENTS
1 Introduction
- 1.1 Study Assumptions & Market Definition
- 1.2 Scope of the Study
2 Research Methodology
3 Executive Summary
4 Market Landscape
- 4.1 Market Overview
- 4.2 Market Drivers
- 4.2.1 Tight-oil productivity gains in the Permian
- 4.2.2 Surging LNG export capacity (new Gulf Coast trains)
- 4.2.3 AI-driven seismic analytics for marginal well recovery
- 4.2.4 IRA 45Q & 45V tax credits lowering CCS costs
- 4.2.5 Corporate green-bond funding for midstream build-out
- 4.2.6 Niche petro-feedstock demand from advanced plastics
- 4.3 Market Restraints
- 4.3.1 Methane-fee compliance costs under EPA OOOOb/c
- 4.3.2 Growing state-level setback rules (e.g., CO, NM)
- 4.3.3 Water-stress limits on Permian fracturing
- 4.3.4 Persistent WTI-Brent discount hurting exports
- 4.4 Supply-Chain Analysis
- 4.5 Regulatory Landscape
- 4.6 Technological Outlook
- 4.7 Crude-Oil Production & Consumption Outlook
- 4.8 Natural-Gas Production & Consumption Outlook
- 4.9 Installed Pipeline Capacity Analysis
- 4.10 Unconventional Resources CAPEX Outlook (tight oil, oil sands, deep-water)
- 4.11 Porter's Five Forces
- 4.11.1 Bargaining Power - Suppliers
- 4.11.2 Bargaining Power - Buyers
- 4.11.3 Threat of New Entrants
- 4.11.4 Threat of Substitutes
- 4.11.5 Competitive Rivalry
- 4.12 PESTLE Analysis
5 Market Size & Growth Forecasts
- 5.1 By Sector
- 5.1.1 Upstream
- 5.1.2 Midstream
- 5.1.3 Downstream
- 5.2 By Location
- 5.2.1 Onshore
- 5.2.2 Offshore
- 5.3 By Service
- 5.3.1 Construction
- 5.3.2 Maintenance and Turn-around
- 5.3.3 Decommissioning
6 Competitive Landscape
- 6.1 Market Concentration
- 6.2 Strategic Moves (M&A, Partnerships, PPAs)
- 6.3 Market Share Analysis (Market Rank/Share for key companies)
- 6.4 Company Profiles (includes Global level Overview, Market level overview, Core Segments, Financials as available, Strategic Information, Products & Services, and Recent Developments)
- 6.4.1 Exxon Mobil Corp.
- 6.4.2 Chevron Corp.
- 6.4.3 ConocoPhillips Co.
- 6.4.4 EOG Resources Inc.
- 6.4.5 Occidental Petroleum Corp.
- 6.4.6 Pioneer Natural Resources Co.
- 6.4.7 Phillips 66 Co.
- 6.4.8 Valero Energy Corp.
- 6.4.9 Marathon Petroleum Corp.
- 6.4.10 Hess Corp.
- 6.4.11 Devon Energy Corp.
- 6.4.12 BP PLC
- 6.4.13 Shell PLC
7 Market Opportunities & Future Outlook
- 7.1 White-space & Unmet-need Assessment

 義大利石油和天然氣:市場佔有率分析、行業趨勢和統計數據以及成長預測(2026-2031 年)英國石油與天然氣:市場佔有率分析、產業趨勢與統計、成長預測(2026-2031)馬來西亞油氣:市場佔有率分析、產業趨勢與統計及成長預測(2026-2031)中國油氣市場:市場佔有率分析、產業趨勢與統計及成長預測(2026-2031年)印尼油氣市場:市場佔有率分析、產業趨勢與統計及成長預測(2026-2031年)東南亞油氣市場:市場佔有率分析、產業趨勢與統計及成長預測(2026-2031年)印度石油和天然氣:市場佔有率分析、行業趨勢和統計數據以及成長預測(2026-2031 年)
 2026年全球油氣管道及相關結構建設市場報告
 石油和天然氣市場規模、佔有率和成長分析(按產品類型、產業類型、部署類型、應用和地區分類)-2026-2033年產業預測越南石油天然氣:市場佔有率分析、產業趨勢與統計、成長預測(2026-2031年)