


 |
市場調查報告書
商品編碼
2113286
中國油氣市場:市場佔有率分析、產業趨勢與統計及成長預測(2026-2031年)China Oil And Gas - Market Share Analysis, Industry Trends & Statistics, Growth Forecasts (2026 - 2031) |
||||||

※ 本網頁內容可能與最新版本有所差異。詳細情況請與我們聯繫。
根據Mordor Intelligence預測,中國油氣市場規模預計在2026年達到1,142.1億美元,高於2025年的1,086.2億美元。預計到2031年,該市場規模將達到1,467.5億美元,從2026年到2031年的複合年成長率將達到5.15%。
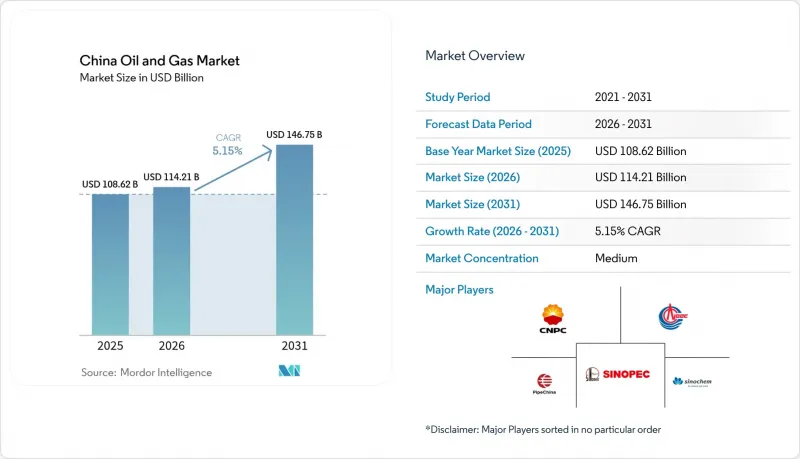
本報告按行業(上游、中游、下游)、地點(陸上、海上)和服務(建造、維護/檢修、退役)進行細分。市場規模和預測均以美元計價。
中國油氣市場趨勢與洞察
促進能源安全和強制推行進口替代
中國政府規定原油年產量必須維持在2億噸以上,降低對進口的依賴——目前進口原油佔中國原油需求的73%。中國石油天然氣集團公司(中石油)和中國石化已從政策性銀行獲得低利率貸款用於加密鑽井,而中國海洋石油總公司(中海油)正在加快海上探勘,以實現蘊藏量多元化。擴大戰略石油儲備保障了國內供應,而在地採購要求則促進了國產鑽機、泵浦和海底供應連系管的採購。石化企業正在增加國產石腦油和乙烷的下料契約,以確保在汽油銷售保持平穩的情況下,基準消費量也能得到保障。這些措施共同構成了“安全溢價”,保護中國油氣市場免受價格衝擊。
透過「雙循環」策略滿足對石化原料的需求
中國經濟負責人正大力投資興建綜合煉油廠和化工複合體,將更多原油轉化為芳烴和烯烴,從而提振除運輸燃料以外的其他碳氫化合物需求。中國海洋石油總公司(中海油)大溪島工廠的維修使原油加工能力提高了50%,化工產品收率加倍,同時,廣東和江蘇兩省的設備也在進行升級改造。預計2024年,國內乙烯產量將增加12%,以吸收內陸盆地過剩的冷凝油和液化石油氣供應。石化原料合約通常為期五年,為生產商提供可預測的現金流,並在能源轉型變革時期穩定中國的油氣市場。
對頂級企業徵收過高的利息稅
分級課稅制度正在侵蝕高油價週期中的超額利潤,並壓縮中國石油天然氣集團公司(中石油)、中國石化和中國海洋石油總公司(中海油)的再投資預算。經營團隊優先開發投資回報更快的核心區塊,並推遲獲利能力較低的邊緣油井的開發。同時,二氧化碳捕集與儲存(CCS)領域的支出也在增加,加劇了現金流壓力,並略微抑制了中國油氣市場的擴張。
細分市場分析
到2025年,上游產業將佔中國油氣市場佔有率的70.88%,這主要得益於國家在渤海、南海和鄂爾多斯地區大力探勘。同時,預計到2031年,下游產業將以5.44%的複合年成長率推動市場成長。綜合性領導企業正利用人工智慧驅動的地震反演分析技術,將探勘週期縮短20%,進而進一步鞏固在上游產業的領先地位。
上游投資主要集中在儲存管理工具上,旨在提高成熟礦區的採收率。生產井碳捕集試點計畫透過將二氧化碳儲存在枯竭地層中,即使在更嚴格的排放法規下也能提高產量。在下游領域,儘管隨著電動車的興起,汽油裂解價差正在縮小,但芳烴利潤率依然強勁,這提高了煉油廠的運轉率,並支撐了對上游化工產品的需求。
其他好處
- Excel格式的市場預測(ME)表
- 3個月的分析師支持
目錄
第1章:引言
- 研究假設和市場定義
- 調查範圍
第2章:調查方法
第3章執行摘要
第4章 市場狀況
- 市場概覽
- 市場動態
- 促進因素
- 促進能源安全和進口替代政策
- 透過「雙循環策略」對石化原料的需求
- 四川省和重慶市頁岩氣商業化
- 擴大全國管線網路運輸能力(中國管網)
- 煉油廠維修以適應碳捕獲與封存技術(到2060年實現淨零排放的措施)
- 人工智慧驅動的油氣探勘開發最佳化可降低成熟盆地的採礦成本。
- 抑制因子
- 對上游產業大型企業徵收過高的利息稅
- 嚴格的甲烷排放法規(2025年行動計畫)
- 加速道路運輸電氣化進程
- 塔里木和鄂爾多斯地區因水資源短缺而對水力壓裂法實施的限制
- 促進因素
- 供應鏈分析
- 監理情勢
- 技術展望
- 原油生產與消費展望
- 天然氣生產與消費展望
- 管道設置容量分析
- 非常規資源(緻密油、油砂、深海油田)的資本投資前景
- 波特五力模型
- PESTLE分析
第5章 市場規模與成長預測
- 部門
- 上游部門
- 中游產業
- 下游產業
- 地點
- 陸上
- 離岸
- 按服務
- 建造
- 保守黨的轉變
- 退休
第6章 競爭情勢
- 市場集中度
- 策略趨勢(併購、聯盟、購電協議)
- 市場佔有率分析(主要公司的市場排名和佔有率)
- 公司簡介
- China National Petroleum Corporation(CNPC)
- China Petroleum & Chemical Corporation(Sinopec)
- China National Offshore Oil Corporation(CNOOC)
- PipeChina(China Oil & Gas Pipeline Network Corp)
- Sinochem Holdings
- Shaanxi Yanchang Petroleum Group
- Yanchang Petroleum International Ltd
- PetroChina Company Ltd
- China Gas Holdings
- ENN Energy Holdings
- China Resources Gas
- ExxonMobil Corp
- Chevron Corp
- BP plc
- Shell plc
- TotalEnergies SE
- QatarEnergy
- Rosneft PJSC
- Gazprom PJSC
- Equinor ASA
第7章 市場機會與未來展望
According to Mordor Intelligence, China oil and gas market size in 2026 is estimated at USD 114.21 billion, growing from 2025 value of USD 108.62 billion with 2031 projections showing USD 146.75 billion, growing at 5.15% CAGR over 2026-2031.
This report is Segmented by Sector (Upstream, Midstream, and Downstream), Location (Onshore and Offshore), and Service (Construction, Maintenance and Turn-Around, and Decommissioning). The Market Sizes and Forecasts are Provided in Terms of Value (USD).
China Oil And Gas Market Trends and Insights
Energy-security Push & Import-Substitution Mandates
Beijing requires crude oil output to remain above 200 million tons per year, thereby reducing reliance on imports, which currently account for 73% of demand. CNPC and Sinopec secure low-cost policy-bank financing for infill drilling, while CNOOC accelerates offshore exploration to diversify reserves. A larger strategic petroleum reserve insulates domestic supply, and mandated local-content rules spur procurement of Chinese-made rigs, pumps, and subsea umbilicals. Petrochemical producers increase off-take contracts for domestic naphtha and ethane, locking in baseline consumption even as gasoline sales flatten. Together, these policies underpin a security premium that cushions the Chinese oil and gas market against price shocks.
Petrochemical Feedstock Demand from Dual-Circulation Strategy
China's economic planners channel investment into integrated refinery-chemical complexes that convert more barrels of crude oil into aromatics and olefins, thereby boosting hydrocarbon demand beyond transport fuels. CNOOC's Daxie Island revamp lifts crude-run capacity 50% and doubles chemical yield, mirroring upgrades in Guangdong and Jiangsu. Domestic ethylene output climbed 12% in 2024, absorbing extra condensate and LPG flows from inland basins. Petrochemical feedstock contracts typically have five-year tenures, providing producers with predictable cash flow and anchoring the Chinese oil and gas market during shifts in the energy transition.
Windfall-Profit Tax on Upstream Majors
A tiered levy skims exceptional earnings during high-price cycles, trimming reinvestment budgets at CNPC, Sinopec, and CNOOC. Management prioritises core blocks with quick payback and delays marginal frontier wells. The tax coincides with rising CCS outlays, intensifying cash-flow pressure, and slightly tempering expansion inside the Chinese oil and gas market.
Other drivers and restraints analyzed in the detailed report include:
- Shale-Gas Commercialisation in Sichuan & Chongqing
- National Pipeline Network (PipeChina) Capacity Expansion
- Stringent Methane-Emission Regulations (2025 Action Plan)
For complete list of drivers and restraints, kindly check the Table Of Contents.
Segment Analysis
Upstream activities accounted for 70.88% of China's oil and gas market share in 2025, underpinned by aggressive state-funded exploration in the Bohai, South China Sea, and Ordos regions. Meanwhile, the downstream sector is projected to drive market growth with a CAGR of 5.44% through 2031. Integrated majors utilize AI-assisted seismic inversion, reducing exploration cycle times by 20% and reinforcing their upstream preeminence.
Upstream spend focuses on reservoir management tools that enhance recovery factors in mature blocks. Carbon-capture pilots in producing wells store CO2 in depleted formations, allowing incremental barrels under stricter emission norms. Although downstream gasoline cracks narrow with EV adoption, aromatics margins remain firm, propelling refinery utilization and sustaining chemical demand that ripples upstream.
Complete Report Scope:
- By Sector
- Upstream
- Midstream
- Downstream
- By Location
- Onshore
- Offshore
- By Service
- Construction
- Maintenance and Turn-around
- Decommissioning
List of Companies Covered in this Report:
- China National Petroleum Corporation (CNPC)
- China Petroleum & Chemical Corporation (Sinopec)
- China National Offshore Oil Corporation (CNOOC)
- PipeChina (China Oil & Gas Pipeline Network Corp)
- Sinochem Holdings
- Shaanxi Yanchang Petroleum Group
- Yanchang Petroleum International Ltd
- PetroChina Company Ltd
- China Gas Holdings
- ENN Energy Holdings
- China Resources Gas
- ExxonMobil Corp
- Chevron Corp
- BP plc
- Shell plc
- TotalEnergies SE
- QatarEnergy
- Rosneft PJSC
- Gazprom PJSC
- Equinor ASA
Additional Benefits:
- The market estimate (ME) sheet in Excel format
- 3 months of analyst support
TABLE OF CONTENTS
1 Introduction
- 1.1 Study Assumptions & Market Definition
- 1.2 Scope of the Study
2 Research Methodology
3 Executive Summary
4 Market Landscape
- 4.1 Market Overview
- 4.2 Market Dynamics
- 4.2.1 Drivers
- 4.2.1.1 Energy-security push & import-substitution mandates
- 4.2.1.2 Petrochemical feedstock demand from dual-circulation strategy
- 4.2.1.3 Shale-gas commercialisation in Sichuan & Chongqing
- 4.2.1.4 National pipeline network (PipeChina) capacity expansion
- 4.2.1.5 CCS-ready refinery upgrades (Net-zero 2060 compliance)
- 4.2.1.6 AI-optimised E&P to lower lifting costs in mature basins
- 4.2.2 Restraints
- 4.2.2.1 Windfall-profit tax on upstream majors
- 4.2.2.2 Stringent methane-emission regulations (2025 action plan)
- 4.2.2.3 Accelerated electrification of road transport
- 4.2.2.4 Water-stress limits on fracking in Tarim & Ordos
- 4.2.1 Drivers
- 4.3 Supply-Chain Analysis
- 4.4 Regulatory Landscape
- 4.5 Technological Outlook
- 4.6 Crude-Oil Production & Consumption Outlook
- 4.7 Natural-Gas Production & Consumption Outlook
- 4.8 Installed Pipeline Capacity Analysis
- 4.9 Unconventional Resources CAPEX Outlook (tight oil, oil sands, deep-water)
- 4.10 Porter's Five Forces
- 4.10.1 Threat of New Entrants
- 4.10.2 Bargaining Power of Suppliers
- 4.10.3 Bargaining Power of Buyers
- 4.10.4 Threat of Substitutes
- 4.10.5 Competitive Rivalry
- 4.11 PESTLE Analysis
5 Market Size & Growth Forecasts
- 5.1 By Sector
- 5.1.1 Upstream
- 5.1.2 Midstream
- 5.1.3 Downstream
- 5.2 By Location
- 5.2.1 Onshore
- 5.2.2 Offshore
- 5.3 By Service
- 5.3.1 Construction
- 5.3.2 Maintenance and Turn-around
- 5.3.3 Decommissioning
6 Competitive Landscape
- 6.1 Market Concentration
- 6.2 Strategic Moves (M&A, Partnerships, PPAs)
- 6.3 Market Share Analysis (Market Rank/Share for key companies)
- 6.4 Company Profiles (includes Global level Overview, Market level overview, Core Segments, Financials as available, Strategic Information, Products & Services, and Recent Developments)
- 6.4.1 China National Petroleum Corporation (CNPC)
- 6.4.2 China Petroleum & Chemical Corporation (Sinopec)
- 6.4.3 China National Offshore Oil Corporation (CNOOC)
- 6.4.4 PipeChina (China Oil & Gas Pipeline Network Corp)
- 6.4.5 Sinochem Holdings
- 6.4.6 Shaanxi Yanchang Petroleum Group
- 6.4.7 Yanchang Petroleum International Ltd
- 6.4.8 PetroChina Company Ltd
- 6.4.9 China Gas Holdings
- 6.4.10 ENN Energy Holdings
- 6.4.11 China Resources Gas
- 6.4.12 ExxonMobil Corp
- 6.4.13 Chevron Corp
- 6.4.14 BP plc
- 6.4.15 Shell plc
- 6.4.16 TotalEnergies SE
- 6.4.17 QatarEnergy
- 6.4.18 Rosneft PJSC
- 6.4.19 Gazprom PJSC
- 6.4.20 Equinor ASA
7 Market Opportunities & Future Outlook
- 7.1 White-space & Unmet-Need Assessment

 義大利石油和天然氣:市場佔有率分析、行業趨勢和統計數據以及成長預測(2026-2031 年)英國石油與天然氣:市場佔有率分析、產業趨勢與統計、成長預測(2026-2031)馬來西亞油氣:市場佔有率分析、產業趨勢與統計及成長預測(2026-2031)印尼油氣市場:市場佔有率分析、產業趨勢與統計及成長預測(2026-2031年)東南亞油氣市場:市場佔有率分析、產業趨勢與統計及成長預測(2026-2031年)美國石油和天然氣:市場佔有率分析、行業趨勢和統計數據以及成長預測(2026-2031 年)印度石油和天然氣:市場佔有率分析、行業趨勢和統計數據以及成長預測(2026-2031 年)
 2026年全球油氣管道及相關結構建設市場報告
 石油和天然氣市場規模、佔有率和成長分析(按產品類型、產業類型、部署類型、應用和地區分類)-2026-2033年產業預測越南石油天然氣:市場佔有率分析、產業趨勢與統計、成長預測(2026-2031年)