


 |
市場調查報告書
商品編碼
2120717
美國可再生能源:市場佔有率分析、行業趨勢和統計數據以及成長預測(2026-2031 年)United States Renewable Energy - Market Share Analysis, Industry Trends & Statistics, Growth Forecasts (2026 - 2031) |
||||||

※ 本網頁內容可能與最新版本有所差異。詳細情況請與我們聯繫。
2025 年美國可再生能源市場價值為 507.67 吉瓦,預計到 2031 年將達到 778.78 吉瓦,而 2026 年為 545.16 吉瓦,在預測期(2026-2031 年)內複合年成長率為 7.38%。
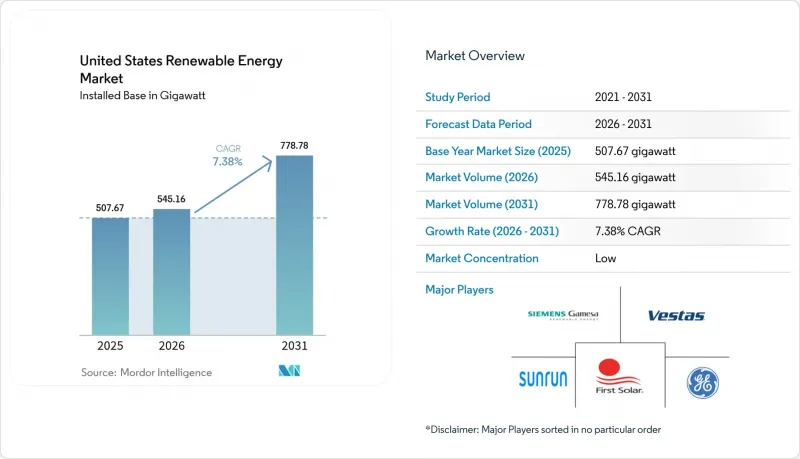
本報告按技術(太陽能、風能、水力發電、生質能源、地熱能和海洋能)和最終用戶(公共產業、商業和工業以及住宅)進行細分。市場規模和預測以裝置容量(吉瓦)為單位。
美國可再生能源市場的趨勢與洞察
聯邦政府延長投資稅額扣抵和生產稅額扣抵
由於太陽能發電30%的投資稅額扣抵和風能發電每兆瓦時26美元的生產稅額扣抵已落實至2032年,美國可再生能源市場正穩步擴張,避免重蹈以往繁榮與蕭條週期的覆轍。基於國內採購率的獎勵措施已有效提高了稅額扣抵率10個百分點,並已促成美國太陽能板產量在2024年成長40%。高達每瓦0.07美元的多層級太陽能電池製造稅額扣抵進一步改善了專案的經濟效益,並透過鼓勵在傳統工業州建立新工廠,擴大了美國可再生能源市場稅基的受益範圍。
太陽能和風能的平準化度電成本快速下降
到2024年,公用事業規模的太陽能發電成本將達到每千瓦時0.048美元,陸域風電成本將達到每千瓦時0.033美元,兩者均低於未享受補貼的聯合循環燃氣發電價格。更大的渦輪機、高密度電池結構和最佳化的供應鏈正在降低資本成本,而儲能系統的引入則使得將波動的電力輸出轉化為可調節的電力成為可能。企業買家將這些價格下降視為石化燃料價格波動風險的有效手段,這促進了美國可再生能源市場的專案儲備,並為投資者創造了可預測的回報來源。
電力傳輸瓶頸和電網連接延遲
到2024年,併網申請積壓量達到2.6太瓦,是2020年的四倍,導致計畫實施延遲四到五年。儘管聯邦能源監管委員會(FERC)2023號指令對叢集調查和商業性可行性審查做出了規定,但大多數積壓申請仍需要進行電網升級,每兆瓦的成本超過100萬美元。在風能資源豐富的大平原地區,由於缺乏通往負載中心的輸電線路,發展受到阻礙,導致美國市場新增可再生能源裝置容量短期內受到限制。
細分市場分析
預計到2025年,太陽能發電技術將占美國可再生能源市場佔有率的40.80%,並預計在2031年之前以12.05%的複合年成長率實現最快成長。 85%的新建公用事業規模太陽能發電裝置都配備了儲能系統,將白天的發電量轉換為滿足高峰需求的容量,從而提高獲利能力。農光互補技術將作物生產與太陽能發電結合,在提高農場盈利的同時,也緩解了土地資源的限制。風能仍然是許多能源組合的核心組成部分,隨著塔架高度和轉子尺寸的增加,風力發電的適用範圍也不斷擴大。離岸風力發電正透過聯邦租賃競標和州級公共招標(總計15吉瓦)獲得發展動力。水力發電和地熱雖然能提供可靠的發電能力,但由於資源限制和初始成本較高,其普及速度相對較慢。在決定技術配置時,除了每千瓦時的價格之外,電網服務的價值現在也被考慮在內,美國可再生能源市場的投資邏輯正在重組。
在美國可再生能源市場規模中,預計到2031年,太陽能發電裝置容量將達到326.4吉瓦,而隨著區域電網的發展,陸上風電裝置容量預計將擴大至253.1吉瓦。諸如增強型地熱系統和海洋能等新興資源目前部署小規模,但先導計畫表明,如果成本得到最佳化,它們具有擴充性。總體而言,隨著主要州可再生能源滲透率超過50%,技術多元化正在緩解天氣對發電量的影響,並提高供電可靠性。
其他好處:
- Excel格式的市場預測(ME)表
- 3個月的分析師支持
目錄
第1章:引言
- 研究假設和市場定義
- 調查範圍
第2章:調查方法
第3章執行摘要
第4章 市場狀況
- 市場概覽
- 市場促進因素
- 延長聯邦投資稅額扣抵和生產稅額扣抵
- 太陽能和風能的平準化度電成本快速下降
- 公司淨零排放及RE100採購目標
- 製造業復甦趨勢得益於“通膨控制法”
- 能夠提高可再生能源採用率的電網加固技術。
- 市場限制因素
- 電力傳輸瓶頸和電網連接延遲
- 渦輪機和麵板產品的價格波動
- 當地社區反對大型發電工程
- 供應鏈分析
- 監理展望
- 技術展望
- 波特五力模型
- PESTLE分析
第5章 市場規模與成長預測
- 透過技術
- 太陽能(光伏發電和聚光型太陽熱能發電)
- 風力發電(陸上和海上)
- 水力發電(小規模、大型、抽水蓄能)
- 生質能源
- 地熱
- 海洋能源(潮汐能和波浪能)
- 最終用戶
- 公用事業
- 商業和工業用途
- 住宅
第6章 競爭情勢
- 市場集中度
- 策略性措施(併購、合資、資金籌措、購電協議)
- 市場佔有率分析(主要公司的市場排名和佔有率)
- 公司簡介
- NextEra Energy, Inc.
- Invenergy LLC
- Orsted US Offshore Wind
- General Electric Company
- Vestas Wind Systems A/S
- First Solar, Inc.
- Canadian Solar Inc.
- Sunrun Inc.
- Enphase Energy, Inc.
- Siemens Gamesa Renewable Energy SA
- Brookfield Renewable Partners LP
- Pattern Energy Group LP
- AES Clean Energy
- Dominion Energy, Inc.
- Duke Energy Renewables
- EDF Renewables North America
- EDP Renewables North America LLC
- Clearway Energy Group LLC
- Mitsubishi Power Americas, Inc.
- Trina Solar Co., Ltd.
第7章 市場機會與未來展望
According to Mordor Intelligence, the United States renewable energy market size was valued at 507.67 gigawatt in 2025 and estimated to grow from 545.16 gigawatt in 2026 to reach 778.78 gigawatt by 2031, at a CAGR of 7.38% during the forecast period (2026-2031).
This report is Segmented by Technology (Solar Energy, Wind Energy, Hydropower, Bioenergy, Geothermal, and Ocean Energy) and End-User (Utilities, Commercial and Industrial, and Residential). The Market Sizes and Forecasts are Provided in Terms of Installed Capacity (GW).
United States Renewable Energy Market Trends and Insights
Extension of Federal Investment & Production Tax Credits
Long-term certainty through 2032 for the 30% investment tax credit on solar and USD 26 per MWh production tax credit for wind keeps the US renewable energy market on a steady build schedule, avoiding the historical boom-bust pattern.Domestic-content bonuses lift effective credits by 10 percentage points and have already encouraged a 40% increase in US solar panel output during 2024. Layered manufacturing credits, worth up to USD 0.07 per watt for solar cells, further improve project economics and anchor new factories in traditional industrial states, broadening the tax base benefits of the US renewable energy market.
Rapid Decline in Solar-PV & Wind LCOE
Utility-scale solar reached USD 0.048 per kWh and onshore wind USD 0.033 per kWh in 2024, both undercutting combined-cycle gas prices without subsidies. Larger turbines, high-density cell architectures, and supply-chain optimization compress capital costs, while energy storage attachments convert variable output into dispatchable power. Corporate buyers treat these falling prices as a hedge against fossil-fuel volatility, adding momentum to the US renewable energy market's project pipeline and creating predictable revenue streams for investors.
Transmission Bottlenecks & Interconnection Queues
The interconnection backlog hit 2.6 TW by 2024, quadrupling 2020 levels and delaying projects by 4-5 years. Although FERC Order 2023 imposes cluster-study rules and commercial readiness screens, most pending applications still face network upgrades valued at more than USD 1 million per MW. The Great Plains, rich in wind, sees development stymied without conduits to load centers, resulting in trimmed near-term additions in the US renewable energy market.
Other drivers and restraints analyzed in the detailed report include:
- Corporate Net-Zero & RE100 Procurement Targets
- Inflation Reduction Act-linked Manufacturing Upswing
- Volatility in Commodity Prices for Turbines & Panels
For complete list of drivers and restraints, kindly check the Table Of Contents.
Segment Analysis
Solar technology accounted for 40.80% of the US renewable energy market share in 2025 and is projected to grow at the fastest rate, with a 12.05% CAGR, to 2031. Pairing with batteries means that 85% of new utility solar installations include storage, turning midday generation into peaking capacity and raising revenue certainty. Agrivoltaics blends crop production and photovoltaics, easing land constraints while improving farmer economics. Wind still anchors many portfolios and benefits from taller towers and larger rotors that expand viable terrain. Offshore wind gains momentum through federal lease auctions and state solicitations totaling 15 GW. Hydropower and geothermal energy offer dependable capacity, yet resource limitations and higher upfront costs slow their relative advancement. Technology mix decisions now reflect grid-service value in addition to kilowatt-hour prices, reshaping investment logic inside the US renewable energy market.
The US renewable energy market size for solar alone is expected to reach 326.4 GW by 2031, while onshore wind is projected to expand to 253.1 GW amid regional transmission upgrades. Emerging resources, such as enhanced geothermal systems and marine energy, exhibit modest baselines, but pilot projects reveal scalability once costs are optimized. In aggregate, technology diversification cushions weather-related output swings and strengthens reliability as penetration rises beyond 50% in leading states.
Complete Report Scope:
- By Technology
- Solar Energy (PV and CSP)
- Wind Energy (Onshore and Offshore)
- Hydropower (Small, Large, PSH)
- Bioenergy
- Geothermal
- Ocean Energy (Tidal and Wave)
- By End-User
- Utilities
- Commercial and Industrial
- Residential
List of Companies Covered in this Report:
- NextEra Energy, Inc.
- Invenergy LLC
- Orsted US Offshore Wind
- General Electric Company
- Vestas Wind Systems A/S
- First Solar, Inc.
- Canadian Solar Inc.
- Sunrun Inc.
- Enphase Energy, Inc.
- Siemens Gamesa Renewable Energy S.A.
- Brookfield Renewable Partners L.P.
- Pattern Energy Group LP
- AES Clean Energy
- Dominion Energy, Inc.
- Duke Energy Renewables
- EDF Renewables North America
- EDP Renewables North America LLC
- Clearway Energy Group LLC
- Mitsubishi Power Americas, Inc.
- Trina Solar Co., Ltd.
Additional Benefits:
- The market estimate (ME) sheet in Excel format
- 3 months of analyst support
TABLE OF CONTENTS
1 Introduction
- 1.1 Study Assumptions & Market Definition
- 1.2 Scope of the Study
2 Research Methodology
3 Executive Summary
4 Market Landscape
- 4.1 Market Overview
- 4.2 Market Drivers
- 4.2.1 Extension of Federal Investment & Production Tax Credits
- 4.2.2 Rapid Decline in Solar-PV & Wind LCOE
- 4.2.3 Corporate Net-Zero & RE100 Procurement Targets
- 4.2.4 Inflation Reduction Act-linked Manufacturing Upswing
- 4.2.5 Grid-enhancing Technologies enabling higher renewable penetration
- 4.3 Market Restraints
- 4.3.1 Transmission Bottlenecks & Interconnection Queues
- 4.3.2 Volatility in Commodity Prices for Turbines & Panels
- 4.3.3 Community Opposition to Utility-Scale Projects
- 4.4 Supply-Chain Analysis
- 4.5 Regulatory Outlook
- 4.6 Technological Outlook
- 4.7 Porters Five Forces
- 4.7.1 Threat of New Entrants
- 4.7.2 Bargaining Power of Suppliers
- 4.7.3 Bargaining Power of Buyers
- 4.7.4 Threat of Substitutes
- 4.7.5 Competitive Rivalry
- 4.8 PESTLE Analysis
5 Market Size & Growth Forecasts
- 5.1 By Technology
- 5.1.1 Solar Energy (PV and CSP)
- 5.1.2 Wind Energy (Onshore and Offshore)
- 5.1.3 Hydropower (Small, Large, PSH)
- 5.1.4 Bioenergy
- 5.1.5 Geothermal
- 5.1.6 Ocean Energy (Tidal and Wave)
- 5.2 By End-User
- 5.2.1 Utilities
- 5.2.2 Commercial and Industrial
- 5.2.3 Residential
6 Competitive Landscape
- 6.1 Market Concentration
- 6.2 Strategic Moves (M&A, JVs, Funding, PPAs)
- 6.3 Market Share Analysis (Market Rank/Share for key companies)
- 6.4 Company Profiles (includes Global-level Overview, Market-level Overview, Core Segments, Financials, Strategic Information, Products & Services, Recent Developments)
- 6.4.1 NextEra Energy, Inc.
- 6.4.2 Invenergy LLC
- 6.4.3 Orsted US Offshore Wind
- 6.4.4 General Electric Company
- 6.4.5 Vestas Wind Systems A/S
- 6.4.6 First Solar, Inc.
- 6.4.7 Canadian Solar Inc.
- 6.4.8 Sunrun Inc.
- 6.4.9 Enphase Energy, Inc.
- 6.4.10 Siemens Gamesa Renewable Energy S.A.
- 6.4.11 Brookfield Renewable Partners L.P.
- 6.4.12 Pattern Energy Group LP
- 6.4.13 AES Clean Energy
- 6.4.14 Dominion Energy, Inc.
- 6.4.15 Duke Energy Renewables
- 6.4.16 EDF Renewables North America
- 6.4.17 EDP Renewables North America LLC
- 6.4.18 Clearway Energy Group LLC
- 6.4.19 Mitsubishi Power Americas, Inc.
- 6.4.20 Trina Solar Co., Ltd.
7 Market Opportunities & Future Outlook
- 7.1 White-space & Unmet-Need Assessment

 2026年全球油氣市場可再生能源整合報告
 全球可再生能源市場規模、佔有率、趨勢和成長分析報告(2026-2034年)
 可再生能源市場預測至2034年—按能源來源、裝置容量、部署狀況、應用、最終用戶和地區分類的全球分析全球太陽能上吸式塔市場規模、佔有率、趨勢和成長分析報告(2026-2034年)
 歐洲可再生能源:市場佔有率分析、產業趨勢與統計及成長預測(2026-2031 年)非洲可再生能源:市場佔有率分析、產業趨勢與統計及成長預測(2026-2031 年)中東可再生能源:市場佔有率分析、產業趨勢與統計及成長預測(2026-2031 年)南美洲可再生能源:市場佔有率分析、產業趨勢與統計及成長預測(2026-2031 年)南部非洲可再生能源:市場佔有率分析、產業趨勢與統計及成長預測(2026-2031 年)東南亞可再生能源:市場佔有率分析、產業趨勢與統計及成長預測(2026-2031年)