


 |
市場調查報告書
商品編碼
2116779
非洲可再生能源:市場佔有率分析、產業趨勢與統計及成長預測(2026-2031 年)Africa Renewable Energy - Market Share Analysis, Industry Trends & Statistics, Growth Forecasts (2026 - 2031) |
||||||

※ 本網頁內容可能與最新版本有所差異。詳細情況請與我們聯繫。
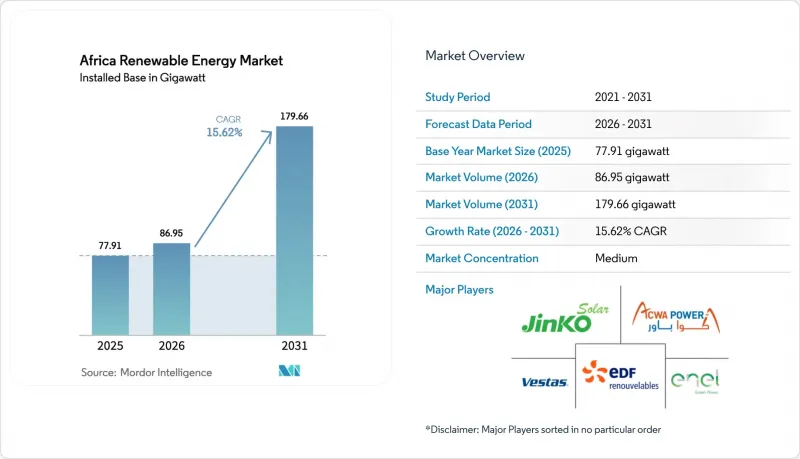
據 Mordor Intelligence 稱,非洲可再生能源市場規模(按裝置容量計算)預計將從 2025 年的 77.91 吉瓦和 2026 年的 86.95 吉瓦擴大到 2031 年的 179.66 吉瓦,2026 年吉瓦擴大到 2031 年的 179.66 吉瓦,2026 年至 2031 年的複合成長率為 20315.62%。
本報告按技術(太陽能、風能、水力、生質能源能、地熱能和海洋能)、最終用戶(公共產業、商業和工業以及住宅)和地區(南非、埃及、奈及利亞、摩洛哥、阿爾及利亞、衣索比亞、肯亞、加納和其他非洲國家)進行細分。市場規模和預測均以裝置容量(GW)為基礎。
非洲可再生能源市場的趨勢與洞察
太陽能發電(PV)資本支出(CAPEX)快速下降
到2025年,埃及和摩洛哥的大規模太陽能發電競標已降至每千瓦時0.03美元以下,比新建煤氣發電項目便宜40%以上。全球多晶矽供應過剩和需求疲軟共同推動組件價格在2026年初降至每瓦0.12美元。在南非的「第七輪競標窗口」中,2.6吉瓦的太陽能發電計畫以平均每千瓦時0.025美元的價格中標,比10年前的首次競標價格下降了60%。在阿爾及利亞,1吉瓦的太陽能發電競標拍賣價格上限為每千瓦時0.028美元,證實了太陽能發電與4小時鋰離子儲能系統結合時,是成本最低的基本負載電源。這些經濟因素使得簽訂20年固定價格購電協議(PPA)成為可能,從而固定了多邊金融機構的貸款期限,並幫助非洲可再生能源市場克服外匯風險的障礙。
南非大型風發電工程管線擴建
南非的風電工程儲備將於2024年達到48吉瓦,其中大部分集中在北開普省和東開普省,這兩個省的運轉率超過40%。在競標,總合的風電項目,商業運營啟動日期將分階段設定,直至2029年,以便於併入電網。由於Eskom每年只能吸收2吉瓦的可變可再生能源而不造成電壓異常,因此不得不使用現場電池儲能並管理限電措施。維斯塔斯透過在當地組裝機艙來滿足國內採購要求並降低物流成本,從而獲得了1.2吉瓦的風機訂單。同時,肯亞的310兆瓦圖爾卡納湖風電場表明,即使是輸電距離達400公里的偏遠項目,也能維持1.4以上的負債權益比。
電網穩定性差,有限電風險
2024年,由於一座柔軟性的燃煤發電廠無法應付太陽能發電高峰和夜間強風,南非國家電力公司(Eskom)削減了4,363吉瓦時的可再生能源發電,佔其總發電量的12%。 2025年,由於洛揚加拉尼-蘇斯瓦輸電線路的電壓波動,肯亞電網營運商限制了塔卡納湖風電場18%的發電時間。 2024年,埃及本班太陽能園區的部分區域因頻率超出49.8-50.2赫茲範圍而與電網斷開200小時。此類事件導致專案容量利用率低於銀行預期,進而需要重新協商貸款條款。南非2025年的電網法規要求新計畫必須安裝兩小時的儲能設施。這將使每千瓦的額外成本增加 300 美元,但會降低限電風險,並增強非洲可再生能源市場的風險狀況。
細分市場分析
太陽能發電是成長最快的技術,預計2026年至2031年複合年成長率將達到27.84%。同時,水力發電在2025年佔據非洲可再生能源市場的主導地位,佔比高達62.25%。埃及1.8吉瓦的本班(Benban)叢集和500兆瓦的科姆翁布(Kom Ombo)計畫表明,在太陽輻射強度超過2500千瓦時/平方公尺的沙漠地區,無需使用追蹤器即可實現28%的容量利用率。摩洛哥的努爾(Noor)綜合體將580兆瓦的聚光型太陽熱能發電與熔鹽儲熱系統結合,實現了7小時的可調功率,使其能夠獲得比純光伏發電更高的溢價。風力發電受惠於南非48吉瓦的發展計畫和肯亞成熟的高運轉率電場,但離岸風力發電計畫仍處於初步可行性研究階段。隨著採購配額擴大、組件價格下降和電池成本降低,預計到 2029 年,非洲可再生能源市場(包括風能和太陽能)將超過水力發電。
正如停滯不前的800億美元英加大壩計畫所表明的那樣,隨著大型水壩建設計畫因社會反對而受阻,水力發電的佔有率預計將逐漸下降。由於搬遷居民的負擔相對較小,河流式水力和抽水蓄能水力發電正獲得越來越多的支持。肯亞在地熱發電領域處於領先地位,奧爾卡里亞地熱電站已運作985兆瓦,另有83兆瓦機組計畫於2024年投入運作。肯亞正利用東非大裂谷的地質特徵來提供基本負載電力。雖然生質能源和海洋能源的試點計畫規模仍然小規模,但南非的城市垃圾發電計畫表明,非洲可再生能源市場的技術組合正在逐步多元化。
其他好處:
- Excel格式的市場預測(ME)表
- 3個月的分析師支持
目錄
第1章:引言
- 研究假設和市場定義
- 調查範圍
第2章:調查方法
第3章執行摘要
第4章 市場狀況
- 市場概覽
- 市場促進因素
- 太陽能發電資本支出(CAPEX)大幅下降。
- 加速南非公用事業規模風發電工程規劃
- 由DFI提供優惠資金支持的微電網項目
- 新興的綠色氫能出口中心
- 礦業公司之間購電協議(PPA)數量增加
- 擴大與氣候變遷因應措施一致的混合融資平台
- 市場限制因素
- 電網穩定性下降和發電受限的風險。
- 獨立發電業者的貨幣兌換限制
- 政府對購電合約的擔保出現延誤
- 出於社會和環境原因,人們對大型水力發電發電工程日益反對。
- 供應鏈分析
- 監理情勢
- 技術展望
- 波特五力模型
第5章 市場規模與成長預測
- 透過技術
- 太陽能(光伏和聚光太陽能)
- 風力發電(陸上和海上)
- 水力發電(小規模、大型、抽水蓄能)
- 生質能源
- 地熱
- 海洋能源(潮汐能和波浪能)
- 最終用戶
- 公用事業
- 商業和工業用途
- 住宅
- 按地區
- 南非
- 埃及
- 奈及利亞
- 摩洛哥
- 阿爾及利亞
- 衣索比亞
- 肯亞
- 迦納
- 其他非洲國家
第6章 競爭情勢
- 市場集中度
- 策略性措施(併購、合資、資金籌措、購電協議)
- 市場佔有率分析(主要公司的市場排名和佔有率)
- 公司簡介
- Vestas Wind Systems A/S
- Juwi Holding AG
- ACWA Power
- Enel Green Power SpA
- EDF Renewables
- Acciona SA
- JinkoSolar Holding Co. Ltd
- Canadian Solar Inc.
- First Solar Inc.
- Hidroelectrica de Cahora Bassa SA
- Scatec ASA
- Mainstream Renewable Power
- Siemens Gamesa Renewable Energy
- BTE Renewable
- Orsted A/S
- TotalEnergies Renewables
- Masdar Clean Energy
- ENGIE Africa
- Globeleq
- Abengoa Solar
第7章 市場機會與未來展望
According to Mordor Intelligence, the Africa renewable energy market size in terms of installed base is projected to expand from 77.91 gigawatt in 2025 and 86.95 gigawatt in 2026 to 179.66 gigawatt by 2031, registering a CAGR of 15.62% between 2026 to 2031.
This report is Segmented by Technology (Solar Energy, Wind Energy, Hydropower, Bioenergy, Geothermal, and Ocean Energy), End-User (Utilities, Commercial and Industrial, and Residential), and Geography (South Africa, Egypt, Nigeria, Morocco, Algeria, Ethiopia, Kenya, Ghana, and Rest of Africa). The Market Sizes and Forecasts are Provided in Terms of Installed Capacity (GW).
Africa Renewable Energy Market Trends and Insights
Rapid Decline in Solar PV CAPEX
Auction tariffs for utility-scale solar dropped below USD 0.03 per kWh in Egypt and Morocco during 2025, undercutting new coal and gas by more than 40%. Module prices fell to USD 0.12 per watt in early 2026 as global polysilicon oversupply met tepid demand. Bid Window 7 in South Africa cleared 2.6 GW at an average USD 0.025 per kWh, a 60% reduction from the inaugural round ten years earlier. Algeria's 1 GW solar tender set a ceiling price of USD 0.028 per kWh, confirming photovoltaics as the least-cost baseload option when paired with four-hour lithium-ion storage. These economics allow 20-year fixed-price PPAs, locking in debt tenors from multilateral lenders and helping the Africa renewable energy market overcome currency-risk hurdles.
Utility-Scale Wind Project Pipeline Acceleration in South Africa
South Africa's wind queue reached 48 GW in 2024, clustered in the Northern and Eastern Capes, where capacity factors top 40%. Bid Windows 5-7 collectively awarded 5.3 GW with commercial operation dates sequenced to 2029 to ease grid integration. Eskom can only absorb 2 GW of variable renewables each year without voltage events, forcing co-located batteries or managed curtailment. Vestas captured 1.2 GW of turbine orders by assembling nacelles locally, satisfying domestic-content rules and trimming logistics costs. Kenya's 310 MW Lake Turkana wind farm, meanwhile, proved remote projects can maintain debt-service coverage above 1.4x even when wheeling power 400 km.
Weak Grid Stability & Curtailment Risk
Eskom curtailed 4,363 GWh of renewables in 2024, 12% of total output, due to inflexible coal plants that cannot track solar peaks and evening wind ramps. Kenya's grid operator restricted Lake Turkana's output during 18% of hours in 2025 after voltage excursions on the Loiyangalani-Suswa line. Egypt disconnected sections of the Benban park for 200 hours in 2024 as frequency strayed outside the 49.8-50.2 Hz band. Such events depress project capacity factors below bank-case assumptions, triggering loan renegotiations. South Africa's 2025 Grid Code Amendment now mandates two-hour storage on new projects, adding USD 300 per kW but reducing curtailment exposure and strengthening the Africa renewable energy market's risk profile.
Other drivers and restraints analyzed in the detailed report include:
- Mini-Grid Programs Backed by DFI Concessional Funding
- Emerging Green-Hydrogen Export Hubs
- Currency-Convertibility Limitations for IPPs
For complete list of drivers and restraints, kindly check the Table Of Contents.
Segment Analysis
Solar installations stand out as the fastest-growing technology, with a 27.84% CAGR projected from 2026 to 2031, while hydropower accounted for a dominant 62.25% of the Africa renewable energy market share in 2025. Egypt's 1.8 GW Benban cluster and 500 MW Kom Ombo additions showcase how desert irradiance above 2,500 kWh/m2 enables 28% capacity factors without trackers. Morocco's Noor complex integrates 580 MW of concentrated solar power with molten-salt storage, achieving seven-hour dispatchability that commands a premium over pure PV. Wind benefits from South Africa's 48 GW pipeline and Kenya's proven high-factor sites, yet offshore activity remains limited to pre-feasibility studies. The Africa renewable energy market size for wind and solar combined is forecast to eclipse hydropower by 2029 as procurement windows accelerate, module prices retreat, and battery costs drop.
Hydropower's share will erode gradually as social opposition curtails mega-dam ambitions, exemplified by the stalled USD 80 billion Grand Inga project. Run-of-river and pumped-storage schemes gain favor for their lighter resettlement footprint. Kenya leads geothermal with 985 MW at Olkaria and an 83 MW unit commissioned in 2024, leveraging Rift Valley geology for baseload supply. Bioenergy and ocean-energy pilots remain small, but municipal waste-to-power in South Africa signals a gradual broadening of the Africa renewable energy market technology mix.
Complete Report Scope:
- By Technology
- Solar Energy (PV and CSP)
- Wind Energy (Onshore and Offshore)
- Hydropower (Small, Large, PSH)
- Bioenergy
- Geothermal
- Ocean Energy (Tidal and Wave)
- By End-User
- Utilities
- Commercial and Industrial
- Residential
- By Geography
- South Africa
- Egypt
- Nigeria
- Morocco
- Algeria
- Ethiopia
- Kenya
- Ghana
- Rest of Africa
List of Companies Covered in this Report:
- Vestas Wind Systems A/S
- Juwi Holding AG
- ACWA Power
- Enel Green Power S.p.A.
- EDF Renewables
- Acciona SA
- JinkoSolar Holding Co. Ltd
- Canadian Solar Inc.
- First Solar Inc.
- Hidroelectrica de Cahora Bassa S.A.
- Scatec ASA
- Mainstream Renewable Power
- Siemens Gamesa Renewable Energy
- BTE Renewable
- Orsted A/S
- TotalEnergies Renewables
- Masdar Clean Energy
- ENGIE Africa
- Globeleq
- Abengoa Solar
Additional Benefits:
- The market estimate (ME) sheet in Excel format
- 3 months of analyst support
TABLE OF CONTENTS
1 Introduction
- 1.1 Study Assumptions & Market Definition
- 1.2 Scope of the Study
2 Research Methodology
3 Executive Summary
4 Market Landscape
- 4.1 Market Overview
- 4.2 Market Drivers
- 4.2.1 Rapid decline in solar PV CAPEX
- 4.2.2 Utility-scale wind project pipeline acceleration in South Africa
- 4.2.3 Mini-grid programs backed by DFI concessional funding
- 4.2.4 Emerging green-hydrogen export hubs
- 4.2.5 Growing corporate PPAs from mining companies
- 4.2.6 Expansion of climate-aligned blended-finance platforms
- 4.3 Market Restraints
- 4.3.1 Weak grid stability & curtailment risk
- 4.3.2 Currency-convertibility limitations for IPPs
- 4.3.3 Delays in sovereign guarantees for power-purchase agreements
- 4.3.4 Rising opposition to large hydro projects on social-environment grounds
- 4.4 Supply-Chain Analysis
- 4.5 Regulatory Landscape
- 4.6 Technological Outlook
- 4.7 Porter's Five Forces
- 4.7.1 Bargaining Power of Suppliers
- 4.7.2 Bargaining Power of Consumers
- 4.7.3 Threat of New Entrants
- 4.7.4 Threat of Substitute Products & Services
- 4.7.5 Intensity of Competitive Rivalry
5 Market Size & Growth Forecasts
- 5.1 By Technology
- 5.1.1 Solar Energy (PV and CSP)
- 5.1.2 Wind Energy (Onshore and Offshore)
- 5.1.3 Hydropower (Small, Large, PSH)
- 5.1.4 Bioenergy
- 5.1.5 Geothermal
- 5.1.6 Ocean Energy (Tidal and Wave)
- 5.2 By End-User
- 5.2.1 Utilities
- 5.2.2 Commercial and Industrial
- 5.2.3 Residential
- 5.3 By Geography
- 5.3.1 South Africa
- 5.3.2 Egypt
- 5.3.3 Nigeria
- 5.3.4 Morocco
- 5.3.5 Algeria
- 5.3.6 Ethiopia
- 5.3.7 Kenya
- 5.3.8 Ghana
- 5.3.9 Rest of Africa
6 Competitive Landscape
- 6.1 Market Concentration
- 6.2 Strategic Moves (M&A, JVs, Funding, PPAs)
- 6.3 Market Share Analysis (Market Rank/Share for key companies)
- 6.4 Company Profiles (includes Global-level Overview, Market-level Overview, Core Segments, Financials, Strategic Information, Products & Services, Recent Developments)
- 6.4.1 Vestas Wind Systems A/S
- 6.4.2 Juwi Holding AG
- 6.4.3 ACWA Power
- 6.4.4 Enel Green Power S.p.A.
- 6.4.5 EDF Renewables
- 6.4.6 Acciona SA
- 6.4.7 JinkoSolar Holding Co. Ltd
- 6.4.8 Canadian Solar Inc.
- 6.4.9 First Solar Inc.
- 6.4.10 Hidroelectrica de Cahora Bassa S.A.
- 6.4.11 Scatec ASA
- 6.4.12 Mainstream Renewable Power
- 6.4.13 Siemens Gamesa Renewable Energy
- 6.4.14 BTE Renewable
- 6.4.15 Orsted A/S
- 6.4.16 TotalEnergies Renewables
- 6.4.17 Masdar Clean Energy
- 6.4.18 ENGIE Africa
- 6.4.19 Globeleq
- 6.4.20 Abengoa Solar
7 Market Opportunities & Future Outlook
- 7.1 White-Space & Unmet-Need Assessment

 全球可再生能源市場規模、佔有率、趨勢和成長分析報告(2026-2034年)
 可再生能源市場預測至2034年—按能源來源、裝置容量、部署狀況、應用、最終用戶和地區分類的全球分析全球太陽能上吸式塔市場規模、佔有率、趨勢和成長分析報告(2026-2034年)
 歐洲可再生能源:市場佔有率分析、產業趨勢與統計及成長預測(2026-2031 年)中東可再生能源:市場佔有率分析、產業趨勢與統計及成長預測(2026-2031 年)南美洲可再生能源:市場佔有率分析、產業趨勢與統計及成長預測(2026-2031 年)南部非洲可再生能源:市場佔有率分析、產業趨勢與統計及成長預測(2026-2031 年)東南亞可再生能源:市場佔有率分析、產業趨勢與統計及成長預測(2026-2031年)
 人機介面(HMI)汽輪機控制系統市場規模、佔有率和成長分析:按組件、汽輪機類型、應用、最終用戶和地區分類-2026-2033年產業預測可再生能源併網:市場規模、佔有率、成長、全球產業分析、區域趨勢及2026-2034年預測