


 |
市場調查報告書
商品編碼
2115212
南部非洲可再生能源:市場佔有率分析、產業趨勢與統計及成長預測(2026-2031 年)Southern Africa Renewable Energy - Market Share Analysis, Industry Trends & Statistics, Growth Forecasts (2026 - 2031) |
||||||

※ 本網頁內容可能與最新版本有所差異。詳細情況請與我們聯繫。
據 Mordor Intelligence 稱,2025 年南部非洲可再生能源市場價值為 37.21 吉瓦,預計到 2031 年將達到 86.63 吉瓦,而 2026 年為 42.84 吉瓦,預測期(2026-2031 年)的複合年成長率為 15.12% 15.12%。
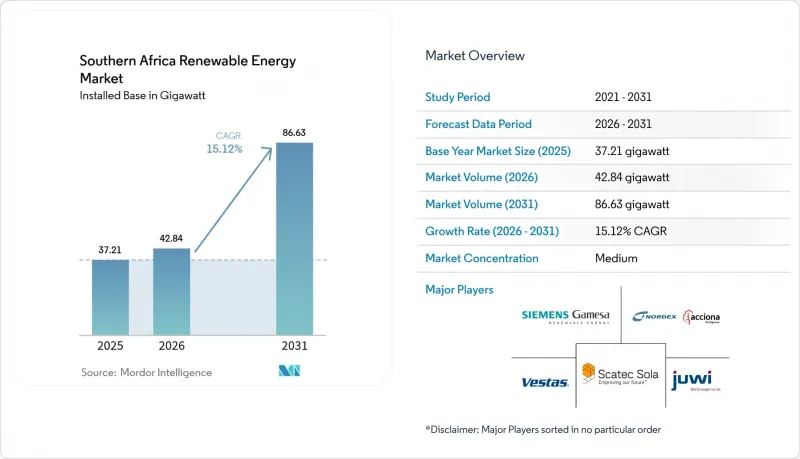
本報告按技術(太陽能、風能、水力、生質能源、地熱能和海洋能)、最終用戶(公共產業、商業和工業以及住宅)和地區(南非、安哥拉、尚比亞、剛果民主共和國、坦尚尼亞、莫三比克和其他南部非洲國家)進行細分。市場規模和預測以裝置容量(吉瓦)為單位。
南部非洲可再生能源市場趨勢與洞察
太陽能和風能的平準化度電成本下降
由於亞洲製造商組件供應過剩,到2024年底,北開普省公用事業規模太陽能發電的競標價格跌破每千瓦時0.03美元,遠低於Eskoom的平均發電成本每千瓦時1.48蘭特。晶科能源和First Solar在競標以比2022年基準價格低22%的價格供應項目,並以低於每千瓦時0.50蘭特的價格簽訂了為期20年的購電協議(PPA)。儘管東開普省陸上風電的平準化度電成本(LCOE)接近每千瓦時0.04美元,但由於物流瓶頸和電網建設延誤,風電競標價格比太陽能高出18%,導致第七輪競標中風電配額為零。奈米比亞的「Hyphen」計畫為其7吉瓦的裝置容量組合爭取到了每千瓦時0.025美元的可再生能源混合電價,創下了該地區最低價格,並預示著價格還有進一步下降的空間。透過將四小時的電池儲能與太陽能發電相結合,現在可以以每千瓦時約0.06美元的價格提供可調節的發電容量,這削弱了燃煤電廠高峰時段的經濟可行性,並支持了南非國家電力公司(Eskom)的「公正轉型」計劃。
Escom電價上漲及電力限制風險
南非國家能源監管局 (NERSA) 將電價上調 36%,預計到 2025/26 會計年度,工業用電平均成本將超過每千瓦時 2.20 蘭特,這將使 500 千瓦以上屋頂太陽能發電系統的投資回收期縮短至不到四年。 2024 年,南非第六階段計畫停電持續了 78 天,促使大型礦業公司簽署了超過 200 兆瓦的自用太陽能發電和儲能系統合約。 《電力監管修正案》允許私人投資輸電和電力運輸,使豪登省的企業買家無需透過南非國家電力公司 (Eskom) 即可從北開普省購買可再生能源。預計到 2030 年,這項改革將使南非國家電力公司的發電佔有率降至 60% 以下,使其轉型為純粹的電網營運商。多邊金融機構將優惠貸款與電網的早期發展掛鉤,並將未來的貸款發放與「未供應電力」的可衡量減少量掛鉤。
開普奈米比亞走廊的電力傳輸瓶頸
北開普省的輸電線路目前僅以92%的運轉率運行,導致每年發電量減少180吉瓦時(GWh),併網時間延遲長達18個月。由於融資限制,南非國家電力公司(Eskom)推遲了其耗資45億蘭特的「Aries Kronos」維修項目,使其先前已中標的1.2吉瓦項目也變得不可行。南非國家電力公司(Nampower)的Kokerboom-Gels輸電線路僅能額外輸送800兆瓦的電力,而僅海芬一地就需要2.5吉瓦的輸電容量。儘管私部門對此表現出興趣,但由於成本回收和輸電費轉嫁方面仍存在不確定性,首個獨立輸電項目的融資尚未完成。開發商正在安裝電池儲能系統,將電力輸出轉移到用電低谷時段,這將使每千瓦的資本支出(CAPEX)增加150至200美元,並使股本回報率降低高達2個百分點。
細分市場分析
水力發電在南部非洲可再生能源市場佔據主導地位,預計2025年將佔市場佔有率的61.25%。這主要得益於贊比亞卡里巴水力發電廠和剛果民主共和國英加水電站等現有設施持續供應大量電力。預計到2031年,風力發電裝置容量的複合年成長率將達到24.35%,是所有技術中成長最快的,這主要得益於再生能源獨立電力生產商採購計畫(REIPPPP)的規劃以及公司間購電協議(PPA)的擴大。光伏發電(包括光伏發電和聚光型太陽熱能發電)在2025年佔發電裝置容量的28.60%。 ACWA Power公司420兆瓦的紅石發電廠(配備12小時熔鹽儲熱系統)展現了光伏發電的可擴展潛力,這一特性深受電力公司青睞,可用於滿足晚間用電高峰需求。生質能源仍是一個小眾市場,發電量佔不到2%。這些能源主要集中在南非的甘蔗產區,當地糖廠則利用甘蔗渣進行熱電汽電共生。地熱能和海洋能仍處於探勘階段。坦尚尼亞的東非大裂谷地區擁有高達5吉瓦的生物能源潛力,但每口井近500萬美元的鑽井成本抑制了其短期前景。
儘管每千瓦的資本成本超過2000美元,但開發商預計,到2030年,Eskom在Ingara和Drakensberg的抽水發電工程將為電網平衡貢獻1.4吉瓦的電力。安哥拉和莫三比克正經歷小規模水力發電發電工程(裝置容量低於10兆瓦)的激增,這些計畫由捐助者資助,目標是到2030年達到300兆瓦。風電的擴張取決於物流解決方案以及伊麗莎白港更快的環境許可批准。結合太陽能、風能和儲能的混合型電站預計將憑藉其多元化的收入來源贏得合約。阿爾戈亞灣的海洋能源試驗計畫尚未準備好商業化,預計未來十年內不會大幅擴張。整體而言,技術多元化正在削弱水力發電的主導地位,南部非洲的可再生能源市場正朝著更平衡的方向發展。
其他好處:
- Excel格式的市場預測(ME)表
- 3個月的分析師支持
目錄
第1章:引言
- 研究假設和市場定義
- 調查範圍
第2章:調查方法
第3章執行摘要
第4章 市場狀況
- 市場概覽
- 市場促進因素
- 太陽能和風能的平準化度電成本下降
- Escom 的價格上漲以及計劃內停電的風險
- REIPPPP 和新的可再生能源總體規劃 (SAREM)
- 公司間購電協議和輸電框架的激增
- 綠氫能出口走廊(奈米比亞、南非北開普省)
- 碳市場貨幣化並避免歐盟碳排放交易機制
- 市場限制因素
- 開普奈米比亞走廊的電力傳輸瓶頸
- 風力發電特有的土地短缺和競標失敗問題
- 貨幣風險和主權信用風險阻礙企劃案融資。
- 公用事業規模儲能系統和維運方面的技能差距;
- 供應鏈分析
- 監理展望
- 技術展望
- 波特五力模型
第5章 市場規模與成長預測
- 透過技術
- 太陽能(光伏發電(PV)和聚光型太陽熱能發電(CSP))
- 風力發電(陸上和海上)
- 水力發電(小規模、大型、抽水蓄能)
- 生質能源
- 地熱
- 海洋能源(潮汐能和波浪能)
- 最終用戶
- 公用事業
- 商業和工業用途
- 住宅
- 按地區
- 南非
- 奈米比亞
- 尚比亞
- 莫三比克
- 波札那
- 安哥拉
- 辛巴威
- 南部非洲其他地區
第6章 競爭情勢
- 市場集中度
- 策略性措施(併購、合資、資金籌措、購電協議)
- 市場佔有率分析(主要公司的市場排名和佔有率)
- 公司簡介
- Scatec ASA
- EDF Renewables
- Enel Green Power South Africa
- BTE Renewables(BioTherm)
- ACWA Power
- JinkoSolar Holding Co. Ltd
- Vestas Wind Systems A/S
- Siemens Gamesa Renewable Energy SA
- Nordex SE
- First Solar Inc.
- Juwi AG
- Sola Group
- ABO Energy South Africa
- ACED(African Clean Energy Developments)
- Pylontech South Africa
- Distributed Power Africa
- Freedom Won
- Eskom Renewable IPP Office
第7章 市場機會與未來展望
According to Mordor Intelligence, the Southern Africa renewable energy market size was valued at 37.21 gigawatt in 2025 and estimated to grow from 42.84 gigawatt in 2026 to reach 86.63 gigawatt by 2031, at a CAGR of 15.12% during the forecast period (2026-2031).
This report is Segmented by Technology (Solar Energy, Wind Energy, Hydropower, Bioenergy, Geothermal, and Ocean Energy), End-User (Utilities, Commercial and Industrial, and Residential), and Geography (South Africa, Angola, Zambia, Democratic Republic of Congo, Tanzania, Mozambique, and Rest of Southern Africa). The Market Sizes and Forecasts are Provided in Terms of Installed Capacity (GW).
Southern Africa Renewable Energy Market Trends and Insights
Declining LCOE for Solar & Wind
Module oversupply from Asian manufacturers lowered utility-scale solar tariffs below USD 0.03 per kWh in the Northern Cape by late 2024, well under Eskom's average generation cost of ZAR 1.48 per kWh. JinkoSolar and First Solar supplied Bid Window 7 projects at prices 22% below 2022 benchmarks, enabling sub-ZAR 0.50 per kWh twenty-year power purchase agreements. Onshore wind LCOE in the Eastern Cape approached USD 0.04 per kWh, yet logistics bottlenecks and grid delays left wind bids 18% costlier than solar, resulting in zero wind allocations in Bid Window 7. Namibia's Hyphen project secured a blended renewables tariff of USD 0.025 per kWh for its 7 GW portfolio, establishing a regional floor and signaling future price compression. Coupling four-hour batteries with solar now provides dispatchable capacity at roughly USD 0.06 per kWh, eroding the economics of coal peakers and supporting Eskom's just-transition schedule.
Escalating Eskom Tariffs & Load-Shedding Risk
NERSA's 36% tariff hike raises the average industrial power cost above ZAR 2.20 per kWh in 2025/26, reducing the payback period for rooftop solar arrays larger than 500 kW to below four years. Stage 6 load-shedding persisted for 78 days in 2024, prompting mining majors to contract more than 200 MW of captive solar-plus-storage systems. The Electricity Regulation Amendment Act allows private transmission investment and wheeling, enabling corporate buyers in Gauteng to source Northern Cape renewables without Eskom as an intermediary. This reform is expected to reduce Eskom's generation share below 60% by 2030, transitioning the utility toward a pure transmission-system-operator role. Multilateral lenders are linking concessional finance to accelerated grid upgrades, tying future disbursements to measurable reductions in unserved energy.
Transmission Bottlenecks in Cape & Namibia Corridors
Northern Cape lines operate at 92% utilization, curtailing 180 gigawatt-hours (GWh) per year and delaying grid connections by up to 18 months. Eskom deferred the ZAR 4.5 billion Aries-Kronos upgrade due to liquidity constraints, leaving 1.2 GW of awarded projects stranded. NamPower's Kokerboom-Gerus backbone can absorb only 800 MW of additional injections, yet Hyphen alone needs 2.5 GW of export capacity. Private-sector interest exists, but cost-recovery and wheeling-tariff pass-through remain unclear, stalling financial close on the first independent transmission projects. Developers are co-locating batteries to shift output into off-peak transmission windows, adding USD 150-200 per kW to capital expenditures (capex) and trimming equity returns by up to 2 percentage points.
Other drivers and restraints analyzed in the detailed report include:
- REIPPPP & South African Renewable Energy Masterplan
- Surge in Corporate PPAs & Wheeling Frameworks
- Wind-Specific Site Scarcity & Auction Failures
For complete list of drivers and restraints, kindly check the Table Of Contents.
Segment Analysis
Hydropower dominated the Southern African renewable energy market, accounting for a 61.25% share in 2025, as legacy assets, such as Zambia's Kariba and the Democratic Republic of Congo's Inga complexes, continue to supply bulk power. Wind capacity is expected to post a 24.35% CAGR to 2031, the fastest among all technologies, supported by forthcoming REIPPPP carve-outs and expanding corporate PPAs. Solar, including photovoltaic and concentrated solar power, accounted for 28.60% of capacity in 2025; ACWA Power's 420 MW Redstone plant with 12-hour molten-salt storage demonstrated solar's dispatchable potential, a feature utilities favor for evening peaks. Bioenergy remains a niche market, accounting for less than 2% of capacity, primarily concentrated in South Africa's sugarcane belt, where mills co-generate power from bagasse. Geothermal and ocean energy are still in the exploratory stage; Tanzania's Rift Valley sites offer up to 5 GW of potential, but drilling costs of nearly USD 5 million per well dampen near-term prospects.
Developers anticipate that pumped-storage projects at Eskom's Ingula and Drakensberg sites will contribute 1.4 GW to grid balancing by 2030, despite capital costs exceeding USD 2,000 per kW. Small hydropower projects under 10 MW are proliferating in Angola and Mozambique through donor finance, aiming to reach 300 MW by 2030. Wind's upswing hinges on logistics solutions at Port Elizabeth and expedited environmental permits; hybrid solar-wind-storage plants are expected to win contracts as they diversify revenue streams. Ocean-energy pilot programs in Algoa Bay currently remain below commercial readiness levels, making material additions unlikely this decade. Overall, technology diversification is narrowing hydropower's dominance and steering the Southern Africa renewable energy market toward a more balanced mix.
Complete Report Scope:
- By Technology
- Solar Energy (PV and CSP)
- Wind Energy (Onshore and Offshore)
- Hydropower (Small, Large, PSH)
- Bioenergy
- Geothermal
- Ocean Energy (Tidal and Wave)
- By End-User
- Utilities
- Commercial and Industrial
- Residential
- By Geography
- South Africa
- Namibia
- Zambia
- Mozambique
- Botswana
- Angola
- Zimbabwe
- Rest of Southern Africa
List of Companies Covered in this Report:
- Scatec ASA
- EDF Renewables
- Enel Green Power South Africa
- BTE Renewables (BioTherm)
- ACWA Power
- JinkoSolar Holding Co. Ltd
- Vestas Wind Systems A/S
- Siemens Gamesa Renewable Energy SA
- Nordex SE
- First Solar Inc.
- Juwi AG
- Sola Group
- ABO Energy South Africa
- ACED ( African Clean Energy Developments)
- Pylontech South Africa
- Distributed Power Africa
- Freedom Won
- Eskom Renewable IPP Office
Additional Benefits:
- The market estimate (ME) sheet in Excel format
- 3 months of analyst support
TABLE OF CONTENTS
1 Introduction
- 1.1 Study Assumptions & Market Definition
- 1.2 Scope of the Study
2 Research Methodology
3 Executive Summary
4 Market Landscape
- 4.1 Market Overview
- 4.2 Market Drivers
- 4.2.1 Declining LCOE for solar & wind
- 4.2.2 Escalating Eskom tariffs & load-shedding risk
- 4.2.3 REIPPPP & new Renewable Energy Masterplan (SAREM)
- 4.2.4 Surge in corporate PPAs & wheeling frameworks
- 4.2.5 Green-hydrogen export corridors (Namibia, SA Northern Cape)
- 4.2.6 Monetisation of carbon markets & EU-CBAM avoidance
- 4.3 Market Restraints
- 4.3.1 Transmission bottlenecks in Cape & Namibia corridors
- 4.3.2 Wind-specific site scarcity & auction failures
- 4.3.3 Currency & sovereign-credit risk deterring project finance
- 4.3.4 Skills gap for utility-scale BESS & O&M
- 4.4 Supply-Chain Analysis
- 4.5 Regulatory Outlook
- 4.6 Technological Outlook
- 4.7 Porters Five Forces
- 4.7.1 Threat of New Entrants
- 4.7.2 Bargaining Power of Suppliers
- 4.7.3 Bargaining Power of Buyers
- 4.7.4 Threat of Substitutes
- 4.7.5 Industry Rivalry
5 Market Size & Growth Forecasts
- 5.1 By Technology
- 5.1.1 Solar Energy (PV and CSP)
- 5.1.2 Wind Energy (Onshore and Offshore)
- 5.1.3 Hydropower (Small, Large, PSH)
- 5.1.4 Bioenergy
- 5.1.5 Geothermal
- 5.1.6 Ocean Energy (Tidal and Wave)
- 5.2 By End-User
- 5.2.1 Utilities
- 5.2.2 Commercial and Industrial
- 5.2.3 Residential
- 5.3 By Geography
- 5.3.1 South Africa
- 5.3.2 Namibia
- 5.3.3 Zambia
- 5.3.4 Mozambique
- 5.3.5 Botswana
- 5.3.6 Angola
- 5.3.7 Zimbabwe
- 5.3.8 Rest of Southern Africa
6 Competitive Landscape
- 6.1 Market Concentration
- 6.2 Strategic Moves (M&A, JVs, Funding, PPAs)
- 6.3 Market Share Analysis (Market Rank/Share for key companies)
- 6.4 Company Profiles (includes Global-level Overview, Market-level Overview, Core Segments, Financials, Strategic Information, Products & Services, Recent Developments)
- 6.4.1 Scatec ASA
- 6.4.2 EDF Renewables
- 6.4.3 Enel Green Power South Africa
- 6.4.4 BTE Renewables (BioTherm)
- 6.4.5 ACWA Power
- 6.4.6 JinkoSolar Holding Co. Ltd
- 6.4.7 Vestas Wind Systems A/S
- 6.4.8 Siemens Gamesa Renewable Energy SA
- 6.4.9 Nordex SE
- 6.4.10 First Solar Inc.
- 6.4.11 Juwi AG
- 6.4.12 Sola Group
- 6.4.13 ABO Energy South Africa
- 6.4.14 ACED ( African Clean Energy Developments)
- 6.4.15 Pylontech South Africa
- 6.4.16 Distributed Power Africa
- 6.4.17 Freedom Won
- 6.4.18 Eskom Renewable IPP Office
7 Market Opportunities & Future Outlook
- 7.1 White-space & Unmet-Need Assessment

 全球可再生能源市場規模、佔有率、趨勢和成長分析報告(2026-2034年)
 可再生能源市場預測至2034年—按能源來源、裝置容量、部署狀況、應用、最終用戶和地區分類的全球分析全球太陽能上吸式塔市場規模、佔有率、趨勢和成長分析報告(2026-2034年)
 歐洲可再生能源:市場佔有率分析、產業趨勢與統計及成長預測(2026-2031 年)非洲可再生能源:市場佔有率分析、產業趨勢與統計及成長預測(2026-2031 年)中東可再生能源:市場佔有率分析、產業趨勢與統計及成長預測(2026-2031 年)南美洲可再生能源:市場佔有率分析、產業趨勢與統計及成長預測(2026-2031 年)東南亞可再生能源:市場佔有率分析、產業趨勢與統計及成長預測(2026-2031年)
 人機介面(HMI)汽輪機控制系統市場規模、佔有率和成長分析:按組件、汽輪機類型、應用、最終用戶和地區分類-2026-2033年產業預測可再生能源併網:市場規模、佔有率、成長、全球產業分析、區域趨勢及2026-2034年預測