


 |
市場調查報告書
商品編碼
2116768
歐洲可再生能源:市場佔有率分析、產業趨勢與統計及成長預測(2026-2031 年)Europe Renewable Energy - Market Share Analysis, Industry Trends & Statistics, Growth Forecasts (2026 - 2031) |
||||||

※ 本網頁內容可能與最新版本有所差異。詳細情況請與我們聯繫。
根據 Mordor Intelligence 預測,歐洲可再生能源市場規模(以裝置容量計算)預計將從 2025 年的 1.11兆瓦擴大到 2026 年的 1.20兆瓦,然後從 2026 年到 2031 年以 8.51% 的複合年成長率成長,達到 2011 年兆瓦。
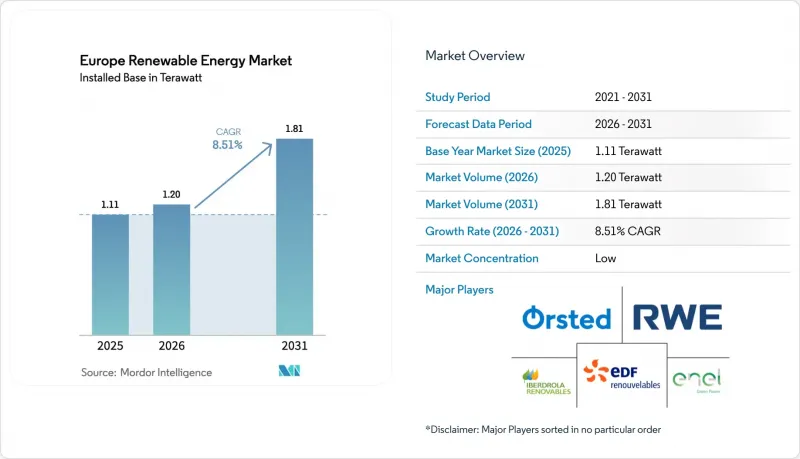
本報告按技術(太陽能、風力發電、水力發電、生質能源、地熱能和海洋能)、最終用戶(公共產業、商業和工業以及住宅)和地區(德國、英國、西班牙、法國、義大利、荷蘭、丹麥、瑞典和其他歐洲國家)進行細分。市場規模和預測均以裝置容量(GW)為基礎。
歐洲可再生能源市場趨勢與分析
「Fit-for-55」和「REPowerEU」的目標達成率均為45%。
REPowerEU計畫將可再生能源目標提高到2030年佔最終能源消耗的45%,德國承諾80%的電力來自可再生,荷蘭的目標是到2030年實現21吉瓦的離岸風力發電。在指定的「優先發展區域」加快授權程序,將平均前置作業時間縮短至兩年以內,加權平均資本成本(WACC)將降低50-100個基點,但實現關鍵目標仍取決於加強電網同步。
太陽能和陸域風電的平準化度電成本快速下降
預計到2025年,南歐公用事業規模的太陽能發電成本將達到每兆瓦時25-30歐元,這得益於雙面組件和追蹤器的引入提高了效率。同時,陸域風電場憑藉其豐富的風能資源,成本已達到每兆瓦時30-35歐元,這使得西班牙可以進行無補貼競標,義大利則可以進行私人主導的建設。儘管利潤率的下降正在加速開發商之間的整合,但投資者的興趣正轉向那些能夠利用日內價格波動獲利的私人主導項目。
輸電網路擁塞和電網連接瓶頸
到2025年,棄風減量將導致風能和太陽能發電量減少8太瓦時,造成8億歐元的未實現收入損失。從西班牙到法國以及從北歐樞紐到中歐的輸電能力限制抑制了私人項目的市場准入速度,儘管資本支出(CAPEX)高出10-15%,但電廠電池儲能系統的應用仍在推進。
細分市場分析
到2025年,太陽能發電將佔歐洲可再生能源市場佔有率的38.24%。這反映了伊比利亞半島住宅屋頂太陽能板的廣泛應用,以及公用事業公司建造大型發電廠的趨勢。預計到2031年,海洋能將以31.83%的複合年成長率成長,主要得益於蘇格蘭的商業潮汐能設施和葡萄牙的波浪能試點計畫。
公用事業規模的太陽能發電仍然是歐洲可再生能源市場的基石,但開發商正擴大採用儲能電池混合發電,以平抑日間波動並滿足綠色氫能的提煉合約。離岸風電目前已標準化採用15-18兆瓦的風力渦輪機,其容量係數達50-55%,正在擴大基本負載供電時間。抽水蓄能水力發電佔總發電量的12-14%,目前正在擴大規模,以提供超過6小時的儲能容量。生質能源和地熱能雖然仍屬於小眾能源,但在北歐和火山地區卻能提供重要的柔軟性。
其他好處:
- Excel格式的市場預測(ME)表
- 3個月的分析師支持
目錄
第1章:引言
- 研究假設和市場定義
- 調查範圍
第2章:調查方法
第3章執行摘要
第4章 市場狀況
- 市場概覽
- 市場促進因素
- 歐盟的「適合55歲族群」計畫和「再生能源賦能歐盟」計畫:目標是2030年實現45%的人口健康
- 太陽能和陸域風電的平準化度電成本快速下降
- 歐盟排放交易體系(EU-ETS)下碳價格的上漲正在導致優先順序改變。
- 歐盟戰略支持離岸風力發電的擴張。
- 資料中心與重工業叢集之間的購電協定(PPA)
- 綠色氫能的分配將為新的可再生能源發電能力奠定基礎。
- 市場限制因素
- 輸電網路擁塞和電網連接瓶頸
- 政策變更追溯和關稅退款
- 供應鏈(變壓器、海底電纜)正受到價格飆升的衝擊。
- 當地反對/因生物多樣性訴訟而導致的延誤
- 供應鏈分析
- 監理情勢
- 技術展望
- 波特五力模型
第5章 市場規模與成長預測
- 透過技術
- 太陽能(光伏發電和聚光型太陽熱能發電)
- 風力發電(陸上和海上)
- 水力發電(小規模、大型、抽水蓄能)
- 生質能源
- 地熱
- 海洋能源(潮汐能和波浪能)
- 最終用戶
- 公用事業
- 商業和工業用途
- 住宅
- 按地區
- 德國
- 英國
- 西班牙
- 法國
- 義大利
- 荷蘭
- 丹麥
- 瑞典
- 其他歐洲國家
第6章 競爭情勢
- 市場集中度
- 策略性措施(併購、合資、資金籌措、購電協議)
- 市場佔有率分析(主要公司的市場排名和佔有率)
- 公司簡介
- Enel Green Power SpA
- Iberdrola Renovables SA
- Orsted A/S
- RWE Renewables GmbH
- EDF Renewables
- Engie SA(Renewables)
- Acciona Energia SA
- Statkraft AS
- EDP Renovaveis SA
- Vattenfall AB(Renewables)
- Vestas Wind Systems A/S
- Siemens Gamesa Renewable Energy SA
- Nordex SE
- Hanwha Q Cells GmbH
- TotalEnergies Renewables
- Repsol Renovables
- ContourGlobal PLC
- Abengoa SA
- Andritz AG
- BayWa re AG
第7章 市場機會與未來展望
According to Mordor Intelligence, the Europe renewable energy market size in terms of installed base is expected to grow from 1.11 Terawatt in 2025 to 1.20 Terawatt in 2026 and is forecast to reach 1.81 Terawatt by 2031 at 8.51% CAGR over 2026-2031.
This report is Segmented by Technology (Solar Energy, Wind Energy, Hydropower, Bioenergy, Geothermal, and Ocean Energy), End-User (Utilities, Commercial and Industrial, and Residential), and Geography (Germany, United Kingdom, Spain, France, Italy, Netherlands, Denmark, Sweden, and Rest of Europe). The Market Sizes and Forecasts are Provided in Terms of Installed Capacity (GW).
Europe Renewable Energy Market Trends and Insights
Fit-for-55 & REPowerEU 45% Target
The REPowerEU plan elevates the 2030 renewables target to 45% of final energy, with Germany pledging 80% renewable electricity and the Netherlands aiming for 21 GW offshore wind by 2030. Fast-track permitting in designated "go-to" areas cuts average lead times below two years and trims WACC by 50-100 bps, yet reaching the headline goal still hinges on synchronous grid reinforcement.
Rapid Solar and Onshore-Wind LCOE Decline
Utility-scale solar in Southern Europe achieved EUR 25-30 per MWh in 2025 after bifacial-module and tracker gains, while high-resource onshore-wind sites reached EUR 30-35 per MWh, enabling subsidy-free auctions in Spain and merchant builds in Italy. Investor appetite is shifting toward merchant projects that exploit intraday volatility, even as narrower margins accelerate developer consolidation.
Grid Congestion & Interconnection Bottlenecks
Curtailment erased 8 TWh of wind and solar output in 2025, costing EUR 800 million in unrealized revenue. Limited capacity from Spain into France and from Nordic hubs into Central Europe suppresses merchant capture rates, driving co-located battery deployment despite 10-15% higher capex.
Other drivers and restraints analyzed in the detailed report include:
- Rising EU-ETS Carbon Price
- Offshore-Wind Build-Out Strategies
- Retroactive Policy Shifts
For complete list of drivers and restraints, kindly check the Table Of Contents.
Segment Analysis
Solar held 38.24% of Europe's renewable energy market share in 2025, reflecting broad rooftop adoption and utility builds across Iberia. Ocean energy is on track for a 31.83% CAGR to 2031, buoyed by Scotland's commercial tidal arrays and Portugal's wave pilots.
Utility-grade solar remains the volume anchor of the European renewable energy market, yet developers increasingly hybridize with batteries to smooth intraday volatility and satisfy green-hydrogen offtake contracts. Offshore wind, now standardizing 15-18 MW machines, contributes growing baseload hours at 50-55% capacity factors. Pumped-storage hydro, 12-14% of capacity, is being uprated for six-plus-hour storage duty. Bioenergy and geothermal preserve niche roles but supply key flexibility in Nordic and volcanic belts.
Complete Report Scope:
- By Technology
- Solar Energy (PV and CSP)
- Wind Energy (Onshore and Offshore)
- Hydropower (Small, Large, PSH)
- Bioenergy
- Geothermal
- Ocean Energy (Tidal and Wave)
- By End-User
- Utilities
- Commercial and Industrial
- Residential
- By Geography
- Germany
- United Kingdom
- Spain
- France
- Italy
- Netherlands
- Denmark
- Sweden
- Rest of Europe
List of Companies Covered in this Report:
- Enel Green Power S.p.A.
- Iberdrola Renovables S.A.
- Orsted A/S
- RWE Renewables GmbH
- EDF Renewables
- Engie SA (Renewables)
- Acciona Energia S.A.
- Statkraft AS
- EDP Renovaveis S.A.
- Vattenfall AB (Renewables)
- Vestas Wind Systems A/S
- Siemens Gamesa Renewable Energy S.A.
- Nordex SE
- Hanwha Q Cells GmbH
- TotalEnergies Renewables
- Repsol Renovables
- ContourGlobal PLC
- Abengoa SA
- Andritz AG
- BayWa r.e. AG
Additional Benefits:
- The market estimate (ME) sheet in Excel format
- 3 months of analyst support
TABLE OF CONTENTS
1 Introduction
- 1.1 Study Assumptions & Market Definition
- 1.2 Scope of the Study
2 Research Methodology
3 Executive Summary
4 Market Landscape
- 4.1 Market Overview
- 4.2 Market Drivers
- 4.2.1 EU "Fit-for-55" & REPowerEU 45 % target by 2030
- 4.2.2 Rapid LCOE decline in solar & onshore wind
- 4.2.3 Rising EU-ETS carbon price tilting merit-order
- 4.2.4 Offshore-wind build-out backed by EU strategies
- 4.2.5 Corporate PPAs from data-centre & heavy-industry clusters
- 4.2.6 Green-hydrogen quotas anchoring new RES capacity
- 4.3 Market Restraints
- 4.3.1 Grid congestion & interconnection bottlenecks
- 4.3.2 Retroactive policy shifts & tariff claw-backs
- 4.3.3 Price-inflated supply chains (transformers, subsea cables)
- 4.3.4 Local opposition/biodiversity litigation delays
- 4.4 Supply-Chain Analysis
- 4.5 Regulatory Landscape
- 4.6 Technological Outlook
- 4.7 Porter's Five Forces
- 4.7.1 Bargaining Power of Suppliers
- 4.7.2 Bargaining Power of Buyers
- 4.7.3 Threat of New Entrants
- 4.7.4 Threat of Substitutes
- 4.7.5 Competitive Rivalry
5 Market Size & Growth Forecasts
- 5.1 By Technology
- 5.1.1 Solar Energy (PV and CSP)
- 5.1.2 Wind Energy (Onshore and Offshore)
- 5.1.3 Hydropower (Small, Large, PSH)
- 5.1.4 Bioenergy
- 5.1.5 Geothermal
- 5.1.6 Ocean Energy (Tidal and Wave)
- 5.2 By End-User
- 5.2.1 Utilities
- 5.2.2 Commercial and Industrial
- 5.2.3 Residential
- 5.3 By Geography
- 5.3.1 Germany
- 5.3.2 United Kingdom
- 5.3.3 Spain
- 5.3.4 France
- 5.3.5 Italy
- 5.3.6 Netherlands
- 5.3.7 Denmark
- 5.3.8 Sweden
- 5.3.9 Rest of Europe
6 Competitive Landscape
- 6.1 Market Concentration
- 6.2 Strategic Moves (M&A, JVs, Funding, PPAs)
- 6.3 Market Share Analysis (Market Rank/Share for key companies)
- 6.4 Company Profiles (includes Global-level Overview, Market-level Overview, Core Segments, Financials, Strategic Information, Products & Services, Recent Developments)
- 6.4.1 Enel Green Power S.p.A.
- 6.4.2 Iberdrola Renovables S.A.
- 6.4.3 Orsted A/S
- 6.4.4 RWE Renewables GmbH
- 6.4.5 EDF Renewables
- 6.4.6 Engie SA (Renewables)
- 6.4.7 Acciona Energia S.A.
- 6.4.8 Statkraft AS
- 6.4.9 EDP Renovaveis S.A.
- 6.4.10 Vattenfall AB (Renewables)
- 6.4.11 Vestas Wind Systems A/S
- 6.4.12 Siemens Gamesa Renewable Energy S.A.
- 6.4.13 Nordex SE
- 6.4.14 Hanwha Q Cells GmbH
- 6.4.15 TotalEnergies Renewables
- 6.4.16 Repsol Renovables
- 6.4.17 ContourGlobal PLC
- 6.4.18 Abengoa SA
- 6.4.19 Andritz AG
- 6.4.20 BayWa r.e. AG
7 Market Opportunities & Future Outlook
- 7.1 White-space & Unmet-Need Assessment

 全球可再生能源市場規模、佔有率、趨勢和成長分析報告(2026-2034年)
 可再生能源市場預測至2034年—按能源來源、裝置容量、部署狀況、應用、最終用戶和地區分類的全球分析全球太陽能上吸式塔市場規模、佔有率、趨勢和成長分析報告(2026-2034年)
 非洲可再生能源:市場佔有率分析、產業趨勢與統計及成長預測(2026-2031 年)中東可再生能源:市場佔有率分析、產業趨勢與統計及成長預測(2026-2031 年)南美洲可再生能源:市場佔有率分析、產業趨勢與統計及成長預測(2026-2031 年)南部非洲可再生能源:市場佔有率分析、產業趨勢與統計及成長預測(2026-2031 年)東南亞可再生能源:市場佔有率分析、產業趨勢與統計及成長預測(2026-2031年)
 人機介面(HMI)汽輪機控制系統市場規模、佔有率和成長分析:按組件、汽輪機類型、應用、最終用戶和地區分類-2026-2033年產業預測可再生能源併網:市場規模、佔有率、成長、全球產業分析、區域趨勢及2026-2034年預測