


 |
市場調查報告書
商品編碼
2115186
南美洲可再生能源:市場佔有率分析、產業趨勢與統計及成長預測(2026-2031 年)South America Renewable Energy - Market Share Analysis, Industry Trends & Statistics, Growth Forecasts (2026 - 2031) |
||||||

※ 本網頁內容可能與最新版本有所差異。詳細情況請與我們聯繫。
根據 Mordor Intelligence 預測,南美洲可再生能源市場規模(以裝置容量計算)預計到 2025 年將達到 365.97 吉瓦,到 2026 年將達到 400.78 吉瓦,到 2031 年將達到 615.31 吉瓦,2026 年為 203%。
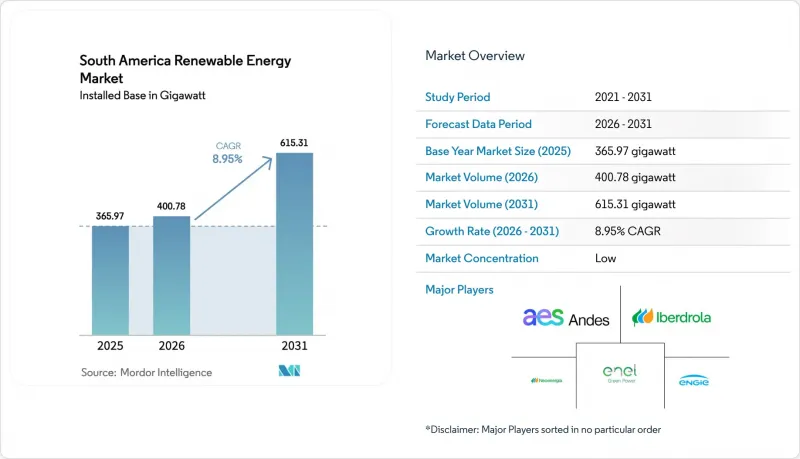
本報告按技術(太陽能、風能、水力發電、生質能源、地熱能和海洋能)、最終用戶(公共產業、商業和工業以及住宅)和地區(巴西、智利、阿根廷、哥倫比亞、秘魯和其他南美國家)進行細分。市場規模和預測均以裝置容量(GW)為基礎。
南美洲可再生能源市場趨勢與洞察
可再生能源競標計劃加快專案推進
自2023年起,競標競標取代了上網電價補貼(FIT)制度。巴西、智利和哥倫比亞聯合授予了總合8.5吉瓦的2024-2025年度契約,並且新規要求競標在簽署契約前必須獲得相關設施和電網的許可。此舉抑制了投機行為,並加快了建設進度。巴西2024年的備用容量競標,以每兆瓦時28美元的價格中標了3.1吉瓦,創歷史新低,這表明太陽能發電和儲能相結合的系統能夠與天然氣峰值發電競爭。智利2025年的2.5吉瓦招標要求配備4小時連續儲能系統,以確保夜間電力供應穩定。哥倫比亞2024年2.2吉瓦的招標重新激活了停滯的市場。同時,阿根廷各省競標了800兆瓦的風電項目,以規避聯邦政府的預算上限。這些規則讓投資者相信,他們簽約的資產將按計劃連接到電網,並且能夠從運作的第一天起就產生利潤。
太陽能和陸域風電的平準化度電成本下降
2024年,大型太陽能電站的平均平準化度電成本(LCOE)達到每兆瓦時29美元,這得益於雙面組件和單軸追蹤系統帶來的發電量提升,增幅高達20%。在巴西東北部,由於採用了120公尺高的輪轂,能夠捕捉更穩定的氣流,陸上風電成本降至每兆瓦時35美元。智利阿塔卡馬沙漠的一座太陽能電站於2024年簽署了一份價格低於20美元的購電協議(PPA),這使得一座1.2吉瓦的燃煤發電廠得以提前退役。巴伊亞州的一座風電場在2024年的容量係數超過50%,將投資回收期縮短至不到7年。隨著太陽能發電成本與石化燃料發電成本持平,補貼需求已不復存在,企業買家現在可以以比零售價低10-15%的價格直接簽訂購電協議。
電力傳輸瓶頸和電網連接延遲
在巴西巴伊亞州,截至2024年底,待建工程總裝置容量將達到5.4吉瓦,平均等待時間為18個月,原因是新建變電站的速度跟不上工程竣工的速度。在智利阿塔卡馬地區,截至2024年,仍有3吉瓦的計畫尚未核准,導致輸電容量減少1.8太瓦時。巴塔哥尼亞的一個風發電工程由於通往布宜諾斯艾利斯的高壓輸電線路資金未獲保障,面臨24個月的延期。漫長的等待名單導致開發成本上漲10%至15%,擠壓了電力銷售的利潤空間,並促使專案發起人在最終確定債務融資之前,要求獲得併網保障。
細分市場分析
到2025年,水力發電將佔總發電量的52.98%,但由於環境許可程序和降雨量波動,新建設的進度正在放緩。太陽能發電預計將以18.30%的複合年成長率成為所有技術中成長最快的,這得益於其低於30美元/兆瓦時的經濟可行性以及避免輸電瓶頸的模組化設計。風力發電預計每年增加約4.5吉瓦,這得益於巴西東北部50%的產能利用率。生質能源將透過甘蔗渣燃燒汽電共生提供12吉瓦的電力,這主要圍繞著巴西的RenovaBio目標。抽水蓄能水力發電是一個新興的細分領域,例如巴西的錫諾普(Sinop)項目,該項目裝機容量為401兆瓦,放水時間為8小時。離岸風力發電也在穩步推進,巴西正在實施一項16吉瓦的計劃,目標是在2027年運作。
太陽能發電的快速發展正在改變能源結構,但其輸出波動較大,因此需要儲能設施來滿足晚間用電高峰需求。聚光型太陽光電目前規模有限,智利的塞羅多米納多爾(Cerro Dominador)電站裝置容量為110兆瓦,這是由於其成本高達每千瓦6000美元。地熱發電在塞羅帕維利翁(Cerro Pavelion)的規模為48兆瓦,義大利國家電力公司(Enel)正考慮在安地斯山脈開發另外200兆瓦的地熱發電計畫。海洋能因資本成本超過每千瓦10,000美元,目前仍處於示範計畫階段。因此,假設儲能設施和輸電網能夠跟上發展步伐,到2031年,南美可再生能源市場中分配給太陽能和風能的規模成長速度將超過水力發電。
其他福利
- Excel格式的市場預測(ME)表
- 3個月的分析師支持
目錄
第1章:引言
- 研究假設和市場定義
- 調查範圍
第2章:調查方法
第3章執行摘要
第4章 市場狀況
- 市場概覽
- 市場促進因素
- 透過可再生能源競標計劃加快專案推進
- 太陽能和陸域風電的平準化度電成本下降
- 對綠氫能出口的雄心壯志正在推動設施擴建至切實可行的規模。
- 礦業部門之間旨在實現離網脫碳的購電協議(PPA)。
- 一個併網電池儲能項目,將提高可變現實能源(VRE)的採用率。
- 市場限制因素
- 電力傳輸瓶頸和電網連接延遲
- 外匯波動導致企劃案融資成本增加
- 由於在地採購限制,原始設備製造商增加了資本投資。
- 監理情勢
- 技術展望
- 供應鏈分析
- 波特五力模型
第5章 市場規模與成長預測
- 透過技術
- 太陽能(光伏發電、聚光型太陽熱能發電)
- 風力發電(陸上和海上)
- 水力發電(小規模、大型、抽水蓄能)
- 生質能源
- 地熱
- 海洋能源(潮汐能和波浪能)
- 最終用戶
- 公共產業
- 商業和工業用途
- 住宅
- 按地區
- 巴西
- 智利
- 阿根廷
- 哥倫比亞
- 秘魯
- 南美洲其他地區
第6章 競爭情勢
- 市場集中度
- 策略性措施(併購、合資、資金籌措、購電協議)
- 市場佔有率分析(主要公司的市場排名和佔有率)
- 公司簡介
- Enel Green Power SpA
- Iberdrola SA
- AES Andes SA
- ENGIE Brasil Energia SA
- Neoenergia SA
- Vestas Wind Systems A/S
- Siemens Gamesa Renewable Energy SA
- GE Renewable Energy
- EDF Renouvelables
- Acciona Energia
- Atlas Renewable Energy
- Canadian Solar Inc.
- Trina Solar Co. Ltd.
- Brookfield Renewable Partners LP
- Statkraft AS
- Mainstream Renewable Power Ltd.
- ABO Wind AG
- Invenergy LLC
- Suzlon Group
- Grupo Energia Bogota
第7章 市場機會與未來展望
According to Mordor Intelligence, the South America renewable energy market size in terms of installed base is projected to be 365.97 gigawatt in 2025, 400.78 gigawatt in 2026, and reach 615.31 gigawatt by 2031, growing at a CAGR of 8.95% from 2026 to 2031.
This report is Segmented by Technology (Solar Energy, Wind Energy, Hydropower, Bioenergy, Geothermal, and Ocean Energy), End-User (Utilities, Commercial and Industrial, and Residential), and Geography (Brazil, Chile, Argentina, Colombia, Peru, and Rest of South America). The Market Sizes and Forecasts are Provided in Terms of Installed Capacity (GW).
South America Renewable Energy Market Trends and Insights
Renewable-Energy Auction Programs Accelerating Project Pipeline
Competitive tenders replaced feed-in tariffs after 2023. Brazil, Chile, and Colombia jointly awarded 8.5 GW in 2024-2025, and penalty clauses now force bidders to secure equipment and grid permits before signing, which cuts speculation and speeds build schedules. Brazil's 2024 reserve auction cleared 3.1 GW at USD 28 per MWh, a record low that showed solar-plus-storage can compete with gas peakers. Chile's 2025 2.5 GW call mandates four-hour batteries, ensuring a firm evening supply. Colombia's 2.2 GW award in 2024 reopened its stalled market, while Argentina's provinces tendered 800 MW of wind to bypass federal budget limits. These rules give investors confidence that contracted assets will connect on time and earn revenue from day one.
Declining LCOE for Solar PV and Onshore Wind
Utility-scale solar averaged USD 29 per MWh in 2024 as bifacial modules and single-axis trackers boosted yields by up to 20%. Onshore wind fell to USD 35 per MWh, helped by 120-meter hub heights that catch steadier flows in Brazil's northeast. Chile's Atacama solar parks signed sub-USD 20 PPAs in 2024, prompting early retirement of 1.2 GW of coal. Wind farms in Bahia logged more than 50% capacity factors in 2024, shrinking payback periods to under seven years. Cost parity against fossil assets has ended the need for subsidies, letting corporate buyers sign direct PPAs at tariffs 10-15% below retail rates.
Transmission Bottlenecks and Interconnection Delays
Brazil's Bahia queue reached 5.4 GW in late 2024, stretching average wait times to 18 months as new substations lag project completion. Chile's Atacama backlog stranded 3 GW and caused 1.8 TWh of curtailment in 2024. Patagonia wind projects face a 24-month delay because high-voltage links to Buenos Aires remain unfunded. Long queues raise development costs 10-15% and erode tariff margins, pushing sponsors to demand grid-access guarantees before closing debt.
Other drivers and restraints analyzed in the detailed report include:
- Green-Hydrogen Export Ambitions Driving Utility-Scale Additions
- Mining-Sector Corporate PPAs for Off-Grid Decarbonization
- Local-Content Rules Increasing OEM Capex
For complete list of drivers and restraints, kindly check the Table Of Contents.
Segment Analysis
Hydropower held 52.98% of 2025 capacity, yet environmental permitting and variable rainfall slow new builds. Solar will grow at an 18.30% CAGR, the fastest of any technology, propelled by sub-USD 30 per MWh economics and modular designs that skirt transmission bottlenecks. Wind adds about 4.5 GW annually, boosted by 50% capacity factors in Brazil's northeast. Bioenergy contributes 12 GW through bagasse-fired cogeneration, anchored by Brazil's RenovaBio targets. Emerging niches include pumped-storage hydropower such as Brazil's 401 MW Sinop project, which delivers eight-hour discharge capability. Offshore wind development is taking shape with a 16 GW Brazilian pipeline aiming for first turbines in 2027.
Solar's rapid buildout is shifting the power mix, yet higher variable output requires storage for evening peaks. Concentrated solar power remains marginal beyond Chile's 110 MW Cerro Dominador plant due to USD 6,000-per-kW costs. Geothermal holds 48 MW at Cerro Pabellon, though Enel is exploring another 200 MW in the Andes. Ocean energy is still confined to pilot projects with capital costs above USD 10,000 per kW. The South America renewable energy market size allocated to solar and wind will therefore expand faster than hydro until 2031, provided that storage and grid upgrades keep pace.
Complete Report Scope:
- By Technology
- Solar Energy (PV and CSP)
- Wind Energy (Onshore and Offshore)
- Hydropower (Small, Large, PSH)
- Bioenergy
- Geothermal
- Ocean Energy (Tidal and Wave)
- By End-User
- Utilities
- Commercial and Industrial
- Residential
- By Geography
- Brazil
- Chile
- Argentina
- Colombia
- Peru
- Rest of South America
List of Companies Covered in this Report:
- Enel Green Power S.p.A.
- Iberdrola S.A.
- AES Andes S.A.
- ENGIE Brasil Energia S.A.
- Neoenergia S.A.
- Vestas Wind Systems A/S
- Siemens Gamesa Renewable Energy S.A.
- GE Renewable Energy
- EDF Renouvelables
- Acciona Energia
- Atlas Renewable Energy
- Canadian Solar Inc.
- Trina Solar Co. Ltd.
- Brookfield Renewable Partners L.P.
- Statkraft AS
- Mainstream Renewable Power Ltd.
- ABO Wind AG
- Invenergy LLC
- Suzlon Group
- Grupo Energia Bogota
Additional Benefits:
- The market estimate (ME) sheet in Excel format
- 3 months of analyst support
TABLE OF CONTENTS
1 Introduction
- 1.1 Study Assumptions & Market Definition
- 1.2 Scope of the Study
2 Research Methodology
3 Executive Summary
4 Market Landscape
- 4.1 Market Overview
- 4.2 Market Drivers
- 4.2.1 Renewable-energy auction programs accelerating project pipeline
- 4.2.2 Declining LCOE for solar PV and on-shore wind
- 4.2.3 Green-hydrogen export ambitions driving utility-scale additions
- 4.2.4 Mining-sector corporate PPAs for off-grid decarbonization
- 4.2.5 Grid-connected battery projects enabling higher VRE penetration
- 4.3 Market Restraints
- 4.3.1 Transmission bottlenecks & interconnection delays
- 4.3.2 FX volatility inflating project-finance costs
- 4.3.3 Local-content rules increasing OEM capex
- 4.4 Regulatory Landscape
- 4.5 Technological Outlook
- 4.6 Supply-Chain Analysis
- 4.7 Porter's Five Forces
- 4.7.1 Bargaining Power of Suppliers
- 4.7.2 Bargaining Power of Consumers
- 4.7.3 Threat of New Entrants
- 4.7.4 Threat of Substitute Products & Services
- 4.7.5 Intensity of Competitive Rivalry
5 Market Size & Growth Forecasts
- 5.1 By Technology
- 5.1.1 Solar Energy (PV and CSP)
- 5.1.2 Wind Energy (Onshore and Offshore)
- 5.1.3 Hydropower (Small, Large, PSH)
- 5.1.4 Bioenergy
- 5.1.5 Geothermal
- 5.1.6 Ocean Energy (Tidal and Wave)
- 5.2 By End-User
- 5.2.1 Utilities
- 5.2.2 Commercial and Industrial
- 5.2.3 Residential
- 5.3 By Geography
- 5.3.1 Brazil
- 5.3.2 Chile
- 5.3.3 Argentina
- 5.3.4 Colombia
- 5.3.5 Peru
- 5.3.6 Rest of South America
6 Competitive Landscape
- 6.1 Market Concentration
- 6.2 Strategic Moves (M&A, JVs, Funding, PPAs)
- 6.3 Market Share Analysis (Market Rank/Share for key companies)
- 6.4 Company Profiles (includes Global-level Overview, Market-level Overview, Core Segments, Financials, Strategic Information, Products & Services, Recent Developments)
- 6.4.1 Enel Green Power S.p.A.
- 6.4.2 Iberdrola S.A.
- 6.4.3 AES Andes S.A.
- 6.4.4 ENGIE Brasil Energia S.A.
- 6.4.5 Neoenergia S.A.
- 6.4.6 Vestas Wind Systems A/S
- 6.4.7 Siemens Gamesa Renewable Energy S.A.
- 6.4.8 GE Renewable Energy
- 6.4.9 EDF Renouvelables
- 6.4.10 Acciona Energia
- 6.4.11 Atlas Renewable Energy
- 6.4.12 Canadian Solar Inc.
- 6.4.13 Trina Solar Co. Ltd.
- 6.4.14 Brookfield Renewable Partners L.P.
- 6.4.15 Statkraft AS
- 6.4.16 Mainstream Renewable Power Ltd.
- 6.4.17 ABO Wind AG
- 6.4.18 Invenergy LLC
- 6.4.19 Suzlon Group
- 6.4.20 Grupo Energia Bogota
7 Market Opportunities & Future Outlook
- 7.1 White-space & Unmet-need Assessment

 全球可再生能源市場規模、佔有率、趨勢和成長分析報告(2026-2034年)
 可再生能源市場預測至2034年—按能源來源、裝置容量、部署狀況、應用、最終用戶和地區分類的全球分析全球太陽能上吸式塔市場規模、佔有率、趨勢和成長分析報告(2026-2034年)
 歐洲可再生能源:市場佔有率分析、產業趨勢與統計及成長預測(2026-2031 年)非洲可再生能源:市場佔有率分析、產業趨勢與統計及成長預測(2026-2031 年)中東可再生能源:市場佔有率分析、產業趨勢與統計及成長預測(2026-2031 年)南部非洲可再生能源:市場佔有率分析、產業趨勢與統計及成長預測(2026-2031 年)東南亞可再生能源:市場佔有率分析、產業趨勢與統計及成長預測(2026-2031年)
 人機介面(HMI)汽輪機控制系統市場規模、佔有率和成長分析:按組件、汽輪機類型、應用、最終用戶和地區分類-2026-2033年產業預測可再生能源併網:市場規模、佔有率、成長、全球產業分析、區域趨勢及2026-2034年預測