

 |
市場調查報告書
商品編碼
2114714
生物分解聚合物包膜複合肥料:市場佔有率分析、產業趨勢與統計、成長預測(2026-2031)Bio-degradable Polymer Coated NPK - Market Share Analysis, Industry Trends & Statistics, Growth Forecasts (2026 - 2031) |
||||||

※ 本網頁內容可能與最新版本有所差異。詳細情況請與我們聯繫。
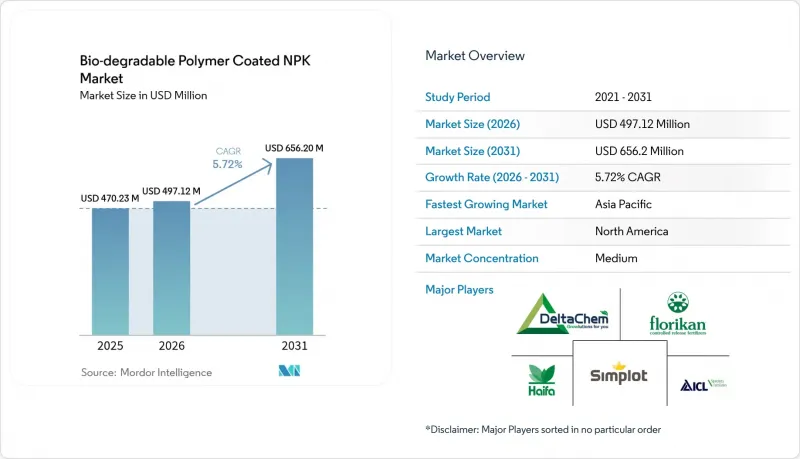
據 Mordor Intelligence 稱,可生物分解聚合物包覆的 NPK 肥料市場預計在 2026 年達到 4.9712 億美元,高於 2025 年的 4.7023 億美元,預計到 2031 年將達到 6.562 億美元。
預計 2026 年至 2031 年的複合年成長率為 5.72%。
本報告按類型(穀物、豆類和油籽、經濟作物、水果和蔬菜、草坪草和觀賞植物)和地區(北美、歐洲、亞太地區及其他)進行細分。市場預測以價值(美元)和數量(公噸)表示。
全球可生物分解聚合物包膜複合肥料市場趨勢及洞察
隨著肥料徑流的監管越來越嚴格,提高養分利用效率的必要性也日益凸顯。
隨著氮磷排放限制日益嚴格,生產者被迫調整養分釋放時間,使其與作物吸收時間相符。美國環保署 (EPA) 收緊了中西部多個流域的「最大總日負荷量 (TMDL)」配額,迫使玉米和大豆生產者在減少養分淋溶和麵臨罰款之間做出選擇。可生物分解的聚合物包膜複合肥料 (NPK) 可將養分釋放期延長至 180 天,在不影響產量的情況下減少 15-25% 的化學肥料用量。歐盟硝酸鹽指令下的類似法規加速了德國、法國和荷蘭的這一轉變,這些國家的緩釋性能已通過檢驗/TS 17700 標準驗證。因此,這種複合肥料在集約化生產系統中的應用更受制度壓力而非自願努力的推動。
政府獎勵促進碳中和精準營養
公共資金正縮短生產者購買包膜複合肥料的投資回收期。美國農業部已撥款用於氣候友善農產品試點項目,其中包括緩釋材料。在台灣,能夠證明減排效果的生產者可獲得高達農產品價格30%的補助。華盛頓州對達到標準的農民每英畝補貼50美元,以促進特種作物肥料向可生物分解包膜的過渡。這些獎勵正在縮短生產者的投資回收期,使得在碳權額度和永續性溢價適用的地區,可生物分解包膜複合肥在經濟上與傳統肥料具有競爭力。從策略角度來看,在公共支持力道大的市場,包膜複合肥的普及速度將迅速提升;而在沒有補貼項目的地區,包膜成本的降低需要規模經濟效應才能實現,因此普及速度會較為緩慢。
與傳統NPK肥料相比,價格差異顯著。
生物分解聚合物包膜複合肥料的價格通常比傳統顆粒肥料高出20%至40%,這在價格敏感型市場中構成了推廣障礙。對於南亞和撒哈拉以南非洲的小規模農戶而言,由於利潤率極低且融資管道有限,初始成本往往比長期效率提升更為重要。國際肥料發展中心(IFDC)2024年的一項調查發現,即使農業推廣人員展示了緩效肥料的增產效果,肯亞也只有12%的小規模農戶願意為緩效肥料支付超過15%的溢價。在產量提高和原料成本下降之前,緩釋肥料的推廣應用往往集中在大型農場和高價值作物。
細分市場分析
預計到2025年,穀物將佔銷售額的44.30%,鞏固其作為可生物分解聚合物包膜NPK複合肥料市場核心消費群的地位。大學在小麥、水稻和玉米上進行的大規模田間試驗表明,在產量相當的情況下,氮肥用量可減少15-25%,這證明了採用這種價格較高的肥料的合理性。大規模農業企業正在將包膜NPK複合肥料與變數播種機結合使用,以減少追肥次數並控制細粒作物的流失。此外,糧食產業也受益於相關政策,這些政策要求提供營養管理證明作為作物保險的必要條件,使得合規性成為一種利潤保障策略。豆類和油籽的市場佔有率雖然落後於穀物,但隨著大豆和鷹嘴豆出口目的地要求進行營養管理審核,它們的市場佔有率正在穩步成長。包膜NPK複合肥料也應用於甘蔗、咖啡和棉花等經濟作物,使農場能夠攤銷成本,並記錄土壤健康的改善情況,從而獲得認證溢價。
雖然草坪和觀賞植物的市場規模目前較小,但其成長速度在所有細分市場中最高,複合年成長率達7.45%。市政當局正在強制推行低負荷景觀設計,而專業承包商則願意承擔溢價以換取更低的人事費用,因為他們只需一次施工即可覆蓋整個生長季。越來越多的產品通過了ISO 14001環境管理系統認證,並在體育設施、高爾夫球場和大學綠地管理部門中得到應用,這增強了市場需求的穩定性,並加速了技術更新。水果和蔬菜的應用領域仍然較為小眾。其應用主要集中在可控環境中,在這些環境中,精準的營養管理直接影響產品的品質和保存期限。
區域分析
預計到2025年,北美將佔據可生物分解聚合物包膜複合肥料市場33.40%的佔有率。這得歸功於美國環保署(EPA)的徑流法規和獎勵計劃,這些計劃對符合規定的肥料提供補償。美國玉米和大豆農場平均種植面積超過400公頃,它們透過降低人事費用和燃料成本來抵消價格溢價。在加拿大,菜籽輪作中對這種肥料的採用正在擴大,這得益於聯邦政府的溫室氣體減排補助。在墨西哥,這種肥料主要用於溫室蔬菜種植,出口產品需要零殘留認證。
預計到2031年,亞太地區的複合年成長率將達到8.07%,是所有地區中成長最快的。在日本,對作物科學的補貼和嚴格的回收文化正在推動水稻和溫室蔬菜向可生物分解包膜的過渡。在中國,江蘇和山東兩省在「十四五」規劃架構下進行的試點計畫對過量使用氮肥進行處罰,鼓勵小麥和玉米種植者改用規範的複合肥。在澳大利亞,包膜氮磷鉀肥正被用於園藝和草坪種植,以控制肥料滲入珊瑚礁流域,但由於人們對保存期限和支持體系的局限性的擔憂,這種肥料在東南亞地區的推廣應用受到阻礙。
在歐洲,由於2019/1009號法規將2028年設定為生物分解肥料的最後期限,包膜性肥料肥料,但由於監管執法不力以及生物聚合物供應有限,俄羅斯的採用速度仍然落後。南美洲則呈現出選擇性使用的情況,巴西的甘蔗和大豆農場使用包膜複合肥來節省勞動力,但由於宏觀經濟波動,阿根廷的投資正在放緩。中東和非洲仍然是新興市場,以色列、土耳其和南非的高價值出口導向園藝產業推動了部分地區的包膜肥料採用。在這些地區,水資源短缺加劇了對精準養分管理的需求。
其他好處:
- Excel格式的市場預測(ME)表
- 3個月的分析師支持
目錄
第1章:引言
- 研究假設和市場定義
- 調查範圍
第2章:調查方法
第3章執行摘要
第4章 市場狀況
- 市場概覽
- 市場促進因素
- 在有關化肥徑流的法規背景下,需要提高養分利用效率。
- 政府激勵措施促進碳中和精準營養
- 對微塑膠塗層的監管禁令
- 透過減少申請次數來最佳化成本。
- 與配備感測器的智慧施肥系統整合
- 與向再生農業轉型和土壤健康相關的關鍵績效指標
- 市場限制因素
- 優質產品定價與傳統NPK定價的比較
- 小規模農業系統中農民的意識程度較低
- 縮短生物基塗料在潮濕熱帶地區的使用壽命。
- 擴大生物聚合物供應鏈規模面臨的挑戰
- 監理情勢
- 技術展望
- 波特五力分析
第5章 市場規模與成長預測
- 按作物類型
- 穀物和穀類
- 豆類和油籽
- 經濟作物
- 水果和蔬菜
- 草坪和觀賞植物
- 按地區
- 北美洲
- 美國
- 加拿大
- 墨西哥
- 其他北美國家
- 南美洲
- 巴西
- 阿根廷
- 其他南美國家
- 歐洲
- 德國
- 英國
- 法國
- 荷蘭
- 俄羅斯
- 其他歐洲國家
- 亞太地區
- 中國
- 日本
- 澳洲
- 其他亞太國家
- 中東
- 土耳其
- 沙烏地阿拉伯
- 其他中東國家
- 非洲
- 南非
- 其他非洲國家
- 北美洲
第6章 競爭情勢
- 市場集中度
- 策略趨勢
- 市佔率分析
- 公司簡介
- Haifa Group
- ICL Group Ltd.
- JR Simplot Company
- Nutrien Ltd.
- DeltaChem GmbH
- Florikan ESA LLC
- Yara International ASA
- Koch Industries Inc.
- Pursell Agritech, LLC
- Knox Fertilizer Company, Inc.
- Grupa Azoty SA
- Kingenta Ecological Engineering Co., Ltd.
- The Mosaic Company
- Lebanon Seaboard Corporation
- GreenBest Ltd.
第7章 市場機會與未來展望
According to Mordor Intelligence, the bio-degradable polymer coated NPK market size in 2026 is estimated at USD 497.12 million, growing from 2025 value of USD 470.23 million with 2031 projections showing USD 656.2 million, growing at 5.72% CAGR over 2026-2031.
This report is Segmented by Type (Grains and Cereals, Pulses and Oilseeds, Commercial Crops, Fruits and Vegetables, and Turfs and Ornamentals), and Geography (North America, Europe, Asia-Pacific, and More). The Market Forecasts are Provided in Terms of Value (USD) and Volume in (Metric Tons).
Global Bio-degradable Polymer Coated NPK Market Trends and Insights
Need to Raise Nutrient-Use Efficiency Amid Fertilizer-Runoff Caps
Escalating nitrogen and phosphorus discharge limits compel growers to match nutrient release with crop uptake windows. The United States Environmental Protection Agency has tightened Total Maximum Daily Load allocations across Midwestern watersheds, prompting corn and soybean producers to cut leaching or face penalties . Bio-degradable polymer coatings lengthen release to as much as 180 days, allowing 15-25% fertilizer rate reductions without yield loss. Comparable rules under the European Union Nitrates Directive accelerate the switch in Germany, France, and the Netherlands, where CEN/TS 17700 verification confirms controlled-release performance. Consequently, institutional pressure, rather than voluntary stewardship, now drives adoption in intensive production systems.
Government Incentives for Carbon-Smart and Precision Nutrition
Public funding lowers growers' payback periods on coated NPK purchases. The United States Department of Agriculture earmarked funds for climate-smart commodity pilots that include controlled-release inputs. Taiwan covers up to 30% of the farm-gate cost when growers document emission cuts . Washington State reimburses USD 50 per acre for compliant products, pushing specialty-crop nutrition toward biodegradable coatings. These incentives compress payback periods for growers, making the economics of bio-degradable coated NPK competitive with conventional options in regions where carbon credits or sustainability premiums are accessible. The strategic implication is that markets with robust public support will see faster penetration rates, while regions lacking subsidy frameworks will lag until coating costs decline through scale economies.
Premium Pricing Versus Conventional NPK
Bio-degradable polymer coated NPK typically commands a 20 to 40% price premium over conventional granular fertilizers, creating an adoption barrier in price-sensitive markets. Smallholder farmers in South Asia and sub-Saharan Africa, who operate on razor-thin margins and lack access to credit, prioritize upfront cost over long-term efficiency gains. A 2024 survey by the International Fertilizer Development Center found that only 12% of smallholder maize growers in Kenya were willing to pay more than a 15% premium for controlled-release products, even when extension agents demonstrated yield benefits. Until production volumes rise and raw material costs fall, adoption tends to skew toward large operations and high-value crops.
Other drivers and restraints analyzed in the detailed report include:
- Regulatory Bans on Micro-Plastic Coatings
- Cost Optimization via Reduced Application Rounds
- Limited Farmer Awareness in Smallholder Systems
For complete list of drivers and restraints, kindly check the Table Of Contents.
Segment Analysis
Grains and cereals generated 44.30% of 2025 revenue, confirming their status as the core consumption base for the bio-degradable polymer coated NPK market. Extensive university field trials on wheat, rice, and corn validate 15-25% nitrogen savings at parity yields, strengthening the case for premium inputs. Large agribusinesses integrate coated NPK with variable-rate seeders to reduce the number of side-dress passes and mitigate runoff fines. Grains also benefit from policies that peg crop insurance to documented nutrient stewardship, turning compliance into a revenue-protection tactic. Pulses and oilseeds are trailing grains but are moving steadily upward as export buyers require stewardship audits on soybeans and chickpeas. Commercial crops, such as sugarcane, coffee, and cotton, utilize coated NPK, enabling estates to amortize costs and document soil health improvements for certification premiums.
Turf and ornamentals represent a smaller value pool today but are on track for a 7.45% CAGR, the highest among segments. Municipalities mandate low-runoff landscaping, and professional contractors absorb price premiums in exchange for labor savings, as one application can cover an entire growing season. Sports venues, golf courses, and campus grounds departments are increasingly specifying products verified under ISO 14001 environmental management, reinforcing demand elasticity and accelerating technological turnover. Fruits and vegetables remain niche users. Uptake is concentrated in controlled environments where nutrient precision has a direct influence on grade and shelf life.
Complete Report Scope:
- By Crop Type
- Grains and Cereals
- Pulses and Oilseeds
- Commercial Crops
- Fruits and Vegetables
- Turf and Ornamentals
- By Geography
- North America
- United States
- Canada
- Mexico
- Rest of North America
- South America
- Brazil
- Argentina
- Rest of South America
- Europe
- Germany
- United Kingdom
- France
- Netherlands
- Russia
- Rest of Europe
- Asia-Pacific
- China
- Japan
- Australia
- Rest of Asia-Pacific
- Middle East
- Turkey
- Saudi Arabia
- Rest of Middle East
- Africa
- South Africa
- Rest of Africa
- North America
Geography Analysis
North America held a 33.40% share of the bio-degradable polymer coated NPK market in 2025, underpinned by EPA runoff regulation and incentive schemes that reimburse compliant inputs. United States corn and soybean farms averaging over 400 hectares amortize price premiums through lower labor and fuel outlays. Canada scales adoption in canola rotations, supported by federal greenhouse-gas reduction payments. Mexico's use centers on export-oriented greenhouse vegetables whose buyers demand residue-free certifications.
The Asia-Pacific region is projected to post an 8.07% CAGR through 2031, the fastest regional pace. Japan's crop-science subsidies and strict recycling culture push rice and greenhouse vegetables toward bio-degradable coatings. China's 14th Five-Year Plan pilots in Jiangsu and Shandong penalize excess nitrogen, prompting wheat and corn growers to switch to compliant blends. Australia applies coated NPK in horticulture and turf to curb leaching into reef catchments, whereas concerns over shelf life and limited extension reach hinder the uptake in Southeast Asia.
Europe accelerates because Regulation 2019/1009 sets a 2028 biodegradability deadline. Germany, France, and the Netherlands deploy coated fertilizers in intensive vegetable and potato farms, whereas Russia lags due to weaker enforcement and a scarce supply of bio-polymer. South America sees selective use, Brazilian sugarcane and soy estates leverage coated NPK for labor savings, whereas Argentina's macro volatility slows investment. The Middle East and Africa remain emergent, with high-value export horticulture in Israel, Turkey, and South Africa driving pocket adoption, where water scarcity elevates the need for nutrient precision.
- Haifa Group
- ICL Group Ltd.
- J.R. Simplot Company
- Nutrien Ltd.
- DeltaChem GmbH
- Florikan ESA LLC
- Yara International ASA
- Koch Industries Inc.
- Pursell Agritech, LLC
- Knox Fertilizer Company, Inc.
- Grupa Azoty S.A.
- Kingenta Ecological Engineering Co., Ltd.
- The Mosaic Company
- Lebanon Seaboard Corporation
- GreenBest Ltd.
Additional Benefits:
- The market estimate (ME) sheet in Excel format
- 3 months of analyst support
TABLE OF CONTENTS
1 Introduction
- 1.1 Study Assumptions and Market Definition
- 1.2 Scope of the Study
2 Research Methodology
3 Executive Summary
4 Market Landscape
- 4.1 Market Overview
- 4.2 Market Drivers
- 4.2.1 Need to raise nutrient-use efficiency amid fertilizer-runoff caps
- 4.2.2 Government incentives for carbon-smart and precision nutrition
- 4.2.3 Regulatory bans on micro-plastic coatings
- 4.2.4 Cost-optimization via reduced application rounds
- 4.2.5 Integration with sensor-enabled smart fertilization systems
- 4.2.6 Shift toward regenerative farming and soil-health KPIs
- 4.3 Market Restraints
- 4.3.1 Premium pricing versus conventional NPK
- 4.3.2 Limited farmer awareness in smallholder systems
- 4.3.3 Shorter shelf-life of bio-based coatings in humid tropics
- 4.3.4 Scale-up challenges for bio-polymer supply chains
- 4.4 Regulatory Landscape
- 4.5 Technological Outlook
- 4.6 Porter's Five Forces Analysis
- 4.6.1 Bargaining Power of Suppliers
- 4.6.2 Bargaining Power of Buyers
- 4.6.3 Threat of New Entrants
- 4.6.4 Threat of Substitutes
- 4.6.5 Intensity of Competitive Rivalry
5 Market Size and Growth Forecasts
- 5.1 By Crop Type
- 5.1.1 Grains and Cereals
- 5.1.2 Pulses and Oilseeds
- 5.1.3 Commercial Crops
- 5.1.4 Fruits and Vegetables
- 5.1.5 Turf and Ornamentals
- 5.2 By Geography
- 5.2.1 North America
- 5.2.1.1 United States
- 5.2.1.2 Canada
- 5.2.1.3 Mexico
- 5.2.1.4 Rest of North America
- 5.2.2 South America
- 5.2.2.1 Brazil
- 5.2.2.2 Argentina
- 5.2.2.3 Rest of South America
- 5.2.3 Europe
- 5.2.3.1 Germany
- 5.2.3.2 United Kingdom
- 5.2.3.3 France
- 5.2.3.4 Netherlands
- 5.2.3.5 Russia
- 5.2.3.6 Rest of Europe
- 5.2.4 Asia-Pacific
- 5.2.4.1 China
- 5.2.4.2 Japan
- 5.2.4.3 Australia
- 5.2.4.4 Rest of Asia-Pacific
- 5.2.5 Middle East
- 5.2.5.1 Turkey
- 5.2.5.2 Saudi Arabia
- 5.2.5.3 Rest of Middle East
- 5.2.6 Africa
- 5.2.6.1 South Africa
- 5.2.6.2 Rest of Africa
- 5.2.1 North America
6 Competitive Landscape
- 6.1 Market Concentration
- 6.2 Strategic Moves
- 6.3 Market Share Analysis
- 6.4 Company Profiles (Includes Global Level Overview, Market Level Overview, Core Segments, Financials as Available, Strategic Information, Market Rank/Share for Key Companies, Products and Services, and Recent Developments)
- 6.4.1 Haifa Group
- 6.4.2 ICL Group Ltd.
- 6.4.3 J.R. Simplot Company
- 6.4.4 Nutrien Ltd.
- 6.4.5 DeltaChem GmbH
- 6.4.6 Florikan ESA LLC
- 6.4.7 Yara International ASA
- 6.4.8 Koch Industries Inc.
- 6.4.9 Pursell Agritech, LLC
- 6.4.10 Knox Fertilizer Company, Inc.
- 6.4.11 Grupa Azoty S.A.
- 6.4.12 Kingenta Ecological Engineering Co., Ltd.
- 6.4.13 The Mosaic Company
- 6.4.14 Lebanon Seaboard Corporation
- 6.4.15 GreenBest Ltd.
7 Market Opportunities and Future Outlook

 富含抗氧化劑的果油市場規模、佔有率和成長分析:按原料水果、萃取方法、終端用戶產業、銷售管道和地區分類-2026-2033年產業預測
 美國可生物分解緩釋肥料:市場佔有率分析、產業趨勢和統計數據以及成長預測(2026-2031 年)歐洲緩效肥料:市場佔有率分析、產業趨勢與統計及成長預測(2026-2031 年)美國緩釋肥料:市場佔有率分析、行業趨勢和統計數據以及成長預測(2026-2031 年)中國緩釋肥料:市場佔有率分析、產業趨勢與統計及成長預測(2026-2031年)北美緩釋肥料:市佔率分析、產業趨勢與統計及成長預測(2026-2031 年)
 2026 年至 2035 年緩釋肥料市場的商業機會、成長要素、產業趨勢與預測。
 全球種子與肥料處理市場(2025-2032 年)控釋肥料(CRF):市佔率分析、產業趨勢與統計、成長預測(2026-2031)
 2026年全球緩釋肥料市場報告