


 |
市場調查報告書
商品編碼
1940834
控釋肥料(CRF):市佔率分析、產業趨勢與統計、成長預測(2026-2031)Controlled Release Fertilizers - Market Share Analysis, Industry Trends & Statistics, Growth Forecasts (2026 - 2031) |
||||||
※ 本網頁內容可能與最新版本有所差異。詳細情況請與我們聯繫。
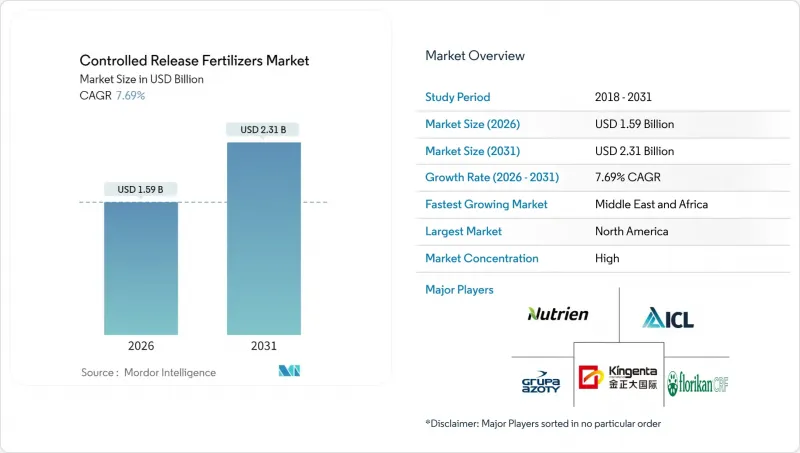
預計到 2026 年,控釋肥料(CRF) 市場價值將達到 15.9 億美元,從 2025 年的 14.8 億美元成長到 2031 年的 23.1 億美元。
預計2026年至2031年年複合成長率(CAGR)為7.69%。
精準養分管理策略的推廣應用,旨在提高產量、減少養分流失並滿足日益嚴格的環境法規要求。聚合物塗層技術正在引領技術發展趨勢,而數位農業平台則透過將即時土壤數據與客製化的養分釋放方案相結合,創造新的價值。區域性水資源短缺促使農民轉向更有效率的養分利用產品,而政府獎勵措施則加速了大規模農地種植者對這些產品的採用。目前市場競爭程度適中,這為開發可生物分解塗層和數據驅動決策工具的創新者留下了發展空間。
全球控釋肥料(CRF)市場趨勢及洞察
與精密農業技術的融合
可變施肥裝置將控釋肥料與即時土壤養分圖同步,使農民能夠根據田間微環境調整肥料包膜厚度和釋放曲線。這種整合減少了過度施肥和施肥不足的情況,提高了養分利用效率,並延長了產品的使用壽命。設備製造商將農藝建議與地理空間分析相結合,使控釋肥料市場參與企業融入更廣泛的數位生態系統。大型農場可以透過節省勞動力和遵守環保法規來獲得積分,從而形成良性循環,穩步擴大基本客群。
環境法規和永續性要求正在重塑標準。
歐洲「從農場到餐桌」策略已將控釋肥料列為優先投入品,以實現超過80%的氮肥利用率。 2024年生物分解條款催生了一個價值2億美元的利基市場,該市場專注於可在12-18個月內安全分解的塗層肥料。這一趨勢目前也影響著北美和新興亞洲地區的標籤檢視。監管合規獎勵,例如放寬緩衝區要求,降低了控釋肥料的總擁有成本,使其低於傳統肥料。因此,控釋肥料(CRF)市場與評估可衡量永續性成果的政策架構日益契合。
高昂的生產成本和價格溢價是廣泛採用的障礙。
聚合物包膜性肥料的售價通常是傳統肥料的兩到三倍,而包膜樹脂的價格與波動劇烈的石油原料價格密切相關,預計2024年石油原料價格將波動15%至25%。利潤微薄的小規模農戶往往不願採用化肥,即使化肥承諾能帶來終身成本節約。生產商正在建立社區混合化肥廠以降低物流成本,並引入「按英畝收費」的服務模式以降低前期成本。隨著規模經濟的成熟,這些措施或許有助於消除使用障礙。
細分市場分析
截至2025年,聚合物包膜產品將佔據控釋肥料( CRF)市場75.92%的佔有率,成為市場規模成長的主要驅動力,並將在2031年之前以7.84%的複合年成長率持續成長。其受歡迎程度源自於其精準的養分釋放動態,能夠與變數施肥設備無縫銜接。持續的研究已成功實現了在不影響耐久性的前提下降低包膜厚度,從而提高了成本效益和田間作業效果。可在18個月內分解的生物分解型產品現已符合歐盟標準,為此前因擔心聚合物殘留而猶豫不決的新客戶群打開了市場。
聚合物-硫混合物在一些對硫養分持續供應尤為重要的特定領域中發揮作用,尤其是在面臨土壤硫流失的油籽產區。這種混合物能夠同步輸送主要和次要養分,從而減少施肥頻率。蠟和樹脂包覆在注重性價比的管道中持續得到應用,在這些管道中,預算限制比精準施肥更為重要。這些產品類別共同豐富了產品組合,幫助供應商應對不同地區的農業實際情況。
控釋肥料(CRF)市場報告按包膜類型(聚合物包膜、聚合物硫包膜及其他)、作物類型(田間作物、園藝作物、草坪及觀賞植物)和地區(亞太地區、歐洲、中東和非洲、北美、南美)進行細分。市場預測以價值(美元)和數量(公噸)為單位。
區域分析
2025年,北美將佔據控釋肥料(CRF)市場40.86%的佔有率,這得益於先進的精密農業基礎設施和監管成本分攤計劃,這些計劃對高效利用養分的投入品進行補貼。在美國,生產商受益於美國環保署(EPA)的流域指南,該指南將控釋產品歸類為最佳管理實務(BMP),符合合規積分的條件。在加拿大,永續農業舉措(SAI)已承諾投入1.5億加元(約1.11億美元)用於促進傳統農地的轉型,加速草原穀物帶和園藝產業叢集地區的推廣應用。
受水資源短缺導致低徑流產品需求增加的推動,中東和非洲市場預計將以7.97%的複合年成長率快速成長至2031年。然而,價格高度敏感和缺乏諮詢網路對即時銷售擴張構成挑戰。在拉丁美洲,大規模甘蔗和柑橘種植園正在創造新的機遇,區域經銷商正透過增加控釋肥料(CRF)產品線來拓展產品系列。
亞太地區正經歷顯著成長,這主要得益於中國23億美元的精密農業獎勵策略以及印度為提升糧食安全而對養分利用效率的重視。該地區各國政府的措施包括設備融資方案、對農業工程師的支持、控釋肥料(CRF)折扣以及示範田的建設,以鼓勵推廣應用。歐洲控釋肥料(CRF)市場更著重與歐洲綠色交易保持一致,而非追求銷售擴張。通用農業政策(CAP)的生態計畫支付機制可報銷高達70%的額外成本,用於減少經證實有效的養分流失,從而有效抵消了許多耕地農場的溢價。
其他福利:
- Excel格式的市場預測(ME)表
- 3個月的分析師支持
目錄
第1章 引言
- 研究假設和市場定義
- 調查範圍
- 調查方法
第2章 報告
第3章執行摘要和主要發現
第4章:主要產業趨勢
- 主要農作物種植面積
- 田間作物
- 園藝作物
- 平均施肥量
- 宏量營養素
- 田間作物
- 園藝作物
- 宏量營養素
- 法律規範
- 價值鍊和通路分析
- 市場促進因素
- 與精密農業技術的融合
- 環境法規與永續性義務
- 水資源短缺與灌溉效率
- 降低人力成本並簡化申請流程
- 氣候變遷調適與作物抗逆性
- 糧食安全與生產力最佳化
- 市場限制
- 高生產成本和價格溢價
- 農民缺乏意識和技術差距
- 由於擔心塗層顆粒剝落,正在遊說要求實現塗層可追溯性。
- 通貨膨脹導致聚合物成本飆升,對緩釋肥生產商的利潤率帶來壓力。
第5章 市場規模及成長預測(價值及數量)
- 塗層類型
- 聚合物塗層
- 聚合物和硫塗層
- 其他
- 作物類型
- 田間作物
- 園藝作物
- 草坪和觀賞植物
- 地區
- 亞太地區
- 澳洲
- 孟加拉
- 中國
- 印度
- 印尼
- 日本
- 巴基斯坦
- 菲律賓
- 泰國
- 越南
- 亞太其他地區
- 歐洲
- 法國
- 德國
- 義大利
- 荷蘭
- 俄羅斯
- 西班牙
- 烏克蘭
- 英國
- 其他歐洲地區
- 中東和非洲
- 奈及利亞
- 沙烏地阿拉伯
- 南非
- 土耳其
- 其他中東和非洲地區
- 北美洲
- 加拿大
- 墨西哥
- 美國
- 北美其他地區
- 南美洲
- 阿根廷
- 巴西
- 南美洲其他地區
- 亞太地區
第6章 競爭情勢
- 關鍵策略舉措
- 市佔率分析
- 公司概況
- 公司簡介。
- Ekompany International BV(DeltaChem)
- Grupa Azoty SA(Compo Expert)
- Haifa Group
- ICL Group Ltd
- Mivena BV
- Nutrien Ltd.
- Kingenta Ecological Engineering Group Co., Ltd.
- New Mountain Capital(Florikan)
第7章:CEO們需要思考的關鍵策略問題
The controlled release fertilizers market size in 2026 is estimated at USD 1.59 billion, growing from 2025 value of USD 1.48 billion with 2031 projections showing USD 2.31 billion, growing at 7.69% CAGR over 2026-2031.
Adoption rides on precision nutrient management strategies that improve yield, curb nutrient loss, and align with tightening environmental regulations. Polymer-based coatings shape the technology landscape, while digital farming platforms create new value by linking real-time soil data with customized nutrient release schedules. Regional water scarcity pushes growers toward nutrient-efficient products, and government incentives accelerate uptake among large field-crop operations. Competitive intensity remains moderate, leaving room for innovators developing biodegradable coatings and data-driven decision tools.
Global Controlled Release Fertilizers Market Trends and Insights
Precision Agriculture Technology Integration
Variable-rate applicators now synchronize controlled release fertilizers with real-time soil nutrient maps, allowing growers to match coating thickness and release curves to micro-field conditions. Such orchestration reduces over- or under-fertilization events, boosts nutrient use efficiency, and extends product life cycles. Equipment makers bundle agronomic advisory and geospatial analytics, positioning controlled release fertilizers market participants in a broader digital ecosystem. Larger farms capture labor savings and environmental compliance credits, creating a reinforcing adoption loop that steadily expands the customer base.
Environmental Regulations and Sustainability Mandates Reshape Standards
Europe's Farm to Fork Strategy classifies controlled release products as preferred inputs for achieving nitrogen use-efficiency benchmarks above 80%. The 2024 biodegradability clause spurred a USD 200 million niche for coatings that safely decompose within 12-18 months, a trend now influencing labels in North America and emerging Asia. Compliance incentives, such as reduced buffer-zone requirements, lower the total cost of ownership relative to conventional fertilizers. Consequently, the controlled release fertilizers market is increasingly entwined with policy frameworks that reward measurable sustainability outcomes.
High Production Costs and Price Premium Barriers Constrain Penetration
Polymer-coated fertilizers typically sell at two to three times the price of conventional products, and coating resins track volatile petroleum input costs that swung 15-25% in 2024. Smallholders operating on tight margins hesitate to adopt even when lifetime savings appear favorable. Producers respond with localized blending plants to cut logistics costs and with pay-per-acre service models to alleviate upfront expenditure. These moves could soften the restraint once economies of scale mature.
Other drivers and restraints analyzed in the detailed report include:
- Water Scarcity and Irrigation Efficiency Requirements Accelerate Adoption
- Labor Cost Reduction and Application Convenience Transform Farm Operations
- Limited Farmer Awareness and Technical Knowledge Gaps Impede Adoption
For complete list of drivers and restraints, kindly check the Table Of Contents.
Segment Analysis
Polymer-coated products held 75.92% of the controlled release fertilizer market share in 2025 and contributed the bulk of the controlled release fertilizer market size growth, progressing at a 7.84% CAGR through 2031. Their popularity stems from precise nutrient-release kinetics that integrate seamlessly with variable-rate applicators. Continuous research is lowering coating thickness without compromising durability, improving cost ratios, and field performance. Biodegradable variants that decompose within 18 months now meet European Union standards, bringing new customer segments that formerly resisted polymer accumulation concerns.
Polymer-sulfur hybrids play a niche role where extended sulfur nutrition is critical, particularly in oilseed belts facing soil sulfur depletion. The combination lowers input counts by co-delivering macro- and secondary nutrients over synchronized timelines. Wax and resin coatings remain in value-oriented channels where tight budgets override the need for high-precision release. These categories together provide portfolio breadth that helps suppliers address diverse regional agronomic realities.
The Controlled Release Fertilizers Market Report is Segmented by Coating Type (Polymer Coated, Polymer-Sulfur Coated, and Others), Crop Type (Field Crops, Horticultural Crops, and Turf and Ornamental), and Geography (Asia-Pacific, Europe, The Middle East and Africa, North America, and South America). The Market Forecasts are Provided in Terms of Value (USD) and Volume (Metric Tons).
Geography Analysis
North America accounted for a 40.86% share of the controlled release fertilizers market in 2025, supported by advanced precision agriculture infrastructure and regulatory cost-share programs that subsidize nutrient-efficient inputs. In the United States, growers benefit from Environmental Protection Agency (EPA) watershed guidelines, which classify controlled release products as best-management practices eligible for compliance credits. In Canada, the Sustainable Agriculture Initiative allocated CAD 150 million (USD 111 million) to facilitate the conversion of conventional acres, accelerating adoption in prairie grain belts and horticultural clusters.
The Middle East and Africa markets are projected to grow at a fastest CAGR of 7.97% through 2031, driven by water scarcity, which increases interest in low-leach products. However, price sensitivity and limited advisory networks pose challenges to immediate volume growth. Latin America's large sugarcane and citrus holdings present emerging opportunities as regional distributors expand their portfolios by adding controlled release fertilizers lines.
The Asia-Pacific region is experiencing significant growth, driven by China's USD 2.3 billion precision agriculture stimulus and India's focus on nutrient-use efficiency to enhance national food security. Government initiatives in the region include bundling equipment loans, agronomist support, and discounts on controlled release fertilizers, which create demonstration plots to accelerate adoption. Europe's controlled release fertilizers market emphasizes compliance with the European Green Deal rather than volumetric expansion. Eco-scheme payments under the Common Agricultural Policy now reimburse up to 70% of incremental costs for proven nutrient-loss reductions, effectively offsetting the price premium for many arable farms.
- Ekompany International BV (DeltaChem)
- Grupa Azoty S.A. (Compo Expert)
- Haifa Group
- ICL Group Ltd
- Mivena BV
- Nutrien Ltd.
- Kingenta Ecological Engineering Group Co., Ltd.
- New Mountain Capital (Florikan)
Additional Benefits:
- The market estimate (ME) sheet in Excel format
- 3 months of analyst support
TABLE OF CONTENTS
1 INTRODUCTION
- 1.1 Study Assumptions & Market Definition
- 1.2 Scope of the Study
- 1.3 Research Methodology
2 REPORT OFFERS
3 EXECUTIVE SUMMARY AND KEY FINDINGS
4 KEY INDUSTRY TRENDS
- 4.1 Acreage Of Major Crop Types
- 4.1.1 Field Crops
- 4.1.2 Horticultural Crops
- 4.2 Average Nutrient Application Rates
- 4.2.1 Primary Nutrients
- 4.2.1.1 Field Crops
- 4.2.1.2 Horticultural Crops
- 4.2.1 Primary Nutrients
- 4.3 Regulatory Framework
- 4.4 Value Chain & Distribution Channel Analysis
- 4.5 Market Drivers
- 4.5.1 Precision agriculture technology integration
- 4.5.2 Environmental regulations and sustainability mandates
- 4.5.3 Water scarcity and irrigation efficiency
- 4.5.4 Labor cost reduction and application convenience
- 4.5.5 Climate change adaptation and crop resilience
- 4.5.6 Food security and productivity optimization
- 4.6 Market Restraints
- 4.6.1 High production costs and price premium
- 4.6.2 Limited farmer awareness and technical gaps
- 4.6.3 Microparticle-shedding concerns triggering lobbying for coating traceability
- 4.6.4 Inflation-driven polymer cost spikes squeezing CRF producer margins
5 MARKET SIZE AND GROWTH FORECASTS (VALUE AND VOLUME)
- 5.1 Coating Type
- 5.1.1 Polymer Coated
- 5.1.2 Polymer-Sulfur Coated
- 5.1.3 Others
- 5.2 Crop Type
- 5.2.1 Field Crops
- 5.2.2 Horticultural Crops
- 5.2.3 Turf & Ornamental
- 5.3 Region
- 5.3.1 Asia-Pacific
- 5.3.1.1 Australia
- 5.3.1.2 Bangladesh
- 5.3.1.3 China
- 5.3.1.4 India
- 5.3.1.5 Indonesia
- 5.3.1.6 Japan
- 5.3.1.7 Pakistan
- 5.3.1.8 Philippines
- 5.3.1.9 Thailand
- 5.3.1.10 Vietnam
- 5.3.1.11 Rest of Asia-Pacific
- 5.3.2 Europe
- 5.3.2.1 France
- 5.3.2.2 Germany
- 5.3.2.3 Italy
- 5.3.2.4 Netherlands
- 5.3.2.5 Russia
- 5.3.2.6 Spain
- 5.3.2.7 Ukraine
- 5.3.2.8 United Kingdom
- 5.3.2.9 Rest of Europe
- 5.3.3 Middle East & Africa
- 5.3.3.1 Nigeria
- 5.3.3.2 Saudi Arabia
- 5.3.3.3 South Africa
- 5.3.3.4 Turkey
- 5.3.3.5 Rest of Middle East & Africa
- 5.3.4 North America
- 5.3.4.1 Canada
- 5.3.4.2 Mexico
- 5.3.4.3 United States
- 5.3.4.4 Rest of North America
- 5.3.5 South America
- 5.3.5.1 Argentina
- 5.3.5.2 Brazil
- 5.3.5.3 Rest of South America
- 5.3.1 Asia-Pacific
6 COMPETITIVE LANDSCAPE
- 6.1 Key Strategic Moves
- 6.2 Market Share Analysis
- 6.3 Company Landscape
- 6.4 Company Profiles (Includes Global Level Overview, Market Level Overview, Core Business Segments, Financials, Headcount, Key Information, Market Rank, Market Share, Products and Services, and Analysis of Recent Developments).
- 6.4.1 Ekompany International BV (DeltaChem)
- 6.4.2 Grupa Azoty S.A. (Compo Expert)
- 6.4.3 Haifa Group
- 6.4.4 ICL Group Ltd
- 6.4.5 Mivena BV
- 6.4.6 Nutrien Ltd.
- 6.4.7 Kingenta Ecological Engineering Group Co., Ltd.
- 6.4.8 New Mountain Capital (Florikan)
7 KEY STRATEGIC QUESTIONS FOR FERTILIZER CEOS
 北美緩釋肥料:市佔率分析、產業趨勢與統計及成長預測(2026-2031 年)
 2026 年至 2035 年緩釋肥料市場的商業機會、成長要素、產業趨勢與預測。
 全球種子與肥料處理市場(2025-2032 年)
 2026年全球緩釋肥料市場報告控釋肥料市場-2026-2031年預測
 非農業用控制釋放肥料顆粒市場(依配方類型、養分機制、成分、應用、最終用戶和通路分類),全球預測(2026-2032年)
 緩釋性肥料市場規模、佔有率及成長分析(按類型、應用方法、最終用途及地區分類)-2026-2033年產業預測
 控釋肥料市場-全球產業規模、佔有率、趨勢、機會和預測,按類型、最終用途、應用方式、地區和競爭格局分類,2020-2030年預測
 全球控釋肥料(CRF)市場按類型、功能、產品等級、應用方法、最終用途和地區分類-預測至2030年包衣肥料市場-全球產業規模、佔有率、趨勢、機會和預測(按類型、作物類型、地區和競爭情況分類,2020-2030 年)