


 |
市場調查報告書
商品編碼
2113826
美國農業灌溉機械:市場佔有率分析、產業趨勢與統計、成長預測(2026-2031)United States Agricultural Irrigation Machinery - Market Share Analysis, Industry Trends & Statistics, Growth Forecasts (2026 - 2031) |
||||||

※ 本網頁內容可能與最新版本有所差異。詳細情況請與我們聯繫。
根據 Mordor Intelligence 預測,美國農業灌溉機械市場規模將從 2025 年的 21 億美元成長到 2026 年的 22.2 億美元,然後在 2031 年達到 29 億美元,2026 年至 2031 年的複合年成長率為 5.54%。
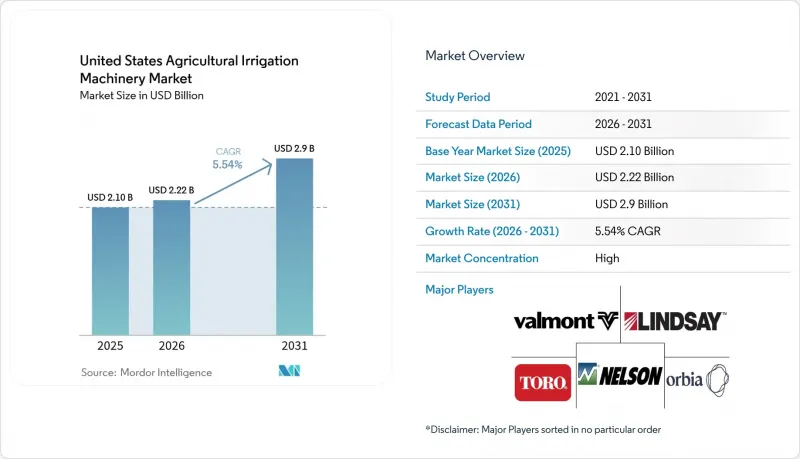
本報告按灌溉方式(噴水灌溉、滴灌、中心支軸式噴灌及其他灌溉方式)和應用領域(糧食作物和非糧食作物)進行細分。市場預測以美元計價。
美國農業灌溉機械市場趨勢與洞察
聯邦成本分擔計劃加速了樞紐系統的更新
在2024會計年度,環境品質獎勵計畫(EQIP)提供了大量資金,支持生產者進行資本投資,用於更換漫灌系統或維修老舊的中心支軸式噴灌系統,將典型的投資回收期從八年縮短至不到四年。內布拉斯加州、堪薩斯州和科羅拉多提供的州級無息貸款與聯邦政府的支持相輔相成,為過去一年高平原地區安裝的成長提供了資金支持。這些獎勵的組合甚至擴大了500至1000英畝農場的規模,這些農場先前缺乏足夠的資金自行購買價值12萬美元的中心支軸式噴灌系統。經銷商的訂單記錄顯示,可變流量噴嘴組件的訂單有所增加,表明生產者在尋求節水效益的同時,也在努力最大限度地滿足該計劃的資格要求。然而,這項工作仍然依賴年度預算撥款,而2026年農業法案中的預算削減可能會阻礙設備升級,特別是對於沒有商業信貸額度的小規模生產者而言。因此,供應商正在加快出貨速度以應對資金籌措的不確定性,而遊說聯盟則呼籲將成本分攤上限維持到2030年。這些獎勵的重點清楚地表明了為什麼美國農業灌溉系統市場持續跑贏整體農業機械支出。
加強水資源緊張地區的用水效率需求
加州《永續地下水管理法案》規定,嚴重過度開採的流域必須在2040年前實現永續性,這實際上迫使聖華金谷的農業用水量減少20%至30%。亞利桑那州、內布拉斯加州和堪薩斯州已實施計量系統和用水量上限,對低效率的漫灌方式進行處罰,鼓勵農民轉向滴灌和噴灌,這些灌溉方式能顯著減少水分蒸發。美國農業研究署(ARS)進行的田間試驗表明,在杏仁和開心果種植中,與噴灌相比,滴灌可減少高達25%的水資源損失。監管合規的最後期限設定在2030年,這將持續推動地下噴灌系統和可變流量中心支軸式噴灌系統的維修,以提高灌溉效率。然而,由於實施情況的差異以及乾旱年份的豁免政策,目前仍存在不確定性,一些農民正在調整設備採購時間,以配合當地的里程碑節點。為此,技術供應商正在提供監控儀表板,將感測器數據轉換為合規性報告,從而滿足監管報告要求,同時提高其在美國農業灌溉系統市場的訂閱平台的用戶留存率。
大面積中心支軸式噴灌系統需要較高的初始資本支出(CAPEX)。
最新的四分之一英里可變水樞軸灌溉系統售價在9萬至20萬美元之間,相當於一個1000英畝玉米和大豆農場年總收入的15%至25%。由於農產品價格停滯不前,投資回收期可能長達10年以上,這使得農民儘管知道節水潛力巨大,卻仍猶豫不決。雖然聯邦成本分攤計畫降低了採用門檻,但在需求旺盛的地區,18至24個月的申請等待期迫使生產者要麼以商業利率資金籌措,要麼推遲實施。 Valmont和Lindsay提供的租賃方案降低了初始資金需求,但七年期利率高達6%至8%。據經銷商稱,二手設備短缺推高了標價,進一步增加了資金門檻。這些延誤波及整個美國農業灌溉系統市場,減緩了設備更新換代週期,阻礙了銷售量成長,儘管技術不斷進步。
細分市場分析
2025年,中心支軸式噴灌系統將佔據美國農業灌溉機械市場43.35%的佔有率,其次是噴灌系統。同時,滴灌雖然在耕地總面積中所佔比例較小,但發展迅速。滴灌的擴張與特色作物的成長、更嚴格的用水法規以及即使在不平坦的地形上也能保持均勻流量的技術進步相吻合。像Livlis和Toro這樣的公司正在向市場推出壓力補償式發送器和線上過濾系統,從而延長使用壽命並減少阻塞。中心支軸式噴灌在大面積平坦的農田上仍然具有成本效益,並有助於縮小與滴灌的效率差距,尤其是在配備GPS導航和可變噴嘴的情況下。主要的噴灌製造商的市場佔有率正在穩步下降,而漫灌和溝灌由於缺乏聯邦補貼,其應用也在持續減少。
預計到2031年,滴灌將以11.02%的複合年成長率(CAGR)實現最高成長,並有望成為美國農業灌溉系統市場收入成長的主要驅動力。隨著農民採用感測器控制模組以遵守地下水使用上限規定,中心支軸式噴灌系統將繼續擴張。同時,噴灌系統預計將停滯不前,漫灌的使用量預計將進一步下降。這些相對趨勢凸顯了節水政策和作物結構變化如何推動對各種灌溉方式的資本投資,並再形成主要供應商之間的競爭格局。
其他好處:
- Excel格式的市場預測(ME)表
- 3個月的分析師支持
目錄
第1章:引言
- 研究假設和市場定義
- 調查範圍
第2章:調查方法
第3章執行摘要
第4章 市場狀況
- 市場概覽
- 市場促進因素
- 聯邦政府的成本分擔計畫正在加速樞紐系統的升級改造。
- 加強監管,提高缺水地區的用水效率。
- 基於感測器的變數灌溉(VRI)控制系統迅速普及。
- 增加種植需要滴灌系統的特色果樹和堅果的面積。
- 鼓勵農場引進太陽能水泵的激勵措施正在降低營運成本。
- 自動灌溉機器人應運而生,幫助那些面臨人手不足。
- 市場限制因素
- 大面積中心樞軸式灌溉系統需要大量的初始資本支出(CAPEX)。
- 農村地區長期存在的寬頻差距限制了精準灌溉的投資報酬率。
- 農產品價格波動給農民的資金預算帶來了壓力。
- 加強奧加拉拉含水層所在各州地下水開採的監測
- 監理情勢
- 技術展望
- 波特五力分析
第5章 市場規模與成長預測
- 灌溉方法
- 噴水灌溉
- 滴灌
- 中心支線灌溉
- 其他灌溉方法
- 目的
- 食用作物
- 大田作物
- 特色水果和堅果
- 不食用作物
- 食用作物
第6章 競爭情勢
- 市場集中度
- 策略趨勢
- 市佔率分析
- 公司簡介
- Valmont Industries, Inc.
- Lindsay Corporation
- The Toro Company
- Nelson Irrigation
- Orbia(Netafim USA)
- Rivulis Irrigation Ltd.
- Rain Bird Corporation
- Deere & Company
- TL Irrigation Co.
- Reinke Manufacturing Co., Inc.
- Hunter Industries Inc.
- Komet Irrigation Corp.
- Agri-Inject, Inc.
- Cadman Power Equipment Ltd.
- Cropx Inc.
第7章 市場機會與未來展望
According to Mordor Intelligence, the United States agricultural irrigation machinery market size is expected to grow from USD 2.10 billion in 2025 to USD 2.22 billion in 2026 and is forecast to reach USD 2.90 billion by 2031 at 5.54% CAGR over 2026-2031.
This report is Segmented by Irrigation Type (Sprinkler Irrigation, Drip Irrigation, Pivot Irrigation, and Other Irrigation Types) and by Application (Food Crop and Non-Food Crop). The Market Forecasts are Provided in Terms of Value (USD).
United States Agricultural Irrigation Machinery Market Trends and Insights
Federal Cost-Share Programs Accelerating Pivot System Upgrades
In fiscal 2024, the Environmental Quality Incentives Program disbursed a significant amount to support hardware expenditures for growers that replaced flood systems or retrofitted older pivots, compressing typical payback periods from eight years to fewer than four. State-level zero-interest loans in Nebraska, Kansas, and Colorado complement the federal benefit and financed a rise in High Plains installations over the past year. The incentive mix has broadened adoption among 500- to 1,000-acre operations that previously lacked the balance-sheet strength to self-fund USD 120,000 pivots. Dealer order logs show an uptick in variable-rate nozzle packages, reflecting producers' intent to maximize program eligibility and water savings simultaneously. However, the initiative remains subject to annual appropriations, and any Farm Bill cuts after 2026 could pause upgrades, particularly for smaller growers lacking commercial credit lines. Suppliers are therefore accelerating shipments ahead of possible funding uncertainty, while lobbying coalitions seek to maintain cost-share ceilings through 2030. The thrust of these incentives underscores why the United States agricultural irrigation systems market continues to outpace broader farm machinery spending.
Rising Water-Use Efficiency Mandates in Water-Stressed States
California's Sustainable Groundwater Management Act compels critically overdrafted basins to achieve sustainability by 2040, effectively forcing a 20%-30% cut in agricultural withdrawals across the San Joaquin Valley . Arizona, Nebraska, and Kansas have introduced metering and volumetric caps that penalize inefficient flood practices, nudging growers toward drip and micro-sprinkler layouts that slash evaporation. Field trials conducted by the Agricultural Research Service show drip reducing losses by up to 25% compared with overhead sprinklers in almonds and pistachios . Compliance deadlines extend through 2030, anchoring a durable pipeline of retrofit demand for both subsurface emitters and variable-rate pivots able to document efficiency gains. Nevertheless, uneven enforcement and drought-year exemptions create uncertainty, prompting some operators to stage equipment purchases to align with local milestones. Technology vendors are responding with monitoring dashboards that convert sensor data into compliance reports, simultaneously meeting regulatory reporting needs and driving stickiness for their subscription platforms within the United States agricultural irrigation systems market.
High Upfront CAPEX for Large-Area Center Pivots
A modern quarter-mile variable-rate pivot costs USD 90,000-USD 200,000, absorbing 15%-25% of a 1,000-acre corn-soybean farm's yearly gross . When commodity prices sag, payback horizons can stretch beyond 10 years, discouraging purchases despite potential water savings. Federal cost-share programs ease barriers, but application queues run 18-24 months in high-demand districts, compelling growers either to self-finance at commercial rates or to delay. Leasing options provided by Valmont and Lindsay reduce upfront cash requirements but involve an interest rate of 6%-8% over a seven-year term. Dealers note that used equipment shortages raise sticker prices, further inflating capital hurdles. Delays ripple through the broader United States agricultural irrigation systems market, slowing replacement cycles and dampening volume growth even as technology advances.
Other drivers and restraints analyzed in the detailed report include:
- Rapid Adoption of Sensor-Based Variable-Rate Irrigation (VRI) Controls
- Increasing Acreage of Specialty Fruit and Nut Crops Requiring Drip Systems
- Chronic Rural Broadband Gaps Limiting Precision-Irrigation ROI
For complete list of drivers and restraints, kindly check the Table Of Contents.
Segment Analysis
Pivot irrigation commanded a 43.35% of the United States agricultural irrigation machinery market share in 2025, followed by sprinkler setups, while drip captured a smaller but fast-rising fraction of total acreage. Drip's expansion aligns with specialty-crop growth, rising water-use mandates, and technology that maintains uniform flow on undulating terrain. Rivulis, and The Toro Company have rolled out pressure-compensating emitters and inline filtration that extend service life and curb clogging. Pivots remain cost-effective on large, flat tracts, especially when outfitted with GPS steering and variable-rate nozzles that help narrow the efficiency gap with drip. Sprinkler big-guns are steadily displaced, and flood or furrow options continue to decline as they are ineligible for federal subsidies.
Drip is projected to log the fastest 11.02% CAGR through 2031, making it the prime engine of incremental revenue within the United States agricultural irrigation systems market size. Pivot systems will still advance, as row-crop producers adopt sensor-guided modules to comply with groundwater caps, while sprinkler rigs will stagnate and flood usage will retreat further. The relative pace underscores how conservation policy and crop-mix shifts steer capital spending across irrigation modalities, reshaping competitive focus among leading suppliers.
Complete Report Scope:
- Irrigation Type
- Sprinkler Irrigation
- Drip Irrigation
- Pivot Irrigation
- Other Irrigation Types
- Application
- Food Crops
- Row Crops
- Specialty Fruit and Nut Crops
- Non-food Crops
- Food Crops
List of Companies Covered in this Report:
- Valmont Industries, Inc.
- Lindsay Corporation
- The Toro Company
- Nelson Irrigation
- Orbia (Netafim USA)
- Rivulis Irrigation Ltd.
- Rain Bird Corporation
- Deere & Company
- T-L Irrigation Co.
- Reinke Manufacturing Co., Inc.
- Hunter Industries Inc.
- Komet Irrigation Corp.
- Agri-Inject, Inc.
- Cadman Power Equipment Ltd.
- Cropx Inc.
Additional Benefits:
- The market estimate (ME) sheet in Excel format
- 3 months of analyst support
TABLE OF CONTENTS
1 Introduction
- 1.1 Study Assumptions and Market Definition
- 1.2 Scope of the Study
2 Research Methodology
3 Executive Summary
4 Market Landscape
- 4.1 Market Overview
- 4.2 Market Drivers
- 4.2.1 Federal cost-share programs accelerating pivot system upgrades
- 4.2.2 Rising water-use efficiency mandates in water-stressed states
- 4.2.3 Rapid adoption of sensor-based variable-rate irrigation (VRI) controls
- 4.2.4 Increasing acreage of specialty fruit and nut crops requiring drip systems
- 4.2.5 On-farm solar-powered pump incentives lowering operating costs
- 4.2.6 Emergence of autonomous irrigation robots for labor-constrained farms
- 4.3 Market Restraints
- 4.3.1 High upfront CAPEX for large-area center pivots
- 4.3.2 Chronic rural broadband gaps limiting precision-irrigation ROI
- 4.3.3 Volatility in agricultural commodity prices squeezing farm capital budgets
- 4.3.4 Increasing scrutiny of groundwater withdrawals in Ogallala Aquifer states
- 4.4 Regulatory Landscape
- 4.5 Technological Outlook
- 4.6 Porter's Five Forces Analysis
- 4.6.1 Bargaining Power of Suppliers
- 4.6.2 Bargaining Power of Buyers
- 4.6.3 Threat of New Entrants
- 4.6.4 Threat of Substitutes
- 4.6.5 Intensity of Competitive Rivalry
5 Market Size and Growth Forecasts (Value)
- 5.1 Irrigation Type
- 5.1.1 Sprinkler Irrigation
- 5.1.2 Drip Irrigation
- 5.1.3 Pivot Irrigation
- 5.1.4 Other Irrigation Types
- 5.2 Application
- 5.2.1 Food Crops
- 5.2.1.1 Row Crops
- 5.2.1.2 Specialty Fruit and Nut Crops
- 5.2.2 Non-food Crops
- 5.2.1 Food Crops
6 Competitive Landscape
- 6.1 Market Concentration
- 6.2 Strategic Moves
- 6.3 Market Share Analysis
- 6.4 Company Profiles (Includes Global Level Overview, Market Level Overview, Core Segments, Financials as Available, Strategic Information, Market Rank/Share for Key Companies, Products and Services, and Recent Developments)
- 6.4.1 Valmont Industries, Inc.
- 6.4.2 Lindsay Corporation
- 6.4.3 The Toro Company
- 6.4.4 Nelson Irrigation
- 6.4.5 Orbia (Netafim USA)
- 6.4.6 Rivulis Irrigation Ltd.
- 6.4.7 Rain Bird Corporation
- 6.4.8 Deere & Company
- 6.4.9 T-L Irrigation Co.
- 6.4.10 Reinke Manufacturing Co., Inc.
- 6.4.11 Hunter Industries Inc.
- 6.4.12 Komet Irrigation Corp.
- 6.4.13 Agri-Inject, Inc.
- 6.4.14 Cadman Power Equipment Ltd.
- 6.4.15 Cropx Inc.
7 Market Opportunities and Future Outlook

 2026-2030年全球自動化灌溉系統市場
 人工智慧驅動的灌溉控制系統市場預測至2034年-全球分析(按感測器類型、灌溉系統、農場類型、應用、最終用戶和地區分類)
 噴水灌溉系統市場機會、成長要素、產業趨勢分析及2026-2035年預測。
 農業灌溉機械:市場佔有率分析、產業趨勢與統計、成長預測(2026-2031)非洲農業灌溉機械:市場佔有率分析、產業趨勢與統計及成長預測(2026-2031 年)德國農業灌溉機械:市場佔有率分析、產業趨勢與統計及成長預測(2026-2031)北美農業灌溉機械:市場佔有率分析、產業趨勢與統計、成長預測(2026-2031)
 噴水灌溉系統市場:按類型、組件、移動性、作物類型、自動化程度、水源、最終用戶和分銷管道分類-2026-2032年全球市場預測自主灌溉控制系統市場預測至2034年:全球分析(按組件、灌溉方式、農場類型、技術、應用、最終用戶和地區分類)
 灌溉機械市場:按類型、應用和地區分類