


 |
市場調查報告書
商品編碼
2100674
印度共享辦公空間:市場佔有率分析、產業趨勢與統計及成長預測(2026-2031)India Coworking Office Spaces - Market Share Analysis, Industry Trends & Statistics, Growth Forecasts (2026 - 2031) |
||||||

※ 本網頁內容可能與最新版本有所差異。詳細情況請與我們聯繫。
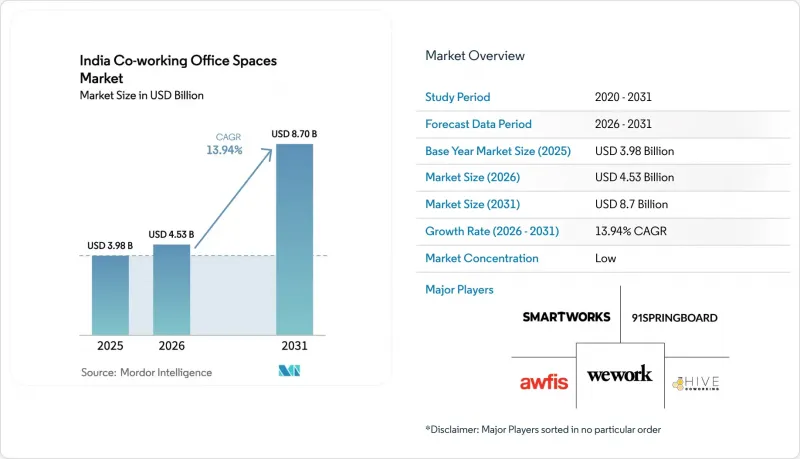
據 Mordor Intelligence 稱,印度共享辦公空間市場預計到 2026 年價值 45.3 億美元,高於 2025 年的 39.8 億美元,預計到 2031 年將達到 87 億美元。
預計 2026 年至 2031 年的複合年成長率為 13.94%。
本報告按設施規模(小規模、中型、大型)、行業(IT及ITES、銀行、金融服務及保險、商業諮詢及專業服務、其他服務)、最終用戶(自由職業者、企業、新創公司、其他)以及城市(孟買、德里首都區、普納、班加羅爾、海得拉巴、清奈、加爾各答、艾哈默德巴德以及印度其他地區)進行細分。市場預測以美元計價。
印度共享辦公空間市場趨勢與洞察
新創企業和中小企業的快速成長推動了對經濟實惠的共同工作空間的需求。
預計到2030年,印度的新創企業數量將超過20萬家,比目前成長2.6倍。目前已註冊的11.5萬家新創企業中,約有一半位於二、三線城市。這些新興企業更傾向於選擇每月租金3000至8000印度盧比的彈性工位共享辦公空間,從而避免了傳統辦公室高達50萬印度盧比的押金。政府推出的「印度創業種子基金」(Startup India Seed Fund,94.5萬印度盧比)等計畫正在引導創業者選擇共用辦公空間培養箱。自2023年中期以來,主要城市的商業租金上漲了30%至50%,中小企業越來越傾向於選擇更靈活的解決方案。由於傳統辦公室的成本成長速度遠高於共享辦公空間,印度的共享辦公市場正透過自然成長不斷擴大基本客群。
班加羅爾、海得拉巴和古爾格拉姆的IT、電子商務和專業服務公司積極採用該技術。
2023會計年度(FY23),印度企業共享辦公空間交易量達103,665個工位,其中IT和BPM產業佔40%,較去年同期成長20%。班加羅爾、海德拉巴和普納三座城市佔了企業租賃總量的78%,過去五年靈活辦公空間的需求維持了41%的複合年成長率。航空和水泥等傳統產業也紛紛加入這一趨勢,推動了共同工作空間的擴張。目前,印度約20%的招募訊息明確要求採用混合辦公模式,專業服務公司透過共享辦公中心將團隊部署在更靠近客戶的位置。因此,印度共享辦公空間市場受益於穩定的、以科技和顧問公司租戶為中心的大規模工位需求。
激烈的競爭和主要大都會圈供應過剩的風險正在造成價格壓力。
由於超過500家業者在各大城市爭奪辦公空間,價格競爭異常激烈。孟買的租金自2020年以來上漲了27%,但運轉率下降迫使價格下調。在班加羅爾,儘管空置率極低,但營運成本較去年同期上漲了30%至50%,而新進業者的湧入正在削弱定價權。由於規模較小,中小企業面臨利潤率壓力,被迫進行產業整合和選擇性退出。對供應過剩的擔憂可能會阻礙印度共享辦公空間市場的短期復甦。
細分市場分析
2025年,大型設施佔總收入的52.65%。這反映了企業對提供專用會議室和先進技術服務的單一地點園區的需求。營運商正透過高座位密度和配套服務利用規模經濟來創造利潤,儘管競爭激烈,運轉率維持在85%以上。同時,中型設施成長最快,預計到2031年將保持14.62%的年複合成長率(CAGR) ,因為中型企業和企劃團隊希望獲得專業的設施,但又不想支付大都會圈的高昂租金。該細分市場通常簽訂12至24個月的契約,從而改善了營運商的現金流前景。
小規模辦公中心對自由工作者和早期創業公司仍然很重要,但它們面臨著許多挑戰,例如高昂的工位成本和有限的服務。技術投資也集中在大規模辦公室設施。雖然物聯網感測器、非接觸式門禁系統和使用情況分析在園區級辦公設施中已成為標配,但許多小規模辦公中心仍依賴人工流程。隨著企業合約集中在大型供應商,預計印度共享辦公空間市場將進一步整合,這將使能夠在多個城市進行大規模部署的營運商獲得優勢。
其他好處:
- Excel格式的市場預測(ME)表
- 3個月的分析師支持
目錄
第1章:引言
- 研究假設和市場定義
- 調查範圍
第2章:調查方法
第3章執行摘要
第4章 市場狀況
- 市場概覽
- 市場促進因素
- 新創企業和中小企業的快速成長推動了對成本績效實惠的共同工作空間的需求。
- 班加羅爾、海得拉巴和古爾格拉姆的IT、電子商務和專業服務公司積極採用。
- 混合辦公模式的日益普及推動了對靈活的短期租賃方案的需求。
- 投資者和開發人員之間的合作正在擴大大都會圈甲級共同工作空間的供應。
- 消費者對注重員工健康並獲得永續發展認證的共享辦公空間的需求日益成長。
- 市場限制因素
- 激烈的競爭和主要大都會圈供應過剩的風險正在造成價格壓力。
- 雖然潛在需求不斷成長,但在二、三線城市的滲透率仍然有限。
- 商業房地產領域的監管和合規挑戰正在減緩市場擴張。
- 價值供應鏈分析
- 概述
- 房地產開發商和業主—關鍵的定量和定性見解
- 工作空間設計與技術顧問—關鍵的定量和定性見解
- 模組化家具和智慧辦公室解決方案供應商—關鍵定量和定性洞察
- 業界的政府法規和舉措
- 共享辦公空間房地產市場的技術創新
- 辦公室房地產行業關鍵指標分析(供應量、租金、價格、運轉率/空置率(%))。
- 遠距辦公對辦公室需求的影響
- 波特五力模型
第5章 市場規模與成長預測
- 按設施規模/量
- 小規模
- 中號
- 大規模
- 按行業
- 資訊科技(IT 和 ITES)
- 銀行、金融服務和保險業 (BFSI)
- 商業諮詢和專業服務
- 其他服務(零售、生命科學、能源、法律服務)
- 按最終用途
- 自由工作者
- 公司
- 新創企業及其他
- 按城市
- 孟買大都會圈
- 新德里(NCR)
- 普納
- 班加羅爾
- 海得拉巴
- 清奈
- 加爾各答
- 艾哈默德巴德
- 印度其他地區
第6章 競爭情勢
- 市場集中度
- 策略趨勢
- 公司簡介
- WeWork India
- Awfis
- Smartworks
- 91Springboard
- CoWrks
- BHIVE Workspaces
- The Office Pass
- 315Work Avenue
- Innov8
- IndiQube
- Skootr
- GoodWorks Coworking
- Spring House Coworking
- Urban Vault
- Workafella
- Regus India
- Incuspaze
- The Executive Centre
- The Hive*
第7章 市場機會與未來展望
According to Mordor Intelligence, India co-working office space market size in 2026 is estimated at USD 4.53 billion, growing from 2025 value of USD 3.98 billion with 2031 projections showing USD 8.7 billion, growing at 13.94% CAGR over 2026-2031.
This report is Segmented by Size & Scale of Facility (Small, Medium, and Large), by Sector (IT and ITES, BFSI, Business Consulting & Professional Service, and Other Services), by End Use (Freelancers, Enterprises, Start Ups, and Others), by City (Mumbai, Delhi NCR, Pune, Bengaluru, Hyderabad, Chennai, Kolkata, Ahmedabad and Rest of India). The Market Forecasts are Provided in Terms of Value (USD).
India Coworking Office Spaces Market Trends and Insights
Rapid growth of start-ups and SMEs is driving demand for cost-effective co-working spaces
India is expected to host more than 200,000 start-ups by 2030, a 2.6-fold jump on current numbers, and roughly half of today's 115,000 registered start-ups sit in tier-2 and tier-3 cities. These young firms favor co-working to avoid deposits that can top INR 500,000 for conventional offices, given flex seats cost INR 3,000-8,000 per month. Government programs such as the Startup India Seed Fund (INR 945 crore) are funneling founders toward incubators that operate from shared workspaces. Commercial rents have risen 30-50% in major cities since mid-2023, further tilting SMEs toward flexible solutions. As the traditional office cost curve steepens faster than co-working tariffs, the India co-working office space market continues to widen its customer base organically.
Strong adoption by IT, e-commerce, and professional services firms in Bengaluru, Hyderabad, and Gurugram
Enterprise co-working transactions booked 103,665 seats in FY23, with IT-BPM accounting for 40% of deals and achieving 20% year-on-year growth. Bengaluru, Hyderabad, and Pune together form 78% of enterprise leases, sustaining a five-year 41% CAGR in flex demand. Traditional sectors such as airlines and cement have joined the trend, underscoring its breadth. About 20% of Indian job listings now specify hybrid formats, prompting professional-services firms to situate teams close to clients via co-working hubs. The India co-working office space market, therefore, benefits from a steady pipeline of large-seat requirements anchored by technology and consulting tenants.
High competition and oversupply risk in top metros are leading to pricing pressures
With more than 500 operators crowding metros, price tension is acute. Mumbai rents have climbed 27% since FY20, yet occupancy pressure forces discounting. Bengaluru's vacancy is scarce, but newcomers erode pricing power even as operating costs inflate 30-50% year-on-year. Smaller firms lacking scale risk margin compression, prompting consolidation waves and selective exits. The oversupply overhang is likely to restrain near-term uplift in the India co-working office space market.
Other drivers and restraints analyzed in the detailed report include:
- Hybrid work models are increasing the preference for flexible and short-term leasing options
- Investor and developer partnerships are expanding Grade A co-working supply in metro cities
- Limited penetration in tier-2 and tier-3 cities despite rising demand potential
For complete list of drivers and restraints, kindly check the Table Of Contents.
Segment Analysis
Large facilities accounted for 52.65% of 2025 revenue, reflecting enterprise appetite for single-location campuses that deliver dedicated meeting suites and advanced tech services. Operators monetize at scale through higher seat density and ancillary services, keeping utilization above 85% despite price competition. Meanwhile, medium facilities are growing fastest at a 14.62% CAGR through 2031 as mid-market firms and project teams want professional amenities without premium metro rents. This cohort often signs 12- to 24-month commitments that improve operators' cash-flow visibility.
Smaller centers remain relevant for freelancers and early-stage start-ups but face higher per-seat costs and limited service breadth. Technology investment also tilts toward larger footprints; IoT sensors, touch-free entry, and usage analytics are standard in campus-scale assets, whereas many small hubs still rely on manual processes. As enterprise contracts concentrate volume with top providers, the India co-working office space market is expected to witness further consolidation, favoring operators capable of multi-city, large-format delivery.
Complete Report Scope:
- By Size & Scale of Facility
- Small
- Medium
- Large
- By Sector
- Information Technology (IT and ITES)
- BFSI (Banking, Financial Services and Insurance)
- Business Consulting & Professional Service
- Other Services (Retail, Lifesciences, Energy, Legal Services)
- By End Use
- Freelancers
- Enterprises
- Start Ups and Others
- By City
- Mumbai Metropolitan Region
- Delhi NCR
- Pune
- Bengaluru
- Hyderabad
- Chennai
- Kolkata
- Ahmedabad
- Rest of India
List of Companies Covered in this Report:
- WeWork India
- Awfis
- Smartworks
- 91Springboard
- CoWrks
- BHIVE Workspaces
- The Office Pass
- 315Work Avenue
- Innov8
- IndiQube
- Skootr
- GoodWorks Coworking
- Spring House Coworking
- Urban Vault
- Workafella
- Regus India
- Incuspaze
- The Executive Centre
- The Hive*
Additional Benefits:
- The market estimate (ME) sheet in Excel format
- 3 months of analyst support
TABLE OF CONTENTS
1 Introduction
- 1.1 Study Assumptions & Market Definition
- 1.2 Scope of the Study
2 Research Methodology
3 Executive Summary
4 Market Landscape
- 4.1 Market Overview
- 4.2 Market Drivers
- 4.2.1 Rapid growth of start-ups and SMEs driving demand for cost-effective co-working spaces
- 4.2.2 Strong adoption by IT, e-commerce, and professional services firms in Bengaluru, Hyderabad, and Gurugram
- 4.2.3 Hybrid work models increasing preference for flexible and short-term leasing options
- 4.2.4 Investor and developer partnerships expanding Grade A co-working supply in metro cities
- 4.2.5 Rising demand for wellness-focused and sustainability-certified co-working facilities
- 4.3 Market Restraints
- 4.3.1 High competition and oversupply risk in top metros leading to pricing pressures
- 4.3.2 Limited penetration in tier-2 and tier-3 cities despite rising demand potential
- 4.3.3 Regulatory and compliance challenges in commercial real estate slowing expansion
- 4.4 Value / Supply-Chain Analysis
- 4.4.1 Overview
- 4.4.2 Real Estate Developers and Asset Owners - Key Quantitative and Qualitative Insights
- 4.4.3 Workspace Design and Technology Consultants - Key Quantitative and Qualitative Insights
- 4.4.4 Modular Furniture and Smart Office Solutions Providers - Key Quantitative and Qualitative Insights
- 4.5 Government Regulations and Initiatives in the Industry
- 4.6 Technological Innovations in the Co-Working Office Space Real Estate Market
- 4.7 Insights into the Key Office Real Estate Industry Metrics (Supply, Rentals, Prices, Occupancy/Vacancy (%))
- 4.8 Impact of Remote Working on Space Demand
- 4.9 Porters Five Forces
- 4.9.1 Bargaining Power of Suppliers
- 4.9.2 Bargaining Power of Buyers
- 4.9.3 Threat of New Entrants
- 4.9.4 Threat of Substitutes
- 4.9.5 Intensity of Competitive Rivalry
5 Market Size & Growth Forecasts (Value USD)
- 5.1 By Size & Scale of Facility
- 5.1.1 Small
- 5.1.2 Medium
- 5.1.3 Large
- 5.2 By Sector
- 5.2.1 Information Technology (IT and ITES)
- 5.2.2 BFSI (Banking, Financial Services and Insurance)
- 5.2.3 Business Consulting & Professional Service
- 5.2.4 Other Services (Retail, Lifesciences, Energy, Legal Services)
- 5.3 By End Use
- 5.3.1 Freelancers
- 5.3.2 Enterprises
- 5.3.3 Start Ups and Others
- 5.4 By City
- 5.4.1 Mumbai Metropolitan Region
- 5.4.2 Delhi NCR
- 5.4.3 Pune
- 5.4.4 Bengaluru
- 5.4.5 Hyderabad
- 5.4.6 Chennai
- 5.4.7 Kolkata
- 5.4.8 Ahmedabad
- 5.4.9 Rest of India
6 Competitive Landscape
- 6.1 Market Concentration
- 6.2 Strategic Moves
- 6.3 Company Profiles (includes Global level Overview, Market level overview, Core Segments, Financials as available, Strategic Information, Products & Services, and Recent Developments)
- 6.3.1 WeWork India
- 6.3.2 Awfis
- 6.3.3 Smartworks
- 6.3.4 91Springboard
- 6.3.5 CoWrks
- 6.3.6 BHIVE Workspaces
- 6.3.7 The Office Pass
- 6.3.8 315Work Avenue
- 6.3.9 Innov8
- 6.3.10 IndiQube
- 6.3.11 Skootr
- 6.3.12 GoodWorks Coworking
- 6.3.13 Spring House Coworking
- 6.3.14 Urban Vault
- 6.3.15 Workafella
- 6.3.16 Regus India
- 6.3.17 Incuspaze
- 6.3.18 The Executive Centre
- 6.3.19 The Hive*
7 Market Opportunities & Future Outlook

 英國彈性辦公空間:市場佔有率分析、產業趨勢與統計及成長預測(2026-2031)
 節能型辦公空間市場分析及預測(至2035年):依類型、產品、服務、技術、組件、應用、材料類型、部署方式、最終用戶及解決方案分類
 共享辦公空間市場規模、佔有率和成長分析:按空間類型、經營模式、最終用戶、應用、產業、會員期限和地區分類-2026-2033年產業預測亞太地區共享辦公空間:市場佔有率分析、產業趨勢與統計及成長預測(2026-2031)北美共享辦公空間:市場佔有率分析、產業趨勢與統計及成長預測(2026-2031)南美洲共享辦公空間:市場佔有率分析、產業趨勢與統計及成長預測(2026-2031 年)美國共享辦公空間:市場佔有率分析、產業趨勢與統計及成長預測(2026-2031)
 辦公空間市場規模、佔有率和成長分析:按物業類型、等級、租賃類型、公司規模、最終用途產業、用途和地區分類-2026-2033年產業預測印度彈性辦公空間:市場佔有率分析、產業趨勢與統計及成長預測(2026-2031)
 共享辦公空間市場:按類型、產品類型、營運模式、產業和最終用戶分類-2026-2032年全球市場預測