


 |
市場調查報告書
商品編碼
2097210
美國共享辦公空間:市場佔有率分析、產業趨勢與統計及成長預測(2026-2031)United States Coworking Office Space - Market Share Analysis, Industry Trends & Statistics, Growth Forecasts (2026 - 2031) |
||||||

※ 本網頁內容可能與最新版本有所差異。詳細情況請與我們聯繫。
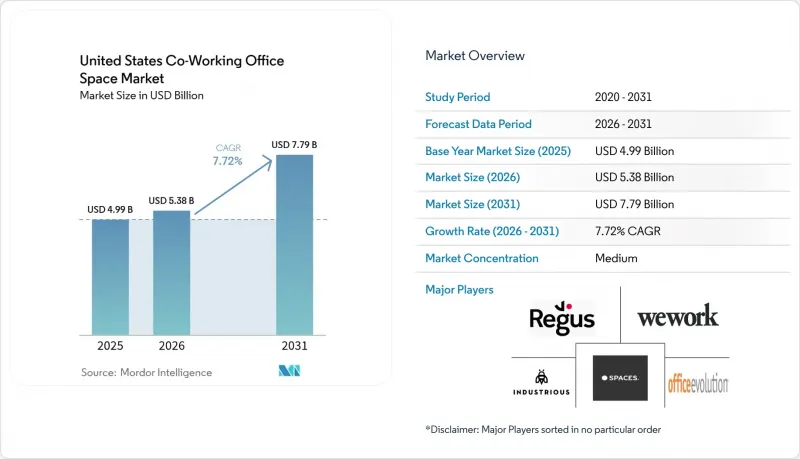
據 Mordor Intelligence 稱,美國共享辦公空間市場預計到 2026 年價值 53.8 億美元,高於 2025 年的 49.9 億美元,預計到 2031 年將達到 77.9 億美元。
預計從 2026 年到 2031 年,其複合年成長率將達到 7.72%。
本報告按使用者類型(自由工作者、企業、新創公司及其他)、辦公室類型(A級、B級、C級)、行業(IT及ITES、銀行、金融服務和保險、商業諮詢及專業服務、其他服務)以及地區(東北部、中西部、東南部、西部、西南部)進行細分。市場預測以美元(USD)計價。
美國共享辦公空間市場趨勢與洞察
郊區對共享辦公空間的需求
隨著通勤模式的改變,郊區細分市場正在擴張,吸引個人和企業。雷格斯預測,到2029年,去中心化的共享辦公空間每年可創造163.5萬個就業崗位,並帶來1,970億美元的總附加價值。營運商正在改造零售商店、健身中心和公共圖書館,打造「15分鐘城市」的生活方式,同時由於租金和室內設計成本低於市中心(CBD),確保了更高的利潤率。
混合辦公和遠距辦公模式的普及
2024年,92%接受調查的企業房地產主管證實,公司已實施永久性混合辦公政策,每週三天到辦公室辦公成為主流模式。因此,企業現在只需要疫情前約三分之二的辦公桌位,但仍需保留足夠的辦公空間用於客戶會議、培訓或應對業務衝刺階段的需求激增,這使得美國聯合辦公空間市場成為應對這些需求波動的理想「緩衝」。金融服務業的雇主(該行業98%的員工希望繼續遠距辦公)率先採用按需辦公空間,以維持協作,而無需簽訂10-15年的長期租賃合約。據高緯環球(Cushman & Wakefield)稱,共享辦公空間正在取代臨時備用辦公空間,從而使辦公成本降低5%以上,凸顯了其經濟合理性。
經濟波動對辦公大樓運轉率的影響
根據《商業邊緣》(Commercial Edge)的數據顯示,2023年美國辦公空間交易額較去年同期下降60%至340億美元,反映出投資人普遍謹慎。隨著市場情緒疲軟,企業更有可能在縮減自身辦公空間之前終止靈活辦公空間契約,從而給運營商帶來快速的收入壓力。 WeWork破產重組凸顯了其對宏觀經濟週期的高度敏感性,而其波動性較大的收入模式在需求急劇下降時會加劇下行風險。利率上升推高了資金籌措成本,進一步加劇了擴張計畫的壓力,迫使許多業者推遲新店分店。
細分市場分析
預計到2025年,企業將占美國共享辦公空間市場收入的30.60%,從而鞏固其在定價和設施標準方面的影響力。許多財富1000強企業將超過10%的辦公面積用於共享辦公室解決方案,隨著混合辦公模式的日益普及,預計兩年內這一比例將上升至58%。大型企業正在協商多城市通行證,允許員工使用遍布全國的辦公地點,確保企劃團隊在不同地點之間的公平性。企業內部基於數據驅動的座位管理工具正在與營運商的API整合,以每日批量釋放閒置辦公桌,從而提高利用率。這些企業舉措正在推動收入的持續成長,並有助於穩定美國共享辦公空間市場,使其免受新創企業短期更迭的影響。
新創公司和其他新興用戶是成長最快的群體,預計到2031年將維持8.9%的複合年成長率,並正在為奧斯汀、邁阿密和羅利等地的社區注入新的活力。較低的准入門檻使創辦人能夠迭代和改進業務,而無需擔心長期租金負擔;同時,遠端優先的數位機構也經常根據其衝刺週期使用共享辦公空間。航空公司、旅遊網路甚至大學都在推出按需通行證,透過非傳統管道擴大在美國共同工作空間市場的知名度並建立品牌。
到2025年,A級辦公空間將佔據美國共享辦公空間市場61.30%的佔有率。這主要歸功於企業優先選擇通風良好、擁有健康認證且樓層平面圖適合協作的頂級建築。儘管其他地區的空置率持續居高不下,A級辦公空間的平均租金仍上漲了3.1%,印證了「追求品質」的趨勢。這些頂級辦公大樓的營運商透過提供媲美飯店式服務的體驗式應用程式來脫穎而出,這些應用程式整合了預訂、社區活動和ESG報告等功能。這些高階中心構成了品牌形象的基礎,使營運商能夠將設計標準推廣到其所有級別的辦公空間。
儘管B級位置位於市中心以外,但預計到2031年,其複合年成長率將達到10.64%,超過美國共享辦公空間市場的整體成長率。將老舊的郊區辦公大樓和零售空間改造成共同工作空間,與新建設相比,可降低資本支出(CAPEX)。那些更注重室內效率而非檔次的租戶,願意接受適中的設計標準,以換取20-30%的租金折扣。透過逐步升級,例如安裝模組化電話亭、智慧門禁系統和LED照明維修,營運商無需進行大規模的全面維修,即可獲得更高的租金溢價。
其他好處:
- Excel格式的市場預測(ME)表
- 3個月的分析師支持
目錄
第1章:引言
- 研究假設和市場定義
- 調查範圍
第2章:調查方法
第3章執行摘要
第4章 市場狀況
- 市場促進因素
- 混合辦公和遠距辦公模式的普及
- 新創公司和自由工作者的激增
- 企業為減少長期租賃負債所做的努力
- 郊區對靈活空間的需求
- 房東與物業管理公司之間的收益分成協議
- 數據驅動的運轉率分析與動態定價
- 市場限制因素
- 影響運轉率的經濟波動
- 盈利挑戰和業務重組
- A級彈性物業的建設和維修成本不斷上漲
- 地方政府對適應性維修的區域分類限制
- 價值供應鏈分析
- 監理情勢
- 技術展望
- 波特五力模型
- 遠距工作的影響
- 租金和租賃分析
第5章 市場規模與成長預測
- 使用者
- 自由工作者
- 公司
- 新創企業及其他
- 依辦公類型
- A級
- B級
- C級
- 按行業
- 資訊科技(IT 和 ITES)
- 銀行、金融服務和保險業 (BFSI)
- 商業諮詢和專業服務
- 其他服務(零售、生命科學、能源、法律服務)
- 按地區
- 東北
- 中西部
- 東南部
- 西
- 西南
第6章 競爭情勢
- 市場集中度
- 策略趨勢
- 市佔率分析
- 公司簡介
- WeWork
- Regus(IWG)
- Spaces(IWG)
- Industrious Office
- Office Evolution
- Venture X
- Serendipity Labs
- Impact Hub
- Knotel
- Convene
- CommonGrounds Workspace
- HQ(HQ Global Workspaces)
- Premier Workspaces
- MakeOffices
- TechSpace
- Mindspace
- Workbar
- Alliance Virtual Offices
- Novel Coworking(Expansive)
- Daybase
第7章 市場機會與未來展望
According to Mordor Intelligence, the United States coworking office space market size in 2026 is estimated at USD 5.38 billion, growing from 2025 value of USD 4.99 billion with 2031 projections showing USD 7.79 billion, growing at 7.72% CAGR over 2026-2031.
This report is Segmented by User (Freelancers, Enterprises, Start Ups and Others), Office Type (Grade A, Grade B, Grade C), Sector (IT and ITES, BFSI, Business Consulting & Professional Service, Other Services), and Region (Northeast, Midwest, Southeast, West, Southwest). The Market Forecasts are Provided in Terms of Value (USD).
United States Coworking Office Space Market Trends and Insights
Suburban Demand for Coworking Spaces
As commuting patterns evolve, a widening envelope of suburban submarkets is drawing both individuals and corporates. Regus projects that decentralised coworking could generate 1.635 million jobs and USD 197 billion in annual gross value add by 2029. Operators are re-purposing retail boxes, fitness centres and municipal libraries, enabling 15-minute-city lifestyles while achieving higher margin spreads than CBD locations given lower rents and fit-out costs.
Proliferation of Hybrid & Remote Work Models
Ninety-two percent of corporate real-estate leaders surveyed in 2024 confirmed that permanent hybrid attendance policies are already in force, with the three-days-in-office rhythm emerging as the dominant pattern. Companies consequently require only around two-thirds of their pre-pandemic desk count, yet must guarantee capacity during episodic surges for client meetings, trainings or sprints, making the US coworking workspace market an attractive elasticity valve. Financial-services employers-where 98% of staff want continued remote options-have become early movers, procuring on-demand suites to sustain collaboration without locking in 10- to 15-year leases. Cushman & Wakefield notes occupancy-cost savings topping 5% when coworking replaces overflow swing space, validating the economic case .
Economic Volatility Impacting Occupancy Levels
Commercial Edge recorded a 60% year-on-year drop in US office transaction volume in 2023 to USD 34 billion, reflecting broad investor caution. When sentiment weakens, corporates often unwind flex seats before down-sizing owned premises, creating rapid revenue pressure for operators. WeWork's post-bankruptcy restructuring underscores sensitivity to macro cycles, as variable-revenue models amplify downside risk during demand shocks. Higher interest rates further squeeze expansion plans by elevating fit-out financing costs, forcing many providers to delay new openings.
Other drivers and restraints analyzed in the detailed report include:
- Surge in Start-Up & Independent Workforce
- Corporate Drive to Cut Long-Term Lease Liabilities
- Profitability Challenges & Operator Consolidation
For complete list of drivers and restraints, kindly check the Table Of Contents.
Segment Analysis
Enterprises controlled 30.60% of 2025 revenue, cementing their influence over pricing and amenity standards in the US coworking workspace market. Many Fortune 1000 companies dedicate more than 10% of their footprints to coworking solutions, a share expected to climb to 58% within two years as hybrid programmes mature. The biggest corporates negotiate multi-city passes that allow staff to tap a nationwide footprint, ensuring location parity for project teams. Internal data-driven seat-management tools interface with operator APIs to release blocks of unused desks daily, boosting utilisation. This institutional behaviour provides recurring revenue that stabilises the overall US coworking workspace market against short-term start-up churn.
Start-ups and other emerging users represent the fastest-growing cohort with a 8.9% CAGR forecast to 2031, energising local communities in Austin, Miami and Raleigh. Lower entry barriers permit founders to iterate without a long-term rent burden, while remote-first digital agencies co-locate periodically for sprint cycles. Airlines, travel networks and even universities now bundle on-demand passes, broadening exposure and embedding the brand of the US coworking workspace market in unconventional channels.
Grade A space held 61.30% of US coworking workspace market share in 2025 as corporates prioritised best-in-class buildings with high ventilation, wellness accreditations and collaborative floor plates. Average Class A rents rose 3.1% despite elevated vacancy elsewhere, confirming a flight-to-quality trend. Operators in trophy towers differentiate through hospitality-level services and proprietary experience apps that aggregate booking, community events and ESG reporting. These premium centres anchor brand perception and allow providers to cascade design standards down portfolio tiers.
Grade B locations, while less central, are set to register an 10.64% CAGR through 2031, outperforming headline growth for the broader US coworking workspace market. Adaptive reuse of obsolete suburban offices and retail centres into coworking suites reduces capex relative to ground-up development. Tenants who value fit-out efficiency over prestige accept moderate design specifications in exchange for 20-30% rent discounts. Incremental upgrades-such as modular phone booths, smart-access control and LED retrofits-help operators capture rent premiums without undertaking full-scale deep retrofits.
Complete Report Scope:
- By User
- Freelancers
- Enterprises
- Start Ups and Others
- By Office Type
- Grade A
- Grade B
- Grade C
- By Sector
- Information Technology (IT and ITES)
- BFSI (Banking, Financial Services and Insurance)
- Business Consulting & Professional Service
- Other Services (Retail, Lifesciences, Energy, Legal Services)
- By Region
- Northeast
- Midwest
- Southeast
- West
- Southwest
List of Companies Covered in this Report:
- WeWork
- Regus (IWG)
- Spaces (IWG)
- Industrious Office
- Office Evolution
- Venture X
- Serendipity Labs
- Impact Hub
- Knotel
- Convene
- CommonGrounds Workspace
- HQ (HQ Global Workspaces)
- Premier Workspaces
- MakeOffices
- TechSpace
- Mindspace
- Workbar
- Alliance Virtual Offices
- Novel Coworking (Expansive)
- Daybase
Additional Benefits:
- The market estimate (ME) sheet in Excel format
- 3 months of analyst support
TABLE OF CONTENTS
1 Introduction
- 1.1 Study Assumptions & Market Definition
- 1.2 Scope of the Study
2 Research Methodology
3 Executive Summary
4 Market Landscape
- 4.1 Market Drivers
- 4.1.1 Proliferation of hybrid & remote work models
- 4.1.2 Surge in startup & freelancer population
- 4.1.3 Corporate drive to cut long-term lease liabilities
- 4.1.4 Suburban demand for flexible spaces
- 4.1.5 Landlord-operator revenue-sharing agreements
- 4.1.6 Data-driven occupancy analytics & dynamic pricing
- 4.2 Market Restraints
- 4.2.1 Economic volatility impacting occupancy levels
- 4.2.2 Profitability challenges & operator consolidation
- 4.2.3 Rising construction / retrofit costs for Class-A flex
- 4.2.4 Municipal zoning limits on adaptive conversions
- 4.3 Value / Supply-Chain Analysis
- 4.4 Regulatory Landscape
- 4.5 Technological Outlook
- 4.6 Porter's Five Forces
- 4.6.1 Threat of New Entrants
- 4.6.2 Bargaining Power of Suppliers
- 4.6.3 Bargaining Power of Buyers
- 4.6.4 Threat of Substitutes
- 4.6.5 Competitive Rivalry
- 4.7 Remote Working Impact
- 4.8 Rent & Leasing Analysis
5 Market Size & Growth Forecasts (Value)
- 5.1 By User
- 5.1.1 Freelancers
- 5.1.2 Enterprises
- 5.1.3 Start Ups and Others
- 5.2 By Office Type
- 5.2.1 Grade A
- 5.2.2 Grade B
- 5.2.3 Grade C
- 5.3 By Sector
- 5.3.1 Information Technology (IT and ITES)
- 5.3.2 BFSI (Banking, Financial Services and Insurance)
- 5.3.3 Business Consulting & Professional Service
- 5.3.4 Other Services (Retail, Lifesciences, Energy, Legal Services)
- 5.4 By Region
- 5.4.1 Northeast
- 5.4.2 Midwest
- 5.4.3 Southeast
- 5.4.4 West
- 5.4.5 Southwest
6 Competitive Landscape
- 6.1 Market Concentration
- 6.2 Strategic Moves
- 6.3 Market Share Analysis
- 6.4 Company Profiles (includes Global level Overview, Market level overview, Core Segments, Financials as available, Strategic Information, Market Rank/Share for key companies, Products & Services, and Recent Developments)
- 6.4.1 WeWork
- 6.4.2 Regus (IWG)
- 6.4.3 Spaces (IWG)
- 6.4.4 Industrious Office
- 6.4.5 Office Evolution
- 6.4.6 Venture X
- 6.4.7 Serendipity Labs
- 6.4.8 Impact Hub
- 6.4.9 Knotel
- 6.4.10 Convene
- 6.4.11 CommonGrounds Workspace
- 6.4.12 HQ (HQ Global Workspaces)
- 6.4.13 Premier Workspaces
- 6.4.14 MakeOffices
- 6.4.15 TechSpace
- 6.4.16 Mindspace
- 6.4.17 Workbar
- 6.4.18 Alliance Virtual Offices
- 6.4.19 Novel Coworking (Expansive)
- 6.4.20 Daybase
7 Market Opportunities & Future Outlook

 英國彈性辦公空間:市場佔有率分析、產業趨勢與統計及成長預測(2026-2031)
 節能型辦公空間市場分析及預測(至2035年):依類型、產品、服務、技術、組件、應用、材料類型、部署方式、最終用戶及解決方案分類
 共享辦公空間市場規模、佔有率和成長分析:按空間類型、經營模式、最終用戶、應用、產業、會員期限和地區分類-2026-2033年產業預測亞太地區共享辦公空間:市場佔有率分析、產業趨勢與統計及成長預測(2026-2031)北美共享辦公空間:市場佔有率分析、產業趨勢與統計及成長預測(2026-2031)南美洲共享辦公空間:市場佔有率分析、產業趨勢與統計及成長預測(2026-2031 年)印度共享辦公空間:市場佔有率分析、產業趨勢與統計及成長預測(2026-2031)
 辦公空間市場規模、佔有率和成長分析:按物業類型、等級、租賃類型、公司規模、最終用途產業、用途和地區分類-2026-2033年產業預測印度彈性辦公空間:市場佔有率分析、產業趨勢與統計及成長預測(2026-2031)
 共享辦公空間市場:按類型、產品類型、營運模式、產業和最終用戶分類-2026-2032年全球市場預測