


 |
市場調查報告書
商品編碼
2097184
北美共享辦公空間:市場佔有率分析、產業趨勢與統計及成長預測(2026-2031)North America Coworking Spaces - Market Share Analysis, Industry Trends & Statistics, Growth Forecasts (2026 - 2031) |
||||||

※ 本網頁內容可能與最新版本有所差異。詳細情況請與我們聯繫。
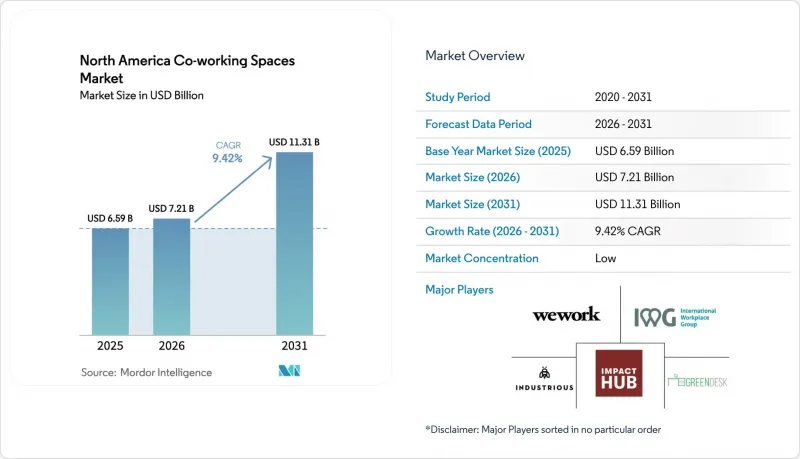
據 Mordor Intelligence 稱,2025 年北美共享辦公空間市場價值為 65.9 億美元,預計到 2031 年將從 2026 年的 72.1 億美元成長至 113.1 億美元,預測期(2026-2031 年)的複合年成長率為 9.42%。
本報告按設施規模(小規模、中型、大型)、行業(資訊科技(IT 和 ITES)、銀行、金融服務和保險 (BFSI)、其他)、最終用戶(自由工作者、企業、新創公司、其他)和地區(美國、加拿大、墨西哥)進行細分。市場預測以美元 (USD) 為單位。
北美共享辦公空間市場趨勢與洞察
隨著混合辦公模式的建立,大大小小的企業越來越傾向尋求靈活、短期可用的辦公空間。
預計到2025年,美國辦公大樓入住率將穩定在2019年水準的60%至70%左右,這將促使雇主將工作時間調整為每週2至3天,減少自有辦公空間,並透過會員制服務取得按需辦公空間。財富500強企業正擴大將共享辦公室納入其投資組合策略,並推廣多地點協議而非單一租賃。預計到2025年11月,新業務申請將超過53.5萬份,顯示創業客戶的需求旺盛。政府要求員工返回辦公室的指令正在滲透到私部門,推高了華盛頓特區和其他郊區城市的需求。因此,房地產市場正持續轉向能夠靈活適應員工人數和專案週期變化的可變型房地產。
「追求卓越品質」:擁有優越設施和黃金位置的樞紐,其業績超越了傳統辦公室。
儘管市中心配備健康設施、交通便利、擁有先進數位基礎設施的甲級辦公室佔據了新租約的大部分佔有率,但老舊的乙、丙級辦公室卻面臨著不斷攀升的空置率。那些已經拿下優質空間的業者正在獲得定價權和企業信譽。 Industria 在 2024 年中在 Tower 49 租下 24 萬平方英尺的辦公空間,正是透過「追求品質」進行資產重新配置的典型案例,它將 WeWork 之前的旗艦店改造成了一個企業中心。 WeWork 於 2024 年 7 月推出的全新「Work Lounge」服務,為大樓內的所有租戶提供共享辦公空間,這表明未來一體化而非獨立式辦公模式將成為主流。卓越的辦公環境如今已成為競爭標準,迫使落後的業主在維修或拆除之間做出抉擇。
高科技產業的經濟不確定性和裁員導致租戶更迭和空置率波動。
2023年至2025年初,科技業裁員超過38.6萬人,導致主要創新中心的辦公空間需求萎縮,矽谷空置率飆升至近20%。新創公司紛紛從獨立辦公室轉向無固定辦公桌,租戶更迭加劇,每個工位的平均收入也面臨壓力。創業融資轉向後期輪次,曾經填滿早期辦公空間的種子輪融資項目大幅減少。營運商透過專注於簽訂多年期企業合約和實現業務地域多元化來降低風險。儘管如此,短期波動仍是運轉率預測面臨的一大阻力。
細分市場分析
至2025年,面積超過5萬平方英尺的大型辦公空間將佔北美共同工作空間市場的32%,僅次於中型辦公空間(佔45.7%)。這些大型辦公空間受益於業主共同投資、完善的配套設施(從地板到天花板),以及能夠將整層樓出租給尋求私密辦公空間但又不想簽訂長期租約的財富500強企業。預計到2031年,該細分市場將實現最高的複合年成長率(CAGR),達到10.33%,這主要得益於企業「中心輻射式」辦公室模式的興起以及高層建築從單一租戶模式向多租戶靈活辦公模式的轉變。美國擁有許多未充分利用的市中心高層建築,非常適合改造。同時,墨西哥城的業主也正在進行類似的維修成多層共享辦公空間,以滿足近岸外包的需求。業者正利用規模經濟效應,透過增設禮賓服務台、咖啡廳/酒吧和播客工作室來提高每平方英尺的收益。中型設施將繼續在郊區和周邊地區發揮核心作用,成為重要的樞紐,滿足那些需求穩定但交易量相對較小的地區的需求。
大規模的樞紐也能讓服務提供者在更廣泛的區域部署用於門禁控制、空間分析和活動管理的技術平台,從而改善使用者體驗和資料收集。世邦魏理仕 (CBRE) 對 Industrious 的整合就是這種規模化策略的絕佳例證。這筆價值 8 億美元的交易將一個大型靈活辦公空間整合到了一個價值 200 億美元的全球服務引擎中。 WeWork 的重返參與策略與此類似,專注於在韌性強的大都會圈打造 10 萬平方英尺的旗艦辦公空間。隨著城市中心小規模樓層的辦公空間在預測期內被改造或關閉,預計這一細分市場的佔有率將接近 40%,進一步印證了北美聯合辦公空間市場正在朝著規模化方向發展。
其他好處:
- Excel格式的市場預測(ME)表
- 3個月的分析師支持
目錄
第1章:引言
- 研究假設和市場定義
- 調查範圍
第2章:調查方法
第3章執行摘要
第4章 市場狀況
- 市場概覽
- 市場促進因素
- 隨著混合辦公模式的興起,大大小小的企業不斷尋求靈活的短期辦公空間。
- 「追求卓越品質」:中心辦公大樓將一流的設施與優越的位置相結合,與傳統辦公大樓相比,可提供更優異的性能。
- 成本最佳化-將資本投入最少的擴張方案與傳統的長期租賃和內部裝修方案進行比較。
- 分散式團隊的興起以及郊區和陽光地帶辦公地點的增加,正在推動二次性市場的需求。
- 業主正與物業管理公司合作,以振興未充分利用的資產並提供靈活的套房。
- 市場限制因素
- IT產業的經濟不確定性和裁員導致客戶流失和運轉率波動。
- 借貸成本上升以及對設備改造和資本支出的需求增加,給企業和單位經濟效益帶來了壓力。
- 在主要大都市地區,日益激烈的競爭和品牌間缺乏差異化加劇了價格壓力。
- 價值供應鏈分析
- 監理情勢
- 技術展望
- 波特五力模型
第5章 市場規模與成長預測
- 按設施規模
- 小規模
- 中等的
- 大規模
- 按行業
- 資訊科技(IT 和 ITES)
- BFSI
- 商業諮詢和專業服務
- 其他服務(零售、生命科學、能源、法律)
- 按最終用途
- 自由工作者
- 公司
- 新創企業及其他
- 國家
- 美國
- 加拿大
- 墨西哥
第6章 競爭情勢
- 市場集中度
- 策略趨勢
- 市佔率分析
- 公司簡介
- WeWork Inc.
- IWG plc(Regus, HQ, Spaces)
- Industrious LLC
- Impact Hub GmbH
- Green Desk
- Knotel Inc.
- Serendipity Labs Inc.
- Techspace Holding Co.
- Mix Pace
- District Cowork
- Office Evolution Franchising Inc.
- Venture X Franchising LLC
- Workbox Company LLC
- Workbar LLC
- Premier Workspaces LLC
- COhatch LLC
- Convene Inc.
- CommonGrounds Workplace LLC
- LiquidSpace Inc.
- Expansive Workspace LLC
第7章 市場機會與未來展望
According to Mordor Intelligence, the North America coworking spaces market size was valued at USD 6.59 billion in 2025 and is estimated to grow from USD 7.21 billion in 2026 to reach USD 11.31 billion by 2031, at a CAGR of 9.42% during the forecast period (2026-2031).
This report is Segmented by Size and Scale of Facility (Small, Medium, Large), by Sector (Information Technology (IT and ITES), BFSI, and More), by End Use (Freelancers, Enterprises, Startups, and Others), and by Geography (United States, Canada, Mexico). Market Forecasts are Provided in Terms of Value (USD).
North America Coworking Spaces Market Trends and Insights
Hybrid Work Normalization Pushing Enterprises and SMEs to Flexible, Short-Term Space
U.S. office badge data stabilized at roughly 60-70% of 2019 levels during 2025, prompting employers to hard-code two-to-three-day schedules and trim owned footprints while securing on-demand capacity through memberships. Fortune 500 firms increasingly embed co-working within portfolio playbooks, driving multi-location agreements that replace one-off leases. New business applications topped 535,000 in November 2025, keeping the pipeline of entrepreneurial customers strong. Government return-to-office directives ripple into private-sector norms and lift demand in Washington, D.C., and other capital-adjacent cities. The net effect is a durable reorientation toward variable real estate that can flex with head-count swings and project cycles.
Flight-to-Quality: Amenitized, Well-Located Hubs Outperform Legacy Offices
Class A downtown towers with wellness amenities, transit adjacency, and advanced digital infrastructure soak up a majority of new leasing, whereas aging Class B/C stock suffers widening vacancies. Operators able to secure premium space gain pricing power and enterprise credibility. Industrious's 240,000-square-foot deal at Tower 49 in mid-2024 typifies flight-to-quality reallocations, repurposing WeWork's former flagship into an enterprise-grade hub. WeWork's new "work-lounge" product, launched in July 2024, embeds co-working amenities for all tenants in a building, signaling an integrated rather than stand-alone future. Superior environments now set the competitive bar and push lagging landlords toward upgrade or demolition decisions.
Economic Uncertainty and Tech Downsizing Creating Churn and Occupancy Volatility
Layoffs exceeding 386,000 across the tech sector from 2023 to early 2025 shrank seat demand in core innovation hubs and pushed Silicon Valley vacancy to nearly 20%. Start-ups downgraded from private offices to hot desks, elevating churn and compressing average revenue per workstation. Venture funding skewed to late-stage rounds, drying seed-stage pipelines that once filled early co-working cohorts. Operators mitigated risk by leaning into multi-year enterprise deals and diversifying geographically. Nonetheless, near-term volatility remains a headwind for occupancy forecasts.
Other drivers and restraints analyzed in the detailed report include:
- Cost Optimization via Capex-Light Expansion versus Long Leases
- Rise of Distributed Teams and Sunbelt Nodes Boosting Secondary-Market Demand
- Higher Borrowing Costs and TI/Capex Needs Pressuring Operator Unit Economics
For complete list of drivers and restraints, kindly check the Table Of Contents.
Segment Analysis
Large facilities exceeding 50,000 square feet captured 32% of the North America Coworking Spaces Market in 2025, second only to the medium-scale cohort at 45.7%. They benefit from landlord co-investment, floor-to-ceiling amenity sets, and the capacity to dedicate entire floors to Fortune 500 tenants seeking privacy without long leases. The segment is set to deliver the fastest 10.33% CAGR through 2031, fueled by corporate "hub-and-spoke" models and the repositioning of towers from single-tenant to multi-tenant flex operations. The United States provides a deep bench of underutilized downtown high-rises ripe for conversion, while Mexico City landlords similarly retrofit obsolete stock into multi-floor coworking to meet near-shoring demand. Operators leverage economies of scale-concierge desks, cafe bars, podcast studios-to lift yield per square foot. Medium-scale sites will continue to anchor suburban and neighborhood nodes where demand is steadier, but transaction sizes are smaller.
Large hubs also enable providers to roll out technology platforms for access control, space analytics, and event management across a larger area, enhancing the user experience and data capture. CBRE's Industrious integration exemplifies this scale play: the USD 800 million deal folds large-format flex suites into a USD 20 billion global services engine. WeWork's re-entry strategy similarly focuses on 100,000-square-foot flagship sites in resilient metros. Over the forecast horizon, the segment's share is expected to edge toward 40% as smaller downtown floors convert or close, reaffirming the North America Coworking Spaces Market's gravitation to scale.
Complete Report Scope:
- By Size & Scale of Facility
- Small
- Medium
- Large
- By Sector
- Information Technology (IT & ITES)
- BFSI
- Business Consulting & Professional Service
- Other Services (Retail, Lifesciences, Energy, Legal)
- By End Use
- Freelancers
- Enterprises
- Start-ups & Others
- By Country
- United States
- Canada
- Mexico
List of Companies Covered in this Report:
- WeWork Inc.
- IWG plc (Regus, HQ, Spaces)
- Industrious LLC
- Impact Hub GmbH
- Green Desk
- Knotel Inc.
- Serendipity Labs Inc.
- Techspace Holding Co.
- Mix Pace
- District Cowork
- Office Evolution Franchising Inc.
- Venture X Franchising LLC
- Workbox Company LLC
- Workbar LLC
- Premier Workspaces LLC
- COhatch LLC
- Convene Inc.
- CommonGrounds Workplace LLC
- LiquidSpace Inc.
- Expansive Workspace LLC
Additional Benefits:
- The market estimate (ME) sheet in Excel format
- 3 months of analyst support
TABLE OF CONTENTS
1 Introduction
- 1.1 Study Assumptions & Market Definition
- 1.2 Scope of the Study
2 Research Methodology
3 Executive Summary
4 Market Landscape
- 4.1 Market Overview
- 4.2 Market Drivers
- 4.2.1 Hybrid work normalization pushing enterprises and SMEs to flexible, short-term space.
- 4.2.2 Flight-to-quality: amenitized, well-located hubs outperform legacy offices.
- 4.2.3 Cost optimization-capex-light expansion vs. traditional long leases and fit-outs.
- 4.2.4 Rise of distributed teams and suburban/sunbelt nodes boosting secondary-market demand.
- 4.2.5 Landlords partnering with operators to activate underused assets and offer flex suites.
- 4.3 Market Restraints
- 4.3.1 Economic uncertainty and tech downsizing creating churn and occupancy volatility.
- 4.3.2 Higher borrowing costs and TI/capex needs pressuring operator/unit economics.
- 4.3.3 Competitive supply and thin brand differentiation driving price pressure in core metros.
- 4.4 Value / Supply-Chain Analysis
- 4.5 Regulatory Landscape
- 4.6 Technological Outlook
- 4.7 Porter's Five Forces
- 4.7.1 Threat of New Entrants
- 4.7.2 Bargaining Power of Buyers
- 4.7.3 Bargaining Power of Suppliers
- 4.7.4 Threat of Substitutes
- 4.7.5 Intensity of Competitive Rivalry
5 Market Size & Growth Forecasts (Value, USD)
- 5.1 By Size & Scale of Facility
- 5.1.1 Small
- 5.1.2 Medium
- 5.1.3 Large
- 5.2 By Sector
- 5.2.1 Information Technology (IT & ITES)
- 5.2.2 BFSI
- 5.2.3 Business Consulting & Professional Service
- 5.2.4 Other Services (Retail, Lifesciences, Energy, Legal)
- 5.3 By End Use
- 5.3.1 Freelancers
- 5.3.2 Enterprises
- 5.3.3 Start-ups & Others
- 5.4 By Country
- 5.4.1 United States
- 5.4.2 Canada
- 5.4.3 Mexico
6 Competitive Landscape
- 6.1 Market Concentration
- 6.2 Strategic Moves
- 6.3 Market Share Analysis
- 6.4 Company Profiles (includes Global level Overview, Market level overview, Core Segments, Financials as available, Strategic Information, Products & Services, and Recent Developments)
- 6.4.1 WeWork Inc.
- 6.4.2 IWG plc (Regus, HQ, Spaces)
- 6.4.3 Industrious LLC
- 6.4.4 Impact Hub GmbH
- 6.4.5 Green Desk
- 6.4.6 Knotel Inc.
- 6.4.7 Serendipity Labs Inc.
- 6.4.8 Techspace Holding Co.
- 6.4.9 Mix Pace
- 6.4.10 District Cowork
- 6.4.11 Office Evolution Franchising Inc.
- 6.4.12 Venture X Franchising LLC
- 6.4.13 Workbox Company LLC
- 6.4.14 Workbar LLC
- 6.4.15 Premier Workspaces LLC
- 6.4.16 COhatch LLC
- 6.4.17 Convene Inc.
- 6.4.18 CommonGrounds Workplace LLC
- 6.4.19 LiquidSpace Inc.
- 6.4.20 Expansive Workspace LLC
7 Market Opportunities & Future Outlook
- 7.1 White-space & Unmet-need Assessment

 英國彈性辦公空間:市場佔有率分析、產業趨勢與統計及成長預測(2026-2031)
 節能型辦公空間市場分析及預測(至2035年):依類型、產品、服務、技術、組件、應用、材料類型、部署方式、最終用戶及解決方案分類
 共享辦公空間市場規模、佔有率和成長分析:按空間類型、經營模式、最終用戶、應用、產業、會員期限和地區分類-2026-2033年產業預測亞太地區共享辦公空間:市場佔有率分析、產業趨勢與統計及成長預測(2026-2031)南美洲共享辦公空間:市場佔有率分析、產業趨勢與統計及成長預測(2026-2031 年)印度共享辦公空間:市場佔有率分析、產業趨勢與統計及成長預測(2026-2031)美國共享辦公空間:市場佔有率分析、產業趨勢與統計及成長預測(2026-2031)
 辦公空間市場規模、佔有率和成長分析:按物業類型、等級、租賃類型、公司規模、最終用途產業、用途和地區分類-2026-2033年產業預測印度彈性辦公空間:市場佔有率分析、產業趨勢與統計及成長預測(2026-2031)
 共享辦公空間市場:按類型、產品類型、營運模式、產業和最終用戶分類-2026-2032年全球市場預測