


 |
市場調查報告書
商品編碼
2100673
亞太地區共享辦公空間:市場佔有率分析、產業趨勢與統計及成長預測(2026-2031)Asia Pacific Coworking Office Spaces - Market Share Analysis, Industry Trends & Statistics, Growth Forecasts (2026 - 2031) |
||||||

※ 本網頁內容可能與最新版本有所差異。詳細情況請與我們聯繫。
據 Mordor Intelligence 稱,亞太地區共享辦公空間市場預計到 2026 年價值 161.3 億美元,高於 2025 年的 143.6 億美元,預計到 2031 年將達到 288.4 億美元。
預計 2026 年至 2031 年的複合年成長率為 12.31%。
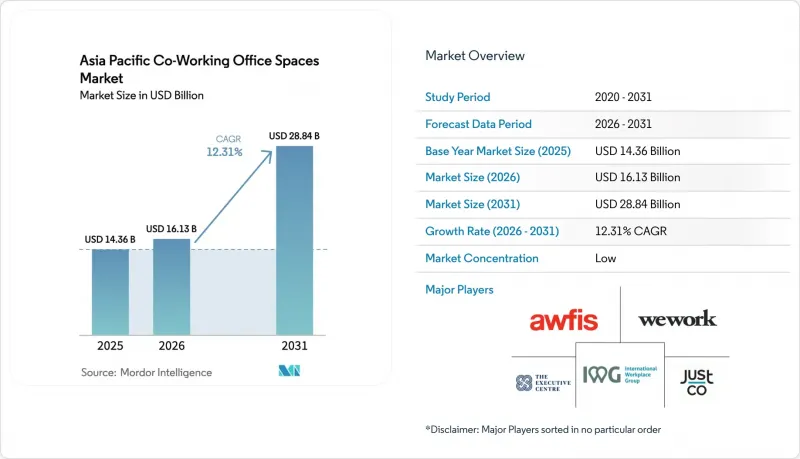
本報告按設施規模(小規模、中型、大型)、行業(資訊科技、銀行、金融服務和保險)、最終用戶(自由工作者、企業等)和國家/地區(中國、印度、日本、韓國、澳洲、印尼和其他亞太國家)進行細分。市場預測以美元計價。
亞太地區共享辦公空間市場的趨勢與洞察
快速的都市化和新創公司的成長
快速的都市化和新創企業的蓬勃發展正在重塑亞太地區對靈活辦公空間的需求。企業家越來越傾向選擇中國、印度和東南亞等快速發展的大都會圈,尋求高度靈活的房地產解決方案。印尼的「千家數位新創企業」計畫和馬來西亞的「數位中心」計畫等政府主導的舉措,提供稅收優惠、寬頻資金籌措的租戶,這些租戶被靈活的合約條款所吸引,從而能夠應對員工人數的不可預測波動。這些中心集中在一線城市和新興二線城市,不僅提高了運轉率,也鞏固了長期需求前景。隨著創業生態系統的日趨成熟,亞太地區的共同工作空間市場在強勁的需求驅動下蓬勃發展。
引入混合工作模式
混合辦公模式透過融合柔軟性和營運效率,正在改變職場。企業政策日益融合辦公室辦公和遠距辦公,導致固定辦公桌數量減少,協作空間增加。世邦魏理仕 (CBRE) 2024 年的一項調查發現,該地區 60% 的企業表示員工到崗率穩定,尖峰時段利用率超過 80%。這凸顯了這些混合模式的營運成熟度。靈活的辦公空間允許快速調整容量,而不會增加財務負擔。因此,租戶正在將其投資組合中更大比例的空間分配給第三方辦公空間。為了因應不斷變化的使用模式,供應商正在最佳化佈局,並推出無固定辦公桌、會議艙、活動休息室等。因此,儘管每位員工的總面積正在減少,但對混合辦公空間的潛在需求仍然強勁。
成熟城市供應過剩
成熟城市辦公空間供應過剩對彈性辦公空間市場構成重大挑戰。在北京、上海、班加羅爾和孟買等城市,傳統辦公大樓的完工速度激增,遠超市場吸收速度。這種供需失衡對靈活辦公空間市場的報酬率帶來壓力。受長期租賃協議約束的供應商舉步維艱,因為業主會降低租金,而企業租戶則要求重新談判。因此,企業擴張策略明顯趨於謹慎,資產負擔較低的管理協議變得日益重要。然而,對於能夠與陷入困境的競爭對手合併的營運商而言,仍有可能從中獲益,因為即使短期成長放緩,他們也能獲得有利的條款並擴大市場佔有率。
細分市場分析
在亞太地區共享辦公空間市場,中型中心預計在2025年將佔據52.60%的收入佔有率,而面積超過3萬平方英尺的大型辦公空間預計將從2026年起以13.02%的複合年成長率成長。企業更青睞這些大型辦公空間,因為它們提供私密區域、先進的網路安全保障以及與內部網路的無縫整合。服務供應商正利用其規模優勢,推出利潤率更高的優質會議室和現場資料中心。隨著成長型企業和企劃團隊優先考慮成本和柔軟性之間的平衡,中型中心仍然佔據主導地位。不斷成長的需求正在推動辦公空間規模的多元化,要求營運商維護多規格的辦公空間組合,以滿足不同規模和位置的客戶需求。
無論規模大小,技術進步都在重新定義空間規劃。竹中工房株式會社的「GISTA」系統結合了生物識別數據和占用感測器,使管理人員能夠即時微調空調設定和辦公桌分配。這種分析功能可改善員工福祉和能源效率,進而進一步增強競爭優勢。在預測期內,隨著越來越多的跨國公司從單一租戶協議轉向託管空間解決方案,亞太地區聯合辦公空間市場的大型設施市場規模預計將穩定成長。
其他好處:
- Excel格式的市場預測(ME)表
- 3個月的分析師支持
目錄
第1章:引言
- 研究假設和市場定義
- 調查範圍
第2章:調查方法
第3章執行摘要
第4章 市場狀況
- 市場概覽
- 市場促進因素
- 中國、印度和東南亞的快速都市化和新創公司的發展正在推動需求成長。
- 企業和跨國公司中混合工作模式的普及
- 國際和區域聯合辦公空間提供者正在積極拓展其在亞太地區各大城市的業務。
- 支持共享辦公室生態系統的政府創新計畫和科技園區
- 租戶對柔軟性、擴充性和社區主導工作空間的需求日益成長。
- 市場限制因素
- 中國和印度等成熟市場供應過剩的風險正在造成價格壓力。
- 亞太地區各司法管轄區所面臨的監管和合規挑戰。
- 對於位於高檔位置的企業而言,高昂的室內設計和營運成本會影響盈利。
- 價值供應鏈分析
- 概述
- 房地產開發商和業主—關鍵的定量和定性見解
- 工作空間設計與技術顧問—關鍵的定量和定性見解
- 模組化家具和智慧辦公室解決方案供應商—關鍵定量和定性洞察
- 業界的政府法規和舉措
- 共享辦公空間房地產市場的技術創新
- 辦公室房地產行業關鍵指標分析(供應量、租金、價格、運轉率/空置率(%))。
- 遠距辦公對辦公室需求的影響
- 波特五力模型
第5章 市場規模與成長預測
- 按設施規模/量
- 小規模
- 中號
- 大規模
- 按行業
- 資訊科技(IT 和 ITES)
- 銀行、金融服務和保險業 (BFSI)
- 商業諮詢和專業服務
- 其他服務(零售、生命科學、能源、法律服務)
- 按最終用途
- 自由工作者
- 公司
- 新創企業及其他
- 國家
- 中國
- 印度
- 日本
- 韓國
- 澳洲
- 印尼
- 其他亞太國家
第6章 競爭情勢
- 市場集中度
- 策略趨勢
- 公司簡介
- IWG(Regus, Spaces)
- WeWork
- The Executive Centre(TEC)
- JustCo
- Awfis
- Compass Offices
- Servcorp
- CoWrks
- Smartworks
- GoWork(India)
- Ucommune
- KrSpace
- Distrii
- FastFive
- SparkPlus
- KLOUD
- Bee+
- The Hive
- CommonGrounds
- Industrious APAC JV
第7章 市場機會與未來展望
According to Mordor Intelligence, Asia Pacific co-working office space market size in 2026 is estimated at USD 16.13 billion, growing from 2025 value of USD 14.36 billion with 2031 projections showing USD 28.84 billion, growing at 12.31% CAGR over 2026-2031.
This report is Segmented by Size & Scale of Facility (Small, Medium and Large), by Sector (Information Technology, BFSI (Banking, Financial Services and Insurance), and More), by End Use (Freelancers, Enterprises, and More), and by Country (China, India, Japan, South Korea, Australia, Indonesia, and the Rest of Asia-Pacific). The Market Forecasts are Provided in Terms of Value (USD).
Asia Pacific Coworking Office Spaces Market Trends and Insights
Rapid urbanization and start-up growth
Rapid urbanization and the growth of start-ups are reshaping the demand for flexible office spaces in the Asia Pacific region. Entrepreneurs are increasingly drawn to fast-growing metropolitan areas in China, India, and Southeast Asia, seeking agile real estate solutions. National initiatives, such as Indonesia's "1000 Digital Startups" and Malaysia's Digital Hub scheme, offer tax breaks, broadband subsidies, and mentoring, steering early-stage firms into professionally managed spaces. Operators benefit from a steady stream of seed-funded tenants, attracted by flexible terms amidst unpredictable headcount scaling. The concentration of these hubs in tier-1 and emerging tier-2 cities not only boosts occupancy but also solidifies long-term demand visibility. As venture ecosystems mature, the Asia Pacific co-working office space market is supported by a robust demand engine.
Hybrid work model adoption
The hybrid work model is transforming workplace dynamics, blending flexibility with operational efficiency. Corporate policies are increasingly integrating both office and remote workdays, leading to a reduction in dedicated desk ratios and a rise in collaborative spaces. According to a 2024 survey by CBRE, 60% of firms in the region report stable attendance, with peak utilization surpassing 80%. This highlights the operational maturity of these hybrid models. Flexible spaces allow for swift capacity adjustments without straining balance sheets. As a result, occupiers are designating larger portions of their portfolios to third-party workspaces. In response to evolving usage patterns, providers are fine-tuning their layouts, introducing hot desks, meeting pods, and event lounges. Consequently, while the total occupied area per employee may be shrinking, the baseline demand for hybrid workspaces remains robust.
Oversupply in mature cities
The oversupply of office spaces in mature cities is creating significant challenges for the flexible-space market. In cities like Beijing, Shanghai, Bengaluru, and Mumbai, a surge in conventional office completions is outpacing absorption rates. This imbalance is exerting pressure on yields in the flexible-space market. Providers locked into long leases are feeling the pinch as landlords offer discounts on face rents and corporate tenants push for renegotiations. As a result, there's a noticeable shift towards cautious expansion and a heightened emphasis on asset-light management agreements. Yet, operators who can consolidate with distressed rivals stand to benefit, securing favorable terms and bolstering their market presence, even if it drags on their short-term growth.
Other drivers and restraints analyzed in the detailed report include:
- Operator network expansion
- Government innovation programs
- Regulatory compliance complexity
For complete list of drivers and restraints, kindly check the Table Of Contents.
Segment Analysis
Large facilities of 30,000-plus square feet captured 13.02% CAGR momentum from 2026 onward, even though medium centers held 52.60% of 2025 revenue in the Asia Pacific co-working office space market. Enterprises favor these expansive sites because they deliver private zones, advanced cybersecurity, and seamless integration with corporate networks. Providers leverage size to introduce premium meeting suites and on-site data rooms that command higher yields. Medium centers still dominate because growth-stage firms and project teams value balanced cost and flexibility. Rising demand splits the footprint mix, pushing operators to maintain multi-format portfolios responsive to client scale and location.
Technology is redefining space planning across sizes. Takenaka Corporation's GISTA system pairs biometric feedback with occupancy sensors, enabling managers to fine-tune HVAC settings and desk allocation in real time. Such analytics boost staff well-being and energy efficiency, sharpening competitive differentiation. Over the forecast horizon, the Asia Pacific co-working office space market size within large-format assets is projected to rise steadily as more multinational corporations shift from single-tenant leases to managed-space solutions.
Complete Report Scope:
- By Size & Scale of Facility
- Small
- Medium
- Large
- By Sector
- Information Technology (IT and ITES)
- BFSI (Banking, Financial Services and Insurance)
- Business Consulting & Professional Service
- Other Services (Retail, Lifesciences, Energy, Legal Services)
- By End Use
- Freelancers
- Enterprises
- Start Ups and Others
- By Country
- China
- India
- Japan
- South Korea
- Australia
- Indonesia
- Rest of Asia-Pacific
List of Companies Covered in this Report:
- IWG (Regus, Spaces)
- WeWork
- The Executive Centre (TEC)
- JustCo
- Awfis
- Compass Offices
- Servcorp
- CoWrks
- Smartworks
- GoWork (India)
- Ucommune
- KrSpace
- Distrii
- FastFive
- SparkPlus
- KLOUD
- Bee+
- The Hive
- CommonGrounds
- Industrious APAC JV
Additional Benefits:
- The market estimate (ME) sheet in Excel format
- 3 months of analyst support
TABLE OF CONTENTS
1 Introduction
- 1.1 Study Assumptions & Market Definition
- 1.2 Scope of the Study
2 Research Methodology
3 Executive Summary
4 Market Landscape
- 4.1 Market Overview
- 4.2 Market Drivers
- 4.2.1 Rapid urbanization and start-up growth in China, India, and Southeast Asia fueling demand
- 4.2.2 Widespread adoption of hybrid work models across corporates and MNCs
- 4.2.3 International and regional co-working operators aggressively expanding across APAC cities
- 4.2.4 Government innovation programs and tech parks supporting co-working ecosystems
- 4.2.5 Growing tenant preference for flexible, scalable, and community-driven workspaces
- 4.3 Market Restraints
- 4.3.1 Oversupply risks in mature markets like China and India creating pricing pressures
- 4.3.2 Regulatory and compliance challenges across diverse APAC jurisdictions
- 4.3.3 High fit-out and operational costs impacting profitability for operators in premium locations
- 4.4 Value / Supply-Chain Analysis
- 4.4.1 Overview
- 4.4.2 Real Estate Developers and Asset Owners - Key Quantitative and Qualitative Insights
- 4.4.3 Workspace Design and Technology Consultants - Key Quantitative and Qualitative Insights
- 4.4.4 Modular Furniture and Smart Office Solutions Providers - Key Quantitative and Qualitative Insights
- 4.5 Government Regulations and Initiatives in the Industry
- 4.6 Technological Innovations in the Co-Working Office Space Real Estate Market
- 4.7 Insights into the Key Office Real Estate Industry Metrics (Supply, Rentals, Prices, Occupancy/Vacancy (%))
- 4.8 Impact of Remote Working on Space Demand
- 4.9 Porter's Five Forces
- 4.9.1 Bargaining Power of Suppliers
- 4.9.2 Bargaining Power of Buyers
- 4.9.3 Threat of New Entrants
- 4.9.4 Threat of Substitutes
- 4.9.5 Intensity of Competitive Rivalry
5 Market Size & Growth Forecasts (Value USD)
- 5.1 By Size & Scale of Facility
- 5.1.1 Small
- 5.1.2 Medium
- 5.1.3 Large
- 5.2 By Sector
- 5.2.1 Information Technology (IT and ITES)
- 5.2.2 BFSI (Banking, Financial Services and Insurance)
- 5.2.3 Business Consulting & Professional Service
- 5.2.4 Other Services (Retail, Lifesciences, Energy, Legal Services)
- 5.3 By End Use
- 5.3.1 Freelancers
- 5.3.2 Enterprises
- 5.3.3 Start Ups and Others
- 5.4 By Country
- 5.4.1 China
- 5.4.2 India
- 5.4.3 Japan
- 5.4.4 South Korea
- 5.4.5 Australia
- 5.4.6 Indonesia
- 5.4.7 Rest of Asia-Pacific
6 Competitive Landscape
- 6.1 Market Concentration
- 6.2 Strategic Moves
- 6.3 Company Profiles {(includes Global level Overview, Market level overview, Core Segments, Financials as available, Strategic Information, Products & Services, and Recent Developments)}
- 6.3.1 IWG (Regus, Spaces)
- 6.3.2 WeWork
- 6.3.3 The Executive Centre (TEC)
- 6.3.4 JustCo
- 6.3.5 Awfis
- 6.3.6 Compass Offices
- 6.3.7 Servcorp
- 6.3.8 CoWrks
- 6.3.9 Smartworks
- 6.3.10 GoWork (India)
- 6.3.11 Ucommune
- 6.3.12 KrSpace
- 6.3.13 Distrii
- 6.3.14 FastFive
- 6.3.15 SparkPlus
- 6.3.16 KLOUD
- 6.3.17 Bee+
- 6.3.18 The Hive
- 6.3.19 CommonGrounds
- 6.3.20 Industrious APAC JV
7 Market Opportunities & Future Outlook

 英國彈性辦公空間:市場佔有率分析、產業趨勢與統計及成長預測(2026-2031)
 節能型辦公空間市場分析及預測(至2035年):依類型、產品、服務、技術、組件、應用、材料類型、部署方式、最終用戶及解決方案分類
 共享辦公空間市場規模、佔有率和成長分析:按空間類型、經營模式、最終用戶、應用、產業、會員期限和地區分類-2026-2033年產業預測北美共享辦公空間:市場佔有率分析、產業趨勢與統計及成長預測(2026-2031)南美洲共享辦公空間:市場佔有率分析、產業趨勢與統計及成長預測(2026-2031 年)印度共享辦公空間:市場佔有率分析、產業趨勢與統計及成長預測(2026-2031)美國共享辦公空間:市場佔有率分析、產業趨勢與統計及成長預測(2026-2031)
 辦公空間市場規模、佔有率和成長分析:按物業類型、等級、租賃類型、公司規模、最終用途產業、用途和地區分類-2026-2033年產業預測印度彈性辦公空間:市場佔有率分析、產業趨勢與統計及成長預測(2026-2031)
 共享辦公空間市場:按類型、產品類型、營運模式、產業和最終用戶分類-2026-2032年全球市場預測