


 |
市場調查報告書
商品編碼
2098501
中東和非洲人工智慧能源管理軟體:市場佔有率分析、行業趨勢和統計數據以及成長預測(2026-2031 年)Middle East and Africa AI-powered Energy Management Software - Market Share Analysis, Industry Trends & Statistics, Growth Forecasts (2026 - 2031) |
||||||

※ 本網頁內容可能與最新版本有所差異。詳細情況請與我們聯繫。
據 Mordor Intelligence 稱,中東和非洲的 AI 能源管理軟體市場預計將從 2025 年的 3.1312 億美元和 2026 年的 3.7925 億美元成長到 2031 年的 9.886 億美元,2026 年至 2031 年的年複合成長率(CAGR)為 21.12%。
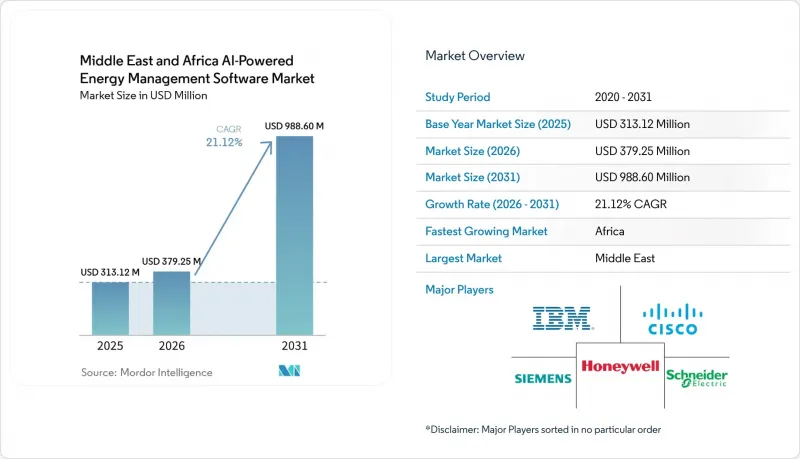
本報告按組件(軟體和服務)、部署模式(雲端、本地部署、混合部署)、應用程式(資產性能和預測性維護、可再生能源預測和整合等)、最終用戶(公共產業、工業設施等)以及地區進行細分。市場預測以價值(美元)表示。
中東和非洲人工智慧能源管理軟體市場的趨勢和洞察
對智慧電網和分散式能源資源編配的需求日益成長
在中東和非洲,智慧電網和分散式能源資源編配日益成長的需求仍然是人工智慧驅動的能源管理軟體市場最顯著的需求推動要素。這是因為公用事業公司需要更好地控制其不斷擴大的數位化電網資產。沙烏地阿拉伯已安裝超過1,000萬個智慧電錶,並計畫在2025年前實現32%的配電網路自動化。這擴大了人工智慧軟體在電網規劃和負載平衡方面的可用資料集。杜拜水電局(DEWA)已在其智慧電網專案上投資20億美元,這意味著公用事業公司的軟體採購與多年基礎設施投資掛鉤,而非短期試點預算。西門子報告稱,到2026年,中東地區64%的機構認為智慧電網和電網軟體對於能源轉型至關重要,而62%的機構表示電網限制阻礙了電氣化進程。不斷成長的數據量和日益明顯的電網限制使得能夠輔助發電控制、預測停電和協調分散式能源資源(DER)的軟體在採購中扮演越來越重要的角色。在非洲的電力系統中,為撒哈拉以南非洲的太陽能應用而開發的可解釋混合人工智慧預測技術的應用,也顯示了電力公司為何正在轉向能夠提高可靠性並管理可再生能源波動性的軟體。
能源成本波動和最佳化尖峰需求的壓力
由於能源成本波動和高峰需求壓力,中東和非洲的人工智慧能源管理軟體市場正日益成為商業和工業用戶營運預算中不可或缺的一部分。發表在《能源戰略評論》(Energy Strategy Reviews)上的一項研究表明,儘管人工智慧和數位經濟是海灣合作理事會(GCC)能源轉型的重要積極驅動力,但油價上漲正對高能耗領域產生負面影響。這一點至關重要,因為價格風險和與燃料掛鉤的能源成本會縮短高峰運作期間自動需求控制的投資回收期。在沿岸地區,夏季冷氣需求減少了人工能源管理的空間,凸顯了暖通空調系統和負載調度持續最佳化的價值。即使是過去僅將軟體視為提高效率的附加功能的大型設施,現在也將其視為抵禦成本波動和避免尖峰時段罰款的保障。在商業資產組合和工業設施長期運作且面臨日益嚴格的能源績效要求的地區,這種情況尤其明顯。
將傳統OT系統與建築管理系統整合起來的複雜性。
在中東和非洲,將傳統營運技術 (OT) 系統與建築管理系統整合的複雜性仍然是人工智慧驅動的能源管理軟體市場短期內最大的限制因素。該地區許多能源和公共產業機構仍在運作SCADA、DCS 和建築控制系統,這些系統早在人工智慧整合成為設計要求之前就已經部署。供應商常常被迫應對多重通訊協定環境,例如 Modbus、DNP3、IEC 61850 和專有建築介面在同一設施內共存,這增加了整合所需的時間和測試工作量。一份關於阿拉伯聯合大公國 2026 年 OT 安全性的報告強調了對受保護運行環境和本地控制安全層的日益重視,這反映了為什麼棕地整合被視為高風險項目,而不僅僅是軟體部署。因此,即使競爭對手宣稱擁有更強大的演算法,買家也傾向於選擇擁有成熟中間件和協議適配器的供應商。這種趨勢在老舊的工業和商業設施中尤其明顯,因為這些設施的停機成本很高,很難證明完全更換控制系統的合理性。
細分市場分析
到2025年,軟體在整體元件中的佔比將達到67.44%,成為中東和非洲人工智慧能源管理軟體市場中最顯著的收入支柱。海灣合作理事會(GCC)國家的買家更傾向於在現有智慧電錶、SCADA設備和建築系統之上建立分析、數位孿生和預測層,而不是等待完整的硬體升級週期。這種做法符合該地區目前的投資模式,因為許多業者已經擁有部分數位基礎設施,但仍缺乏持續最佳化和決策支援。隨著國有公共產業和大規模業主擴大資料收集範圍,軟體成為創造價值的最快路徑,因為它無需從頭開始重建即可改善調度、預測和故障檢測。因此,這種構成比反映了一種市場趨勢:先實現智慧貨幣化,然後再進行物理升級。
儘管軟體產業在2025年仍是最大的收入來源,但隨著與現有設施的整合以及模型的持續調整,服務業也在迅速擴張,幾乎每次部署都需要人工參與。 2026年6月,杜拜水電局(DEWA)推出了“人工智慧虛擬工程師”,該工程師可提供故障預測警報、根本原因分析以及覆蓋整個電網的即時場景模擬,這表明公共產業除了軟體功能外,還在為嵌入式工程能力付費。人工智慧在可再生能源系統中的應用正在帶來可衡量的營運效益,並支援在需要協調和監控的專案中提高服務滲透率。這種轉變有利於那些能夠將平台授權與部署、整合和長期支援整合到單一合約中的供應商。這也意味著服務品質正成為選擇供應商的重要因素,尤其是當使用者需要協助將軟體輸出轉換為發電指令、維護或建築控制作業時。
儘管在2025年,基於雲端的部署佔據了最大的市場佔有率,但預計在2026年至2031年間,中東和非洲人工智慧能源管理軟體市場的混合部署市場將以23.15%的複合年成長率成長。電力公司和建築管理人員青睞雲,因為他們需要可擴展的分析功能,但又不想承擔建置專用伺服器的前期成本。雲端也適用於需要集中式儀錶板和跨分散式資產快速部署的多站點專案。在一些較不敏感的應用情境中,採用雲端環境可以減輕內部IT維運的工作量,並簡化軟體更新管理。因此,雲端在部署量方面保持領先地位,尤其是在速度和成本控制優先於嚴格的主權法規的情況下。
混合部署的增加源自於關鍵能源營運商希望利用雲端的柔軟性進行敏感度較低的分析,同時將資料營運管理保留在資產附近。阿拉伯聯合大公國網路安全委員會和西門子於2026年正式簽署了OT安全合作夥伴關係,將「SINEC Guard」部署到阿拉伯聯合大公國的雲端基礎設施。這凸顯了雙方致力於為本地管理的營運資料建立受保護架構的承諾。在海水淡化、石化和其他關鍵設施中,由於合約或監管要求禁止任何資料外流,本地部署系統仍然佔據主導地位。因此,一種由三部分組成的部署模式已經出現,而非「贏家通吃」的模式,供應商在雲端深度、本地託管和OT整合能力方面持續展開激烈競爭。買方的決策越來越注重滿足每項工作負荷的風險、延遲和合規性要求,而非意識形態。
其他好處:
- Excel格式的市場預測(ME)表
- 3個月的分析師支持
目錄
第1章:引言
- 研究假設和市場定義
- 調查範圍
第2章:調查方法
第3章執行摘要
第4章 市場狀況
- 市場概覽
- 市場促進因素
- 對智慧電網和分散式能源資源編配的需求日益成長
- 能源成本波動和最佳化尖峰需求的壓力
- 資料中心和商業不動產的節能維修
- 電力公司引入需量反應和動態定價自動化
- 針對關鍵能源資產的本地人工智慧控制及網路安全措施
- 最佳化海水淡化和區域供冷領域的下一代水資源和能源。
- 市場限制因素
- 將傳統OT系統與建築管理系統整合起來的複雜性。
- 日本人工智慧和能源分析領域人才短缺。
- 資料主權與跨境雲端託管的限制
- 維修現有設施和安裝感測器的初期成本很高。
- 產業價值鏈分析
- 宏觀經濟因素對市場的影響
- 監理情勢
- 技術展望
- 波特五力分析
第5章 市場規模與成長預測
- 按組件
- 軟體
- 服務
- 部署模式
- 基於雲端的
- 現場
- 混合
- 透過使用
- 最佳化能源消耗和需求
- 資產性能和預測性維護
- 智慧電網與分散式能源(DER)的管理
- 可再生能源預測與整合
- 能源交易、定價和市場訊息
- 最終用戶
- 公用事業
- 商業建築
- 工業設施
- 住宅大樓
- 按地區
- 中東
- 沙烏地阿拉伯
- 阿拉伯聯合大公國
- 土耳其
- 其他中東國家
- 非洲
- 南非
- 埃及
- 其他非洲國家
- 中東
第6章 競爭情勢
- 市場集中度
- 策略趨勢
- 市佔率分析
- 公司簡介
- Schneider Electric SE
- Siemens AG
- Johnson Controls International plc
- Honeywell International Inc.
- ABB Ltd
- IBM Corporation
- Cisco Systems, Inc.
- Emerson Electric Co.
- Eaton Corporation plc
- Delta Electronics, Inc.
- Trane Technologies plc
- Carrier Global Corporation
- DNV AS
- Vertiv Holdings Co
- Planon Group BV
- Spacewell International NV
- GridPoint, Inc.
- Verdigris Technologies, Inc.
- C3.ai, Inc.
- Enel X Way Srl
第7章 市場機會與未來展望
According to Mordor Intelligence, the Middle East and Africa AI-powered Energy Management Software Market size is projected to expand from USD 313.12 million in 2025 and USD 379.25 million in 2026 to USD 988.60 million by 2031, registering a CAGR of 21.12% between 2026 and 2031.
This report is Segmented by Component (Software, and Services), Deployment Mode (Cloud-Based, On-Premises, and Hybrid), Application (Asset Performance and Predictive Maintenance, Renewable Energy Forecasting and Integration, and More), End User (Utilities, Industrial Facilities, and More), and Geography. The Market Forecasts are Provided in Terms of Value (USD).
Middle East and Africa AI-powered Energy Management Software Market Trends and Insights
Rising Smart Grid and Distributed Energy Resource Orchestration Needs
Rising smart grid and distributed energy resource orchestration needs remain the clearest demand driver for the Middle East and Africa AI-powered Energy Management Software Market, as utilities need better control over expanding digital grid assets. Saudi Arabia had installed more than 10 million smart meters and automated 32% of its distribution network by 2025, expanding the usable data set for AI software in grid planning and load balancing. DEWA had already committed USD 2 billion to its smart grid program, which kept utility software procurement tied to multi-year infrastructure spending rather than short pilot budgets. Siemens reported in 2026 that 64% of Middle East organizations viewed smart grids and grid software as crucial to the energy transition, while 62% said grid limitations were holding back electrification. That mix of larger data volumes and visible grid constraints has made software capable of dispatch support, outage prediction, and DER coordination more central to procurement. In African power systems, explainable hybrid AI forecasting work for Sub-Saharan solar applications also showed why utilities are moving toward software that can improve reliability while managing renewable variability.
Energy Cost Volatility and Peak Demand Optimization Pressure
Energy cost volatility and peak demand pressure are pushing the Middle East and Africa AI-powered Energy Management Software Market into more routine operating budgets for commercial and industrial users. Research published in Energy Strategy Reviews found that AI and the digital economy were significant positive drivers of the GCC energy transition, while higher oil prices had a negative effect at higher consumption quantiles. That result matters because tariff exposure and fuel-linked energy costs shorten the payback period for automated demand control during peak operating periods. In the Gulf, summer cooling demand narrows the margin for manual energy management and increases the value of continuous optimization across HVAC systems and load scheduling. Large sites that once treated software as an efficiency add-on now view it as protection against recurring cost swings and avoidable peak penalties. This driver is strongest where commercial portfolios and industrial facilities operate long hours and face tighter energy performance expectations.
Legacy OT and Building Management System Integration Complexity
The complexity of legacy OT and building management system integration remains the largest near-term brake on the Middle East and Africa AI-powered Energy Management Software Market. Many energy and utility environments in the region still run SCADA, DCS, and building control systems installed long before AI integration became a design requirement. Vendors often face multi-protocol settings that combine Modbus, DNP3, IEC 61850, and proprietary building interfaces within a single facility, which extends integration time and testing effort. A 2026 report on OT security in the UAE highlighted the growing focus on protected operational environments and locally controlled security layers, which reflects why brownfield integrations are treated as high-risk projects rather than simple software rollouts. This pushes buyers toward vendors with proven middleware and protocol adapters, even when rival suppliers claim stronger algorithms. The effect is strongest in older industrial sites and commercial facilities where shutdowns are costly and full control system replacement remains hard to justify.
Other drivers and restraints analyzed in the detailed report include:
- Data Center and Commercial Real Estate Efficiency Retrofits
- Utility Demand Response and Dynamic Tariff Automation Adoption
- Limited In-Country AI and Energy Analytics Talent
For complete list of drivers and restraints, kindly check the Table Of Contents.
Segment Analysis
Software accounted for 67.44% of the component mix in 2025, making it the clearest revenue anchor in the Middle East and Africa AI-powered Energy Management Software Market. Buyers across the GCC favored analytics, digital twin, and predictive layers that could sit above installed smart meters, SCADA assets, and building systems rather than wait for full hardware renewal cycles. This approach aligned with the region's current investment pattern, as many operators already had partial digital infrastructure but still lacked continuous optimization and decision support. As sovereign utilities and large property owners expanded their data capture, software became the fastest route to value because it could improve scheduling, forecasting, and fault awareness without a ground-up rebuild. The component structure, therefore, reflected a market that is monetizing intelligence first and physical replacement second.
Services are expanding quickly, even though the largest 2025 revenue pool sat in software, because brownfield integration and ongoing model calibration add a labor layer to almost every deployment. DEWA deployed its AI Virtual Engineer in June 2026 to provide predictive failure alerts, root-cause analysis, and real-time scenario simulation across the power network, demonstrating how utilities are paying for embedded engineering capability alongside software functions. AI in renewable energy systems is delivering measurable operational gains, supporting stronger service attachment rates in projects that need tuning and oversight. This shift favors suppliers that can combine platform licensing with implementation, integration, and long-run support under a single contract. It also means that service quality is becoming part of vendor selection, especially where users need help converting software outputs into dispatch, maintenance, or building control actions.
Cloud-based deployment held the largest position in 2025, while the Middle East and Africa AI-powered Energy Management Software Market size for hybrid deployment is projected to expand at 23.15% CAGR between 2026 and 2031. Cloud appealed to utilities and building managers who wanted scalable analytics without the upfront burden of dedicated server builds. It also fits multi-site portfolios that need centralized dashboards and faster rollout across dispersed assets. In less sensitive use cases, cloud setups reduced internal IT workloads and made software updates easier to manage. That kept the cloud at the front of volume adoption, especially where speed and cost discipline mattered more than strict sovereignty rules.
Hybrid deployment is rising because critical energy operators want cloud flexibility for non-sensitive analytics while keeping operational control of data closer to the asset. The UAE Cybersecurity Council and Siemens formalized an OT security collaboration in 2026, with SINEC Guard deployed on the UAE cloud infrastructure, underscoring the push for protected architectures with local control over operational data. On-premises systems still hold a secure place in desalination, petrochemical, and other critical facilities where zero data egress is a contractual or regulatory requirement. The result is a three-part deployment pattern rather than a winner-takes-all model, and that keeps vendor competition open across cloud depth, local hosting, and OT integration capability. For buyers, the decision is less about ideology and more about matching risk, latency, and compliance needs to each workload.
Complete Report Scope:
- By Component
- Software
- Services
- By Deployment Mode
- Cloud-Based
- On-Premises
- Hybrid
- By Application
- Energy Consumption and Demand Optimization
- Asset Performance and Predictive Maintenance
- Smart Grid and Distributed Energy Resource (DER) Management
- Renewable Energy Forecasting and Integration
- Energy Trading, Pricing and Market Intelligence
- By End User
- Utilities
- Commercial Buildings
- Industrial Facilities
- Residential Buildings
- By Geography
- Middle East
- Saudi Arabia
- United Arab Emirates
- Turkey
- Rest of Middle East
- Africa
- South Africa
- Egypt
- Rest of Africa
- Middle East
List of Companies Covered in this Report:
- Schneider Electric SE
- Siemens AG
- Johnson Controls International plc
- Honeywell International Inc.
- ABB Ltd
- IBM Corporation
- Cisco Systems, Inc.
- Emerson Electric Co.
- Eaton Corporation plc
- Delta Electronics, Inc.
- Trane Technologies plc
- Carrier Global Corporation
- DNV AS
- Vertiv Holdings Co
- Planon Group B.V.
- Spacewell International N.V.
- GridPoint, Inc.
- Verdigris Technologies, Inc.
- C3.AI, Inc.
- Enel X Way S.r.l.
Additional Benefits:
- The market estimate (ME) sheet in Excel format
- 3 months of analyst support
TABLE OF CONTENTS
1 INTRODUCTION
- 1.1 Study Assumptions and Market Definition
- 1.2 Scope of the Study
2 RESEARCH METHODOLOGY
3 EXECUTIVE SUMMARY
4 MARKET LANDSCAPE
- 4.1 Market Overview
- 4.2 Market Drivers
- 4.2.1 Rising Smart Grid and Distributed Energy Resource Orchestration Needs
- 4.2.2 Energy Cost Volatility and Peak Demand Optimization Pressure
- 4.2.3 Data Center and Commercial Real Estate Efficiency Retrofits
- 4.2.4 Utility Demand Response and Dynamic Tariff Automation Adoption
- 4.2.5 Cybersecure On-Premises AI Control for Critical Energy Assets
- 4.2.6 Water-Energy Nexus Optimization in Desalination and District Cooling
- 4.3 Market Restraints
- 4.3.1 Legacy OT and Building Management System Integration Complexity
- 4.3.2 Limited In-Country AI and Energy Analytics Talent
- 4.3.3 Data Sovereignty and Cross-Border Cloud Hosting Constraints
- 4.3.4 High Upfront Retrofit and Sensorization Costs for Brownfield Sites
- 4.4 Industry Value Chain Analysis
- 4.5 Impact of Macroeconomic Factors on the Market
- 4.6 Regulatory Landscape
- 4.7 Technological Outlook
- 4.8 Porter's Five Forces Analysis
- 4.8.1 Bargaining Power of Suppliers
- 4.8.2 Bargaining Power of Buyers
- 4.8.3 Threat of New Entrants
- 4.8.4 Threat of Substitutes
- 4.8.5 Competitive Rivalry
5 MARKET SIZE AND GROWTH FORECASTS (VALUE)
- 5.1 By Component
- 5.1.1 Software
- 5.1.2 Services
- 5.2 By Deployment Mode
- 5.2.1 Cloud-Based
- 5.2.2 On-Premises
- 5.2.3 Hybrid
- 5.3 By Application
- 5.3.1 Energy Consumption and Demand Optimization
- 5.3.2 Asset Performance and Predictive Maintenance
- 5.3.3 Smart Grid and Distributed Energy Resource (DER) Management
- 5.3.4 Renewable Energy Forecasting and Integration
- 5.3.5 Energy Trading, Pricing and Market Intelligence
- 5.4 By End User
- 5.4.1 Utilities
- 5.4.2 Commercial Buildings
- 5.4.3 Industrial Facilities
- 5.4.4 Residential Buildings
- 5.5 By Geography
- 5.5.1 Middle East
- 5.5.1.1 Saudi Arabia
- 5.5.1.2 United Arab Emirates
- 5.5.1.3 Turkey
- 5.5.1.4 Rest of Middle East
- 5.5.2 Africa
- 5.5.2.1 South Africa
- 5.5.2.2 Egypt
- 5.5.2.3 Rest of Africa
- 5.5.1 Middle East
6 COMPETITIVE LANDSCAPE
- 6.1 Market Concentration
- 6.2 Strategic Moves
- 6.3 Market Share Analysis
- 6.4 Company Profiles (includes Global Level Overview, Market Level Overview, Core Segments, Financials as available, Strategic Information, Market Rank/Share, Products and Services, Recent Developments)
- 6.4.1 Schneider Electric SE
- 6.4.2 Siemens AG
- 6.4.3 Johnson Controls International plc
- 6.4.4 Honeywell International Inc.
- 6.4.5 ABB Ltd
- 6.4.6 IBM Corporation
- 6.4.7 Cisco Systems, Inc.
- 6.4.8 Emerson Electric Co.
- 6.4.9 Eaton Corporation plc
- 6.4.10 Delta Electronics, Inc.
- 6.4.11 Trane Technologies plc
- 6.4.12 Carrier Global Corporation
- 6.4.13 DNV AS
- 6.4.14 Vertiv Holdings Co
- 6.4.15 Planon Group B.V.
- 6.4.16 Spacewell International N.V.
- 6.4.17 GridPoint, Inc.
- 6.4.18 Verdigris Technologies, Inc.
- 6.4.19 C3.ai, Inc.
- 6.4.20 Enel X Way S.r.l.
7 MARKET OPPORTUNITIES AND FUTURE OUTLOOK
- 7.1 White-space and Unmet-Need Assessment

 2034年人工智慧市場在發電領域的預測-按組件、部署模式、人工智慧技術、電源、應用、企業規模、最終用戶和地區分類的全球分析
 人工智慧在能源市場的應用:市場規模、佔有率、成長、全球產業分析、區域趨勢及2026-2034年預測電力產業人工智慧市場規模、佔有率、成長、全球產業分析、區域趨勢以及2026-2034年的預測
 全球能源電力領域人工智慧(AI)市場:機會與策略展望(至2035年)
 中國人工智慧能源管理軟體:市場佔有率分析、產業趨勢與統計及成長預測(2026-2031)中東地區人工智慧能源管理軟體:市場佔有率分析、行業趨勢和統計數據以及成長預測(2026-2031 年)南美洲人工智慧能源管理軟體:市場佔有率分析、行業趨勢和統計數據以及成長預測(2026-2031 年)印度人工智慧能源管理軟體:市場佔有率分析、行業趨勢和統計數據以及成長預測(2026-2031 年)德國人工智慧能源管理軟體:市場佔有率分析、行業趨勢和統計數據以及成長預測(2026-2031 年)新加坡人工智慧能源管理軟體:市場佔有率分析、行業趨勢和統計數據以及成長預測(2026-2031 年)