


 |
市場調查報告書
商品編碼
2097463
印度人工智慧能源管理軟體:市場佔有率分析、行業趨勢和統計數據以及成長預測(2026-2031 年)India AI-powered Energy Management Software - Market Share Analysis, Industry Trends & Statistics, Growth Forecasts (2026 - 2031) |
||||||

※ 本網頁內容可能與最新版本有所差異。詳細情況請與我們聯繫。
根據 Mordor Intelligence 預測,印度人工智慧能源管理軟體市場規模預計將在 2025 年達到 1.543 億美元,到 2031 年達到 5.632 億美元,2026 年至 2031 年的複合年成長率為 24.43%。
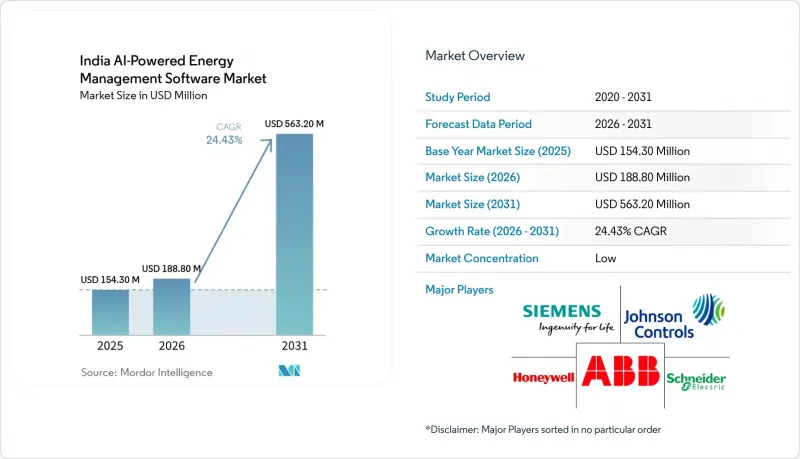
本報告按元件(軟體和服務)、部署模式(雲端、本地部署、混合部署)、應用(例如,能源消耗和需求最佳化、資產性能和預測性維護)以及最終用戶(例如,公共產業、商業建築、工業設施)進行細分。市場預測以美元計價。
印度人工智慧能源管理軟體市場趨勢與洞察。
商業設施能源成本上漲和高峰需求費用增加
各邦電費的調整使得大規模工商業用戶在能源成本管理上面臨更大的挑戰。泰米爾納德邦電力監管委員會已將工業用電價格上調3.4%,至每千瓦時7.5印度盧比(約合每千瓦時0.079美元),並將需求電價上調至每月每千伏安608印度盧比(約合每千伏安6.43美元),新電價將於2025年有效,2025年其他主要工業邦的高壓用電需求者也面臨類似的壓力,這使得在預算談判中採用能源最佳化軟體變得更加合理。其直接價值在於主導人工智慧在用電尖峰時段(15分鐘)進行負載轉移,因為在印度現行的收費系統下,這段時間的電費波動最為顯著。在印度的人工智慧能源管理軟體市場,這意味著需求最佳化仍然是商業設施和工廠實現實際成本節約的最快路徑之一。
智慧電錶的普及將提高高頻能源數據的可用性。
印度智慧電錶的部署顯著擴展了電力公司和服務供應商獲取區間級用電量資料的基礎設施。截至2025年12月,已部署5,280萬台智慧電錶,與產業現代化相關的廣泛配電基礎設施投資計畫總額達到11.2兆印度盧比(約1,310億美元)。 2026年,印度電力部指示電力營運商將人工智慧和機器學習的應用案例從試驗計畫階段推進到下一階段。這使得需求預測、損耗分析和預測性維護更接近實際運作。已批准的電錶數量與實際安裝的電錶數量之間的差距也給高級計量基礎設施(AMI)提供者帶來了壓力,因為運作計劃的延遲增加了對更強大的預測和分析支援的需求。 2026年對電錶讀數安裝和運行規則的修訂也改善了互通性,這至關重要,因為模型準確性取決於更清晰、更標準化的資料流。
碎片化的傳統OT和BMS資料延遲模型部署。
印度大部分電力和大型建築基礎設施仍然運作在過時的SCADA、BMS和PLC環境中,這些系統在設計之初並未考慮IT和OT的無縫整合。這導致不同站點、供應商和協議版本之間的資料標準化問題,部署時間從數週延長至數月。在公共產業和大型工業設施中,由於不同代控制系統通常並行運作,且各自產生不同格式的數據,這個問題變得更加複雜。Honeywell於2026年2月與TCS印度公司建立合作關係,旨在透過結合OT連接、基於雲端的現代化改造和人工智慧主導的營運支持,直接解決這一問題。因此,整合能力不再只是實施細節,而是印度人工智慧能源管理軟體市場的核心差異化因素。
細分市場分析
到2025年,印度人工智慧能源管理軟體市場中,軟體將佔66.21%的佔有率,而這一類別的驅動力將是平台主導的採購模式,而非孤立的工具。買家之所以青睞軟體,是因為它能夠將需求預測、資產診斷和可再生能源整合到統一的營運層,而非多個獨立的應用程式。這一點至關重要,因為公共產業和大規模工業集團通常需要一個統一的記錄系統來管理多個地點的能源績效。此外,軟體合約的經常性收入模式也符合高度監管領域和能源密集產業優先考慮長期平台管理的趨勢。
預計到2031年,服務市場將以25.47%的複合年成長率成長,顯示隨著部署環境向更複雜的營運環境轉移,實施工作的重要性日益凸顯。已購買軟體的公司越來越需要託管分析、整合支援和站點級模型調整,才能使營運價值顯現。Honeywell和塔塔諮詢服務公司(TCS)的合作體現了這一轉變,將傳統營運技術(OT)與新型雲端分析的融合定位為一項持續服務,而非一次性設定。此外,與建築能源效率標準(BEE)中環境控制建築規範(ECBC)相關的測量和管理要求也為供應商透過軟體升級和相關服務進行開發奠定了基礎。
預計到2025年,印度人工智慧能源管理軟體市場中,基於雲端的部署將佔56.17%。這主要得益於較低的初始成本和便捷的分析密集型運算資源。商業建築營運商和中型工業用戶更傾向於選擇雲端服務,因為它能夠縮短部署時間,並避免對本地基礎設施進行大規模投資。在市場層面,這促使雲端服務在對速度和成本要求不高的運作環境中成為預設選擇,而非嚴格的資料管理。此外,印度超大規模雲端基礎設施的日益普及也使得基於雲端的解決方案成為依賴即時分析的軟體供應商更為現實的選擇。
預計到2031年,混合部署將以25.58%的複合年成長率成長,以平衡雲端效率和本地控制之間的衝突需求。在監管嚴格的電力和公共產業領域,買家通常希望將敏感的OT資料保留在本地,同時將不太關鍵的分析工作負載遷移到雲端。因此,架構柔軟性正成為採購的重要要求,尤其對於配電營運商、發電企業和併網用戶而言更是如此。 ABB將於2026年發布支援邊緣、本地和雲端部署的BuildingPro Suites,這正反映了這種「混合優先」的發展方向。
其他好處:
- Excel格式的市場預測(ME)表
- 3個月的分析師支持
目錄
第1章:引言
- 研究假設和市場定義
- 調查範圍
第2章:調查方法
第3章執行摘要
第4章 市場狀況
- 市場概覽
- 市場促進因素
- 商業設施能源成本上漲和高峰需求費用增加
- 智慧電錶的引入擴大了高頻能源數據的利用潛力。
- 我們致力於實現淨零能耗,並以此推動我們正在進行的能源最佳化計畫。
- 分散式能源資源的擴張增加了對人工智慧驅動的編配的需求。
- 現有的建築存量需要維修,這為軟體主導的節能創造了巨大的商機。
- 多站點企業對遠端監控的需求日益成長,正在加速遠端監控技術的普及應用。
- 市場限制因素
- 分散的遺留OT和BMS資料延緩了模型的實作。
- 網路安全和資料主權問題限制了關鍵地點對雲端技術的採用。
- 由於公司內部人工智慧和能源分析技能不足,實施速度緩慢。
- 由於銷售週期延長和資本投資優先順序降低,企業正在推遲採購。
- 宏觀經濟因素對市場的影響
- 產業價值鏈分析
- 監理情勢
- 技術展望
- 波特五力分析
第5章 市場規模與成長預測
- 按組件
- 軟體
- 服務
- 部署模式
- 基於雲端的
- 現場
- 混合
- 透過使用
- 最佳化能源消耗和需求
- 資產性能和預測性維護
- 智慧電網與分散式能源(DER)的管理
- 可再生能源預測與整合
- 能源交易、定價和市場訊息
- 最終用戶
- 公用事業
- 商業建築
- 工業設施
- 住宅大樓
第6章 競爭情勢
- 市場集中度
- 策略趨勢
- 市佔率分析
- 公司簡介
- Schneider Electric SE
- Siemens AG
- Johnson Controls International plc
- Honeywell International Inc.
- ABB Ltd
- Eaton Corporation plc
- Emerson Electric Co.
- IBM Corporation
- Microsoft Corporation
- Oracle Corporation
- SAP SE
- C3.ai, Inc.
- BrainBox AI Inc.
- GridPoint, Inc.
- Verdigris Technologies, Inc.
- Uplight, Inc.
- AutoGrid Systems, Inc.
- EnergyCAP, LLC
- Amp X Ltd.
- GNA Energy
- Greenovative Energy
- Tata Power
- AutoGrid Systems, Inc.
- EnerCog
第7章 市場機會與未來展望
According to Mordor Intelligence, the India AI-powered energy management software market size was USD 154.3 million in 2025 and is projected to reach USD 563.2 million by 2031, registering a CAGR of 24.43% during 2026-2031.
This report is Segmented by Component (Software, and Services), Deployment Mode (Cloud-Based, On-Premises, and Hybrid), Application (Energy Consumption and Demand Optimization, Asset Performance and Predictive Maintenance, and More), and End User (Utilities, Commercial Buildings, Industrial Facilities, and More). The Market Forecasts are Provided in Terms of Value (USD).
India AI-powered Energy Management Software Market Trends and Insights
Rising Energy Tariffs and Peak-Demand Charges Across Commercial Facilities
Electricity tariff revisions across states have made energy costs harder to manage for large commercial and industrial users. The Tamil Nadu Electricity Regulatory Commission raised industrial tariffs by 3.4% to INR 7.5 per kWh (USD 0.079 USD per kWh) and increased demand charges to INR 608 per kVA (USD 6.43 per kVA) per month for FY2026, effective July 1, 2025. Similar pressure has been building in other high-tension consumer categories across major industrial states, making energy optimization software easier to justify in budget discussions. The direct value comes from AI-led load shifting during 15-minute peak intervals, because that is where India's tariff structure creates the sharpest billing exposure. In the India AI-powered Energy Management Software Market, this means demand optimization remains one of the quickest paths to visible savings for commercial campuses and factories.
Smart Meter Rollout Expands High-Frequency Energy Data Availability
India's smart meter rollout has created a much larger base of interval-level consumption data for utilities and service providers. By December 2025, 52.8 million smart meters had been deployed, and the broader distribution capex pipeline tied to sector modernization reached INR 11.2 trillion (USD 131 billion). In 2026, the Ministry of Power directed utilities to move AI and ML use cases beyond pilot programs, which pushed demand forecasting, loss analysis, and predictive maintenance into a more operational stage. The gap between sanctioned meters and installed meters has also put pressure on AMI providers, as delayed go-live schedules increase the need for stronger forecasting and analytics support. The 2026 amendment to the meter installation and operation rules also improved interoperability conditions, which matters because model accuracy depends on cleaner, more standardized data flows.
Fragmented Legacy OT and BMS Data Slows Model Deployment
Much of India's power and large-building infrastructure still runs on older SCADA, BMS, and PLC environments that were not built for smooth IT and OT integration. That creates data normalization issues across sites, vendors, and protocol generations, pushing deployment timelines from weeks to several months. In utilities and large industrial facilities, this problem is more difficult because different generations of control systems often operate side by side, and each one can produce data in a different format. Honeywell's February 2026 partnership with TCS in India was aimed directly at this problem by combining OT connectivity, cloud modernization, and AI-led operations support. In the India AI-powered Energy Management Software Market, integration capability has therefore become a core product differentiator rather than an implementation detail.
Other drivers and restraints analyzed in the detailed report include:
- Net-Zero Commitments Push Continuous Energy Optimization Programs
- Expansion of Distributed Energy Resources Raises Need for AI Orchestration
- Cybersecurity and Data Sovereignty Concerns Limit Cloud Adoption in Critical Sites
For complete list of drivers and restraints, kindly check the Table Of Contents.
Segment Analysis
Software accounted for 66.21% of India AI-powered Energy Management Software Market in 2025, keeping the category centered on platform-led buying patterns rather than isolated tools. Buyers have favored software because it enables demand forecasting, asset diagnostics, and renewable integration to be housed in a single operating layer rather than separate applications. This matters because utilities and large industrial groups typically want a single system of record for energy performance across multiple sites. The recurring-revenue nature of software contracts also fits the preference for long-term platform control in regulated and energy-intensive sectors.
Services are projected to expand at a 25.47% CAGR through 2031, indicating that implementation work is becoming increasingly important as deployments move into more complex operating environments. Companies that have already purchased software increasingly need managed analytics, integration support, and site-level model tuning before operational value becomes visible. The Honeywell and TCS partnership reflected that shift by treating convergence between legacy OT and newer cloud analytics as an ongoing service task rather than a one-time setup. BEE's ECBC-linked metering and management requirements also create a baseline that vendors can build on through software upgrades and associated services.
Cloud-based deployment accounted for 56.17% of India AI-powered Energy Management Software Market in 2025, supported by lower upfront costs and easier access to analytics-intensive computing. Commercial building operators and mid-sized industrial users have leaned toward the cloud because it shortens deployment time and avoids heavy local infrastructure investment. For the market, that has helped cloud become the default option in less sensitive operating environments where speed and cost carry more weight than strict data control. The growing presence of hyperscale cloud infrastructure in India has also made cloud-based delivery more practical for software vendors that rely on real-time analytics.
Hybrid deployment is expected to grow at a 25.58% CAGR through 2031 because it addresses the tension between cloud efficiency and local control. In regulated power and utility settings, buyers often want sensitive OT data to remain on-site while less critical analytics workloads move to the cloud. That is why architecture flexibility is becoming a procurement requirement, especially for discoms, generators, and transmission-linked users. ABB's 2026 launch of BuildingPro Suites, which supports edge, on-premises, and cloud deployment, reflected this hybrid-first direction.
Complete Report Scope:
- By Component
- Software
- Services
- By Deployment Mode
- Cloud-Based
- On-Premises
- Hybrid
- By Application
- Energy Consumption and Demand Optimization
- Asset Performance and Predictive Maintenance
- Smart Grid and Distributed Energy Resource (DER) Management
- Renewable Energy Forecasting and Integration
- Energy Trading, Pricing and Market Intelligence
- By End User
- Utilities
- Commercial Buildings
- Industrial Facilities
- Residential Buildings
List of Companies Covered in this Report:
- Schneider Electric SE
- Siemens AG
- Johnson Controls International plc
- Honeywell International Inc.
- ABB Ltd
- Eaton Corporation plc
- Emerson Electric Co.
- IBM Corporation
- Microsoft Corporation
- Oracle Corporation
- SAP SE
- C3.AI, Inc.
- BrainBox AI Inc.
- GridPoint, Inc.
- Verdigris Technologies, Inc.
- Uplight, Inc.
- AutoGrid Systems, Inc.
- EnergyCAP, LLC
- Amp X Ltd.
- GNA Energy
- Greenovative Energy
- Tata Power
- AutoGrid Systems, Inc.
- EnerCog
Additional Benefits:
- The market estimate (ME) sheet in Excel format
- 3 months of analyst support
TABLE OF CONTENTS
1 INTRODUCTION
- 1.1 Study Assumptions and Market Definition
- 1.2 Scope of the Study
2 RESEARCH METHODOLOGY
3 EXECUTIVE SUMMARY
4 MARKET LANDSCAPE
- 4.1 Market Overview
- 4.2 Market Drivers
- 4.2.1 Rising Energy Tariffs and Peak-Demand Charges Across Commercial Facilities
- 4.2.2 Smart Meter Rollout Expands High-Frequency Energy Data Availability
- 4.2.3 Net-Zero Commitments Push Continuous Energy Optimization Programs
- 4.2.4 Expansion of Distributed Energy Resources Raises Need For AI Orchestration
- 4.2.5 Retrofit-Heavy Building Stock Creates Large Software-First Efficiency Opportunity
- 4.2.6 Demand For Remote Monitoring In Multi-Site Enterprises Accelerates Adoption
- 4.3 Market Restraints
- 4.3.1 Fragmented Legacy OT and BMS Data Slows Model Deployment
- 4.3.2 Cybersecurity and Data Sovereignty Concerns Limit Cloud Adoption in Critical Sites
- 4.3.3 Weak Internal AI and Energy Analytics Skills Reduce Implementation Velocity
- 4.3.4 Long Sales Cycles and Low-Capex Prioritization Delay Enterprise Purchases
- 4.4 Impact of Macroeconomic Factors on the Market
- 4.5 Industry Value-Chain Analysis
- 4.6 Regulatory Landscape
- 4.7 Technological Outlook
- 4.8 Porter's Five Forces Analysis
- 4.8.1 Bargaining Power of Buyers
- 4.8.2 Bargaining Power of Suppliers
- 4.8.3 Threat of New Entrants
- 4.8.4 Threat of Substitutes
- 4.8.5 Intensity of Competitive Rivalry
5 MARKET SIZE AND GROWTH FORECASTS (VALUE)
- 5.1 By Component
- 5.1.1 Software
- 5.1.2 Services
- 5.2 By Deployment Mode
- 5.2.1 Cloud-Based
- 5.2.2 On-Premises
- 5.2.3 Hybrid
- 5.3 By Application
- 5.3.1 Energy Consumption and Demand Optimization
- 5.3.2 Asset Performance and Predictive Maintenance
- 5.3.3 Smart Grid and Distributed Energy Resource (DER) Management
- 5.3.4 Renewable Energy Forecasting and Integration
- 5.3.5 Energy Trading, Pricing and Market Intelligence
- 5.4 By End User
- 5.4.1 Utilities
- 5.4.2 Commercial Buildings
- 5.4.3 Industrial Facilities
- 5.4.4 Residential Buildings
6 COMPETITIVE LANDSCAPE
- 6.1 Market Concentration
- 6.2 Strategic Moves
- 6.3 Market Share Analysis
- 6.4 Company Profiles (includes Global Level Overview, Market Level Overview, Core Segments, Financials as available, Strategic Information, Market Rank/Share, Products and Services, Recent Developments)
- 6.4.1 Schneider Electric SE
- 6.4.2 Siemens AG
- 6.4.3 Johnson Controls International plc
- 6.4.4 Honeywell International Inc.
- 6.4.5 ABB Ltd
- 6.4.6 Eaton Corporation plc
- 6.4.7 Emerson Electric Co.
- 6.4.8 IBM Corporation
- 6.4.9 Microsoft Corporation
- 6.4.10 Oracle Corporation
- 6.4.11 SAP SE
- 6.4.12 C3.ai, Inc.
- 6.4.13 BrainBox AI Inc.
- 6.4.14 GridPoint, Inc.
- 6.4.15 Verdigris Technologies, Inc.
- 6.4.16 Uplight, Inc.
- 6.4.17 AutoGrid Systems, Inc.
- 6.4.18 EnergyCAP, LLC
- 6.4.19 Amp X Ltd.
- 6.4.20 GNA Energy
- 6.4.21 Greenovative Energy
- 6.4.22 Tata Power
- 6.4.23 AutoGrid Systems, Inc.
- 6.4.24 EnerCog
7 MARKET OPPORTUNITIES AND FUTURE OUTLOOK
- 7.1 White-Space and Unmet-Need Assessment

 2034年人工智慧市場在發電領域的預測-按組件、部署模式、人工智慧技術、電源、應用、企業規模、最終用戶和地區分類的全球分析
 人工智慧在能源市場的應用:市場規模、佔有率、成長、全球產業分析、區域趨勢及2026-2034年預測電力產業人工智慧市場規模、佔有率、成長、全球產業分析、區域趨勢以及2026-2034年的預測
 全球能源電力領域人工智慧(AI)市場:機會與策略展望(至2035年)
 中國人工智慧能源管理軟體:市場佔有率分析、產業趨勢與統計及成長預測(2026-2031)中東和非洲人工智慧能源管理軟體:市場佔有率分析、行業趨勢和統計數據以及成長預測(2026-2031 年)中東地區人工智慧能源管理軟體:市場佔有率分析、行業趨勢和統計數據以及成長預測(2026-2031 年)南美洲人工智慧能源管理軟體:市場佔有率分析、行業趨勢和統計數據以及成長預測(2026-2031 年)德國人工智慧能源管理軟體:市場佔有率分析、行業趨勢和統計數據以及成長預測(2026-2031 年)新加坡人工智慧能源管理軟體:市場佔有率分析、行業趨勢和統計數據以及成長預測(2026-2031 年)