


 |
市場調查報告書
商品編碼
2063906
德國有機廢棄物收集服務:市場佔有率分析、產業趨勢與統計及成長預測(2026-2031 年)Germany Organic Waste Collection Services - Market Share Analysis, Industry Trends & Statistics, Growth Forecasts (2026 - 2031) |
||||||
※ 本網頁內容可能與最新版本有所差異。詳細情況請與我們聯繫。
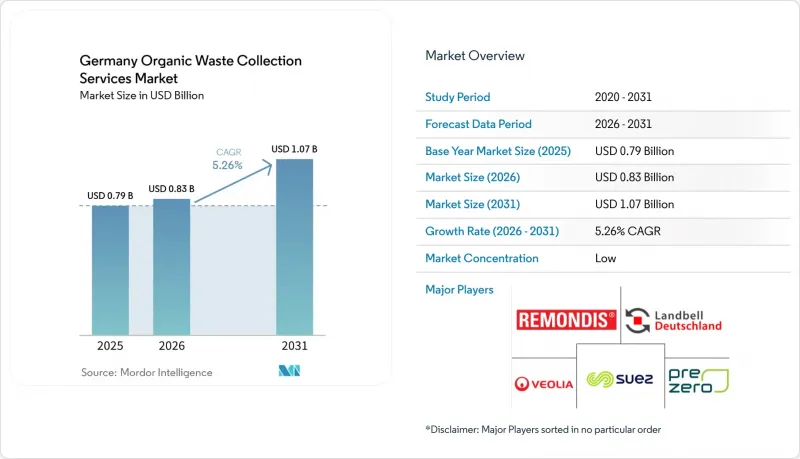
根據 Mordor Intelligence 預測,德國有機廢棄物收集服務市場規模預計將在 2025 年達到 7.9 億美元,2026 年達到 8.3 億美元,到 2031 年達到 10.7 億美元,2026 年至 2031 年的複合年成長率為 5.26%。
本報告按廢棄物類型(食物廢棄物、園林綠化廢棄物等)、最終用戶(住宅、商業設施等)、收集方式(路邊收集、投放點等)以及技術/設備(人工收集系統、半自動系統等)進行分類。市場預測以價值(美元)和數量(噸)表示。
德國有機廢棄物收集服務市場的趨勢與洞察
《廢棄物條例》(BioAbfV)對投入材料製定了更嚴格的品質標準。
2025年5月對德國廢棄物條例的修訂確立了具有約束力的污染閾值,並賦予處理業者明確的權力,可以拒絕接收不符合標準的包裝。這使得品質風險轉移到了上游收集運營商。因此,營運商被迫實施光學分揀、包裝去除和容器篩檢系統,以維持接收標準並避免代價高昂的再次進入殘餘物處理流程。試驗審查表明,收集時純度降低會導致成品堆肥中微塑膠污染增加。這不僅會危及堆肥的土壤施用核准,還會產生再加工成本,並透過拒收包裝和罰款直接對收集路線的盈利產生負面影響。各市政當局的應對措施各不相同,一些地區禁止在棕色垃圾桶中使用生物分解性塑膠,而另一些地區則在拒絕收集前引入垃圾桶檢查和分級處罰,導致全部區域的合規成本存在差異。早期投資於包裝去除系統的運營商通過滿足更嚴格的處理運營商接收標準並避免包裝被拒收,獲得了競爭優勢。因此,市場正逐漸將品質保證作為關鍵績效促進因素,可追溯性、檢驗和技術整合對利潤率的影響遠大於加工量。由於一些市政當局加強檢驗的速度快於其他地區,監管執行上的差異將持續存在,從而加劇區域成本差距,並影響短期競標策略。
廢棄物管理工作小組(KrWG)提倡回收利用而非丟棄。
德國的循環經濟法建立了一個五級體系,優先考慮預防和回收利用,而非能源回收和掩埋處理,並強制要求對有機廢棄物進行分類收集。這持續促使各市擴大棕色垃圾桶的使用範圍,並改善源頭分類。 2024年通過的國家循環經濟戰略進一步強化了這個方向,設定了2030年將人均城市廢棄物減少10%的目標。最新統計顯示,2024年德國家庭有機廢棄物達到1,070萬噸,比2023年增加5.9%,證實了按以重量為準對有機廢棄物進行分類的快速成長。如果地方政府不進行垃圾分類,排放交易機制將增加其成本。這是因為焚燒剩餘廢棄物可能需要排放排放權,而且如果未能有效對有機物進行分類,也會增加收整合本。包裝改革也間接地起到了支持作用。隨著人們對回收的期望不斷提高,在家中正確分類垃圾變得愈發重要,而有效的信息傳播可以減少有機垃圾容器中混入的異物數量。此外,地方政府的年度報告透過公佈分類率、鼓勵投資購買收集容器、在效果顯著的地區開展居民教育和增加收集路線密度,持續向分類滯後的市政當局施壓。由於對收集容器和車輛的投資是長期性的,分類和純度方面的容量和規模效應會逐漸顯現,市場也會因這項政策在數年內的持續實施而受益。
收集的有機廢棄物流中的污染
塑膠污染仍然是廢棄物處理商面臨的最大品質限制,檢查結果仍顯示不合格率居高不下。這凸顯了加強執法和改善源頭分類的必要性。該條例將家庭廚餘垃圾中允許的塑膠含量降低排放1%。這賦予了處理設施拒絕接收異物含量超過3%的包裝的權力,從而將經濟風險轉移到企業身上,這些企業要么需要進行額外的預處理,要么需要承擔重新運輸的成本。地方政府正在透過分階段檢查和從警告到暫停收集等一系列處罰措施來加強執法力度,這表明明顯的阻礙力能夠提高合規性。其他地區則透過暫停收集受污染容器並對後續處置徵收殘餘廢棄物處理費,將責任轉移到家庭和企業身上,但這可能會引起繳費者的不滿。去除異物通常會導致有機物產品的大量損失,降低處理商的附加價值,並將重點從設施內的補救措施轉移到收集前的預防。即使可生物分解包裝材料的法規正在逐步訂定,也必須繼續從系統中的有機容器中清除合格的材料,以確保下游品質認證和農業部門的認可。
細分市場分析
到2025年,園林綠化廢棄物將佔市場佔有率的48.2%,但預計到2031年,生產前和消費後的食物廢棄物將以7.41%的複合年成長率成長,超過整體市場擴張速度,顯示收集的廢棄物成分正在逐步轉變。市場受益於更清晰的法規和更嚴格的包裝食品廢棄物監管,這增加了流入預消化包裝去除生產線的商業廢棄物量。投資這些設施的營運商也經歷了廢棄物拒收率降低和工廠接收率提高。近期數據顯示,家庭有機廢棄物增加,但與食物廢棄物相比,園林廢棄物的季節性限制了其進一步成長。廢棄物,廢棄物保持穩定的處理特性,品管部門正在加強污染監測,以保護對市場穩定至關重要的土壤供應來源。隨著消化器業者基材的要求越來越高,能量密度也越來越高,商業食品廢棄物正成為更具吸引力的目標,前提是包裝去除性能能夠將污染控制在規定的水平以下。
在每個市政區域,政策持續影響廢棄物的組成,例如使用棕色垃圾桶、進行宣傳活動以及調整垃圾收集頻率,從而支持對食物廢棄物和園林廢棄物進行清潔收集。農業殘餘物雖然佔比不大,但成長迅速,這主要得益於城市農業計畫的商業性收集、郊區農場參與市政有機計畫以及與機構進行的堆肥夥伴關係。農村地區產生的大規模農業廢棄物通常不在市政競標系統的範圍內,而是在農場的沼氣池中進行處理後直接施用於土地。隨著循環經濟框架推動將各種有機原料整合到當地的沼氣和堆肥基礎設施中,預計市政及周邊農業廢棄物的收集量將會擴大。由於沼氣廠的收入模式側重於食物垃圾的甲烷產量,且生物甲烷注入能力不斷提升,確保了來自符合嚴格污染標準的商業客戶的穩定廢棄物供應,因此食物廢棄物的成長速度預計將繼續超過園林廢棄物。這項變更也有助於保護堆肥質量,它將污染風險最高、塑膠含量最高的原料在拆包後引導至標準的預處理消化流程。這既限制了堆肥材料中的塑膠污染,也保證了下游農場的接受度。因此,市場正在調整廢棄物類型構成,以匹配能源和土壤等終端市場的需求,並透過品管將物料分配到能夠創造最大價值的領域。
到2025年,住宅用戶佔總活動的73.1%。這得歸功於廣泛的廚餘垃圾收集計劃以及強制參與地區普遍較高的用戶接入率。預計成長最快的領域是商業餐飲服務業,到2031年複合年成長率將達到7.92%。這主要得益於更嚴格的分類要求、更完善的合規性監控以及將以往靈活的安排正式化的永續發展目標。隨著食物廢棄物要求和運輸追蹤從“指南”轉變為“強制性規定”,來自餐廳、酒店、超級市場和現場廚房的合約數量正在增加。工業食品加工企業提供成分相對穩定的穩定廢棄物來源,對厭氧消化池業者來說極具價值。對於服務這些設施的垃圾收集商而言,長期接收合約有助於降低收入波動。農業和其他小規模類別在市政系統中仍然佔比很小,商業餐飲服務業仍然是收入波動的主要促進因素,並推動了住宅以外的收入來源多元化。
隨著市政當局逐步試行以技術驅動的容器檢查和收集管理,並可能將服務範圍擴展至商業場所,嚴格的執法仍然是推動商業領域成長的主要動力。這促使越來越多的客戶在明確的品質條件下選擇合約服務。與分散的居民設施相比,商業設施能夠更快地適應確保消化器運轉率和堆肥品質認證的分類規則,從而提高處理廠的驗收可靠性。透過基於可審計協議吸引商業客戶,市場受益於可預測的垃圾量、更嚴格的污染控制、更經濟的收集路線以及與處理商更穩定的合作關係。雖然住宅垃圾量仍然是市場的基礎,但成長的重點正在轉向商業領域,因為相關政策和技術降低了違規風險並提高了收集效率。從長遠來看,市政和商業垃圾的結合將使企業能夠緩解花園廢棄物的季節性波動,並依靠全年穩定的食物廢棄物來確保消化器的運作。
其他好處:
- Excel格式的市場預測(ME)表
- 3個月的分析師支持
目錄
第1章:引言
- 研究假設和市場定義
- 調查範圍
第2章:調查方法
第3章執行摘要
第4章 市場狀況
- 市場概覽
- 市場促進因素
- 《廢棄物條例》(BioAbfV)對投入材料製定了更嚴格的品質標準。
- 《循環經濟法》(KrWG)提倡回收利用而非浪費。
- 地方政府正在擴大用於投放廚餘垃圾的「棕色垃圾桶」的基礎設施。
- 將沼氣和堆肥納入德國可再生能源結構
- 地方政府在廢棄物收集中發揮重要作用
- 家庭廢棄物分類參與率高
- 市場限制因素
- 收集的有機廢棄物中的污染物
- 高昂的收款和物流成本
- 農村地區經濟永續性的局限性
- 地方政府間徵收方式的標準化程度不足。
- 價值供應鏈分析
- 監理情勢
- 技術展望
- 將厭氧消化與德國的沼氣基礎設施結合
- 用於生產高品質農業堆肥的封閉式堆肥系統
- 光學分選和去除異物
- 智慧垃圾桶標籤和計量收費(PAYT)系統
- 波特五力模型
- 付費廢棄物系統對市場的影響
- 關於零廢棄市政系統過渡的思考
第5章 市場規模及成長預測(價值:美元,數量:噸)
- 廢棄物類型
- 食物廢棄物(生產和消耗階段)
- 園林綠化廢棄物
- 農業殘餘物
- 其他
- 最終用戶
- 住宅
- 商業用途(旅館餐飲業、零售業)
- 工業(食品加工和製造)
- 其他(農業廢棄物)
- 透過收集方法
- 上門收集
- 投放和回收系統
- 其他
- 按下技術/設備
- 人工收集系統
- 半自動系統
- 全自動系統
- 其他
第6章 競爭情勢
- 市場集中度
- 策略趨勢
- 市佔率分析
- 公司簡介
- REMONDIS SE & Co.
- PreZero Stiftung & Co. KG
- Veolia Environnement SA
- Landbell Group GmbH
- SUEZ Group
- ALBA Group
- Interzero Holding
- Nehlsen AG
- Bartscherer & Co. Recycling GmbH
- AVEA GmbH & Co. KG
- Ihlenberger Abfallentsorgungsgesellschaft mbH(IAG)
- Schneemann Recycling GmbH
- Berliner Stadtreinigungsbetriebe AoR
- SARIA SE & Co. KG
- Zentek GmbH & Co. KG
- Geocycle GmbH
- FCC Environment GmbH
- Urbaser SAU
- Stena Recycling GmbH
- KS-Recycling GmbH & Co. KG
第7章 市場機會與未來展望
According to Mordor Intelligence, the germany organic waste collection services market size is projected to be USD 0.79 billion in 2025, USD 0.83 billion in 2026, and reach USD 1.07 billion by 2031, growing at a CAGR of 5.26% from 2026 to 2031.
This report is Segmented by Waste Type (Food Waste, Yard & Landscape Waste, and More), by End-User (Residential, Commercial, and More), by Collection Method (Door-To-Door Collection, Drop-Off / Bring Systems, and Others), and by Technology & Equipment (Manual Collection Systems, Semi-Automated Systems, and More). The Market Forecasts are Provided in Terms of Value (USD) and Volume (Tons).
Germany Organic Waste Collection Services Market Trends and Insights
Biowaste Ordinance (BioAbfV) Tightening Quality of Input Streams
The May 2025 amendment to Germany's Biowaste Ordinance established binding contamination thresholds and gave processors explicit authority to reject non-compliant loads, transferring quality risk upstream to collection operators. This forces operators to deploy optical sorting, depackaging, and bin-screening systems to preserve gate acceptance and avoid costly re-routing to residual streams. Pilot audits show that microplastic contamination in finished compost rises when collection purity slips. This jeopardizes soil-application approvals and triggers rework costs, directly harming collection route profitability through rejected loads and penalty fees. Municipal responses vary by district, with some authorities banning biodegradable plastic bags in brown bins and others implementing bin inspections and staged penalties before non-collection, creating uneven compliance costs across service footprints. Operators that invested early in depackaging systems gained a competitive advantage by meeting stricter processor acceptance standards and avoiding load rejections. The market is therefore moving toward quality assurance as a central performance lever where traceability, inspection, and technology integration decide margins more than tonnage growth. Enforcement heterogeneity will persist as some municipalities tighten inspections faster than others, sustaining regional cost differentials that shape near-term bidding strategies.
Circular Economy Act (KrWG) Driving Recycling Over Disposal
Germany's Circular Economy Act establishes a five-tier hierarchy that prioritizes prevention and recycling over energy recovery and landfill, and mandates separate collection of organic waste, which continues to push municipalities to expand brown-bin access and improve source separation. The National Circular Economy Strategy, adopted in 2024, reinforced this direction by targeting a 10% per-capita reduction in municipal waste by 2030. Recent balances show household organic waste rose to 10.7 million tonnes in 2024, up 5.9% from 2023, confirming organic separation as a fast-growing municipal fraction by weight. Emissions trading increases the cost of non-segregation for local authorities because residual-waste incineration can require certificates, adding cost to routes that lack effective diversion of organics. Packaging reform is indirectly supportive because higher recycling expectations increase the salience of correct sorting at home, which can reduce foreign-material inflows into organic bins when communication is effective. Annual municipal reporting also keeps pressure on laggards by publicizing separation rates, nudging investment into container fleets, and promoting public education and route density where returns are visible. The market benefits from this policy alignment over a multi-year horizon because long-lived container and fleet investments lock in capability and scale effects around separation and purity.
Contamination in Collected Organic Waste Streams
Plastic contamination remains the primary quality constraint for processors, and controls continue to exhibit notable rejection rates, underscoring the need for strict enforcement and improved sorting at source. The ordinance reduced acceptable plastic levels in household biowaste to 1%. It empowered plants to reject loads with more than 3% foreign material, shifting financial risk to operators who must either add pre-treatment or absorb re-routing costs. Jurisdictions have increased enforcement with inspections and penalties that escalate from warnings to non-collection, showing that visible deterrents can improve compliance. Other districts rely on non-collection for contaminated bins and charge residual-waste fees for subsequent disposal, shifting responsibility to households and businesses but potentially raising friction with ratepayers. Removing foreign material often results in a meaningful share of the organic fraction being lost as collateral, worsening value capture for processors and emphasizing curb-side prevention over plant-based remediation. As compostable packaging rules phase in over time, systems must still keep non-accepted materials out of organic bins to protect downstream quality certifications and agricultural acceptance.
Other drivers and restraints analyzed in the detailed report include:
- Municipalities Expand "Brown Bin" Infrastructure for Biowaste
- Biogas & Compost Integration into Germany's Renewable Energy Mix
- High Collection & Logistics Costs
For complete list of drivers and restraints, kindly check the Table Of Contents.
Segment Analysis
Yard and landscape waste held 48.2% of the market share in 2025, while pre- and post-consumer food waste is projected to grow at a 7.41% CAGR through 2031, outpacing the overall expansion rate and signaling a gradual shift in the composition of collected waste. The market benefits from clearer rules and enforcement around packaged food waste that push more commercial volumes into depackaging lines before digestion, and operators that invest in such capabilities experience fewer rejections and more stable plant acceptance. Household organics have grown in recent balances, but yard-waste seasonality constrains further volume gains relative to food waste. Composters continue to blend green waste with biowaste to maintain stable processing characteristics, and quality controls increasingly police contamination to protect soil outlets that remain essential for market stability. As digester operators demand more consistent, high-energy-density substrates, commercial food waste becomes a more attractive target, provided depackaging performance holds contamination below mandated control values.
Across municipalities, policy still influences composition through brown-bin access, communications, and frequency schedules that support clean capture of both food and yard streams. Agricultural residues represent a smaller but growing segment, driven by commercial collection from urban agriculture projects, peri-urban farms participating in municipal organics programs, and institutional composting partnerships. Large-scale agricultural waste from rural operations typically remains outside municipal tender systems, is processed through on-farm digesters, and is then directly land-applied. The municipal-adjacent agricultural collection is forecast to expand as circular-economy frameworks incentivize the integration of diverse organic feedstocks into regional biogas and composting infrastructure. Food waste will likely continue to outpace yard waste because revenue models at biogas plants favor its methane yield, and expanding biomethane injection capacity pulls in consistent feedstock from commercial accounts that meet strict contamination rules. This shift can also help protect compost quality by steering the most contamination-prone, plastic-laden inputs into pre-treated digestion routes where depackaging is standard, limiting plastic carryover into composted material and maintaining downstream farm acceptance. The market, therefore, aligns its waste-type mix with energy and soil end-markets, using quality controls to allocate volumes where they generate the best value.
Residential end-users accounted for 73.1% of 2025 activity, supported by widespread brown-bin programs and generally high connection rates where participation is mandatory. The fastest growth is in the commercial food service segment, projected at a 7.92% CAGR through 2031, driven by tighter separation requirements, stronger compliance oversight, and sustainability targets that formalize previously ad hoc arrangements. The market is seeing more contracts from restaurants, hotels, supermarkets, and institutional kitchens as handling requirements for food waste and transport tracking shift from guidance to enforcement. Industrial food processors contribute steady volumes with relatively reliable composition that digester operators value, and longer-term acceptance arrangements can reduce revenue volatility for collectors who serve these sites. Agricultural and other small categories remain marginal in municipal systems, keeping the commercial food-service vector as the main swing factor, diversifying revenue beyond residential accounts.
Enforcement rigor remains the driver of commercial growth as municipalities pilot technology-enabled bin inspections and collection controls that can extend to business premises, prompting more customers to adopt contracted service under clear quality terms. This approach supports more reliable plant acceptance because commercial sources can adapt faster than dispersed households to separation rules that protect digester uptime and compost quality certifications. The market benefits from predictable volume and stronger contamination control when commercial accounts are onboarded under auditable protocols, improving route economics and stabilizing processor relationships. Residential volumes remain the anchor, but marginal growth shifts to commercial streams where policy and technology reduce non-compliance risk and improve collection efficiency. Over time, mixed municipal-commercial portfolios help operators smooth yard-waste seasonality and rely more on year-round food waste that supports steadier digester operations.
List of Companies Covered in this Report:
- REMONDIS SE & Co.
- PreZero Stiftung & Co. KG
- Veolia Environnement S.A.
- Landbell Group GmbH
- SUEZ Group
- ALBA Group
- Interzero Holding
- Nehlsen AG
- Bartscherer & Co. Recycling GmbH
- AVEA GmbH & Co. KG
- Ihlenberger Abfallentsorgungsgesellschaft mbH (IAG)
- Schneemann Recycling GmbH
- Berliner Stadtreinigungsbetriebe AoR
- SARIA SE & Co. KG
- Zentek GmbH & Co. KG
- Geocycle GmbH
- FCC Environment GmbH
- Urbaser S.A.U.
- Stena Recycling GmbH
- KS-Recycling GmbH & Co. KG
Additional Benefits:
- The market estimate (ME) sheet in Excel format
- 3 months of analyst support
TABLE OF CONTENTS
1 Introduction
- 1.1 Study Assumptions & Market Definition
- 1.2 Scope of the Study
2 Research Methodology
3 Executive Summary
4 Market Landscape
- 4.1 Market Overview
- 4.2 Market Drivers
- 4.2.1 Biowaste Ordinance (BioAbfV) Tightening Quality of Input Streams
- 4.2.2 Circular Economy Act (KrWG) Driving Recycling Over Disposal
- 4.2.3 Municipalities Expand "Brown Bin" Infrastructure for Biowaste
- 4.2.4 Biogas & Compost Integration into Germany's Renewable Energy Mix
- 4.2.5 Strong Municipal Role in Waste Collection
- 4.2.6 High Household Participation in Waste Segregation
- 4.3 Market Restraints
- 4.3.1 Contamination in Collected Organic Waste Streams
- 4.3.2 High Collection & Logistics Costs
- 4.3.3 Limited Economic Viability in Rural Regions
- 4.3.4 Limited Standardization of Collection Practices Across Municipalities
- 4.4 Value / Supply-Chain Analysis
- 4.5 Regulatory Landscape
- 4.6 Technological Outlook
- 4.6.1 Anaerobic Digestion Integrated with Germany's Biogas Infrastructure
- 4.6.2 In-vessel Composting for High-Quality Agricultural Compost
- 4.6.3 Optical Sorting & Contaminant Removal
- 4.6.4 Smart Bin Tagging & Pay-As-You-Throw (PAYT) Systems
- 4.7 Porter's Five Forces
- 4.7.1 Threat of New Entrants
- 4.7.2 Bargaining Power of Suppliers
- 4.7.3 Bargaining Power of Buyers
- 4.7.4 Threat of Substitutes
- 4.7.5 Industry Rivalry
- 4.8 Impact of Fee-Based Waste Systems on the Market
- 4.9 Insights on Shift Toward Zero-Waste Municipal Systems
5 Market Size & Growth Forecasts (Value in USD & Volume in Tons)
- 5.1 By Waste Type
- 5.1.1 Food Waste (Pre and Post Consumer)
- 5.1.2 Yard & Landscape Waste
- 5.1.3 Agricultural Residues
- 5.1.4 Others
- 5.2 By End-User
- 5.2.1 Residential
- 5.2.2 Commercial (HoReCa, Retail)
- 5.2.3 Industrial (Food Processing & Manufacturing)
- 5.2.4 Others (Agri-waste)
- 5.3 By Collection Method
- 5.3.1 Door-to-Door Collection
- 5.3.2 Drop-Off / Bring Systems
- 5.3.3 Others
- 5.4 By Technology & Equipment
- 5.4.1 Manual Collection Systems
- 5.4.2 Semi-Automated Systems
- 5.4.3 Fully Automated Systems
- 5.4.4 Others
6 Competitive Landscape
- 6.1 Market Concentration
- 6.2 Strategic Moves
- 6.3 Market Share Analysis
- 6.4 Company Profiles {(Includes Global Level Overview, Market Level Overview, Core Segments, Financials as Available, Strategic Information, Products & Services, and Recent Developments)}
- 6.4.1 REMONDIS SE & Co.
- 6.4.2 PreZero Stiftung & Co. KG
- 6.4.3 Veolia Environnement S.A.
- 6.4.4 Landbell Group GmbH
- 6.4.5 SUEZ Group
- 6.4.6 ALBA Group
- 6.4.7 Interzero Holding
- 6.4.8 Nehlsen AG
- 6.4.9 Bartscherer & Co. Recycling GmbH
- 6.4.10 AVEA GmbH & Co. KG
- 6.4.11 Ihlenberger Abfallentsorgungsgesellschaft mbH (IAG)
- 6.4.12 Schneemann Recycling GmbH
- 6.4.13 Berliner Stadtreinigungsbetriebe AoR
- 6.4.14 SARIA SE & Co. KG
- 6.4.15 Zentek GmbH & Co. KG
- 6.4.16 Geocycle GmbH
- 6.4.17 FCC Environment GmbH
- 6.4.18 Urbaser S.A.U.
- 6.4.19 Stena Recycling GmbH
- 6.4.20 KS-Recycling GmbH & Co. KG
7 Market Opportunities & Future Outlook
- 7.1 Smart Cities & IoT Integration
- 7.2 Producer Responsibility Expansion
- 7.3 Shift Toward Decentralized Organic Waste Processing
 北美有機廢棄物收集服務:市場佔有率分析、行業趨勢和統計數據以及成長預測(2026-2031 年)歐洲有機廢棄物收集服務:市場佔有率分析、行業趨勢和統計數據以及成長預測(2026-2031 年)
 升級再造食品配料市場:預測至2034年-按配料類型、功能、分銷管道、應用、最終用戶和地區分類的全球分析
 食品廢棄物管理市場:2026-2032年全球市場預測(依處理技術、來源、服務模式、產品/服務、廢棄物類型和應用分類)
 2026-2030年全球食品廢棄物管理市場美國有機廢棄物收集服務:市場佔有率分析、行業趨勢和統計數據以及成長預測(2026-2031 年)義大利有機廢棄物收集服務:市場佔有率分析、行業趨勢和統計數據以及成長預測(2026-2031 年)日本有機廢棄物收集服務:市場佔有率分析、產業趨勢與統計及成長預測(2026-2031)有機廢棄物收集:市場佔有率分析、產業趨勢與統計、成長預測(2026-2031)
 2026年全球食品回收市場報告