


 |
市場調查報告書
商品編碼
2099827
北美有機廢棄物收集服務:市場佔有率分析、行業趨勢和統計數據以及成長預測(2026-2031 年)North America Organic Waste Collection Services - Market Share Analysis, Industry Trends & Statistics, Growth Forecasts (2026 - 2031) |
||||||

※ 本網頁內容可能與最新版本有所差異。詳細情況請與我們聯繫。
據 Mordor Intelligence 稱,2025 年北美有機廢棄物收集服務市值為 26.6 億美元,預計到 2031 年將從 2026 年的 28 億美元成長至 36.2 億美元,預測期(2026-2031 年)的複合年成長率為 5.25%。
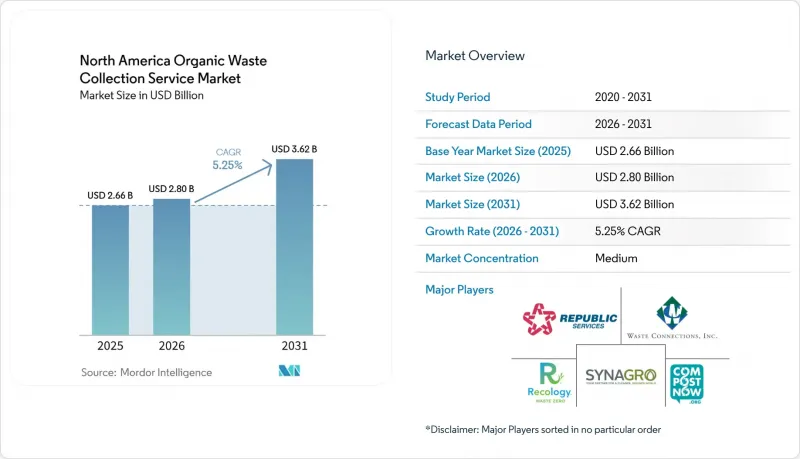
本報告按廢棄物類型(食物廢棄物、園林綠化廢棄物等)、最終用戶(住宅等)、收集方式(路邊收集等)、技術和設備(人工收集系統等)以及地區(美國、加拿大、墨西哥)進行細分。報告提供了上述所有細分市場的市場規模和預測(以美元計)。
北美有機廢棄物收集服務市場趨勢與洞察
低碳燃料標準 (LCFS) 積分用於支持有機垃圾焚化發電項目
加州、奧勒岡州和華盛頓州的州級低碳燃料標準 (LCFS) 計畫正在推動北美有機廢棄物收集服務市場的成長。這些項目將財政獎勵與可再生天然氣 (RNG) 以及利用有機廢棄物發電的項目掛鉤。透過 LCFS 積分計劃,廢棄物管理公司可以將食物、農業和都市區有機廢棄物轉化為沼氣和低碳運輸燃料,從而獲得額外收入。加州憑藉其 LCFS 框架和強制執行有機廢棄物回收的參議院第 1383 號法案,在該領域處於領先地位。這些措施激勵市政當局和私人企業加強食物廢棄物收集和厭氧消化基礎設施建設。同時,奧勒岡州和華盛頓州也在實施類似的無污染燃料政策,促進對有機廢棄物收集和可再生能源生產的投資。隨著 LCFS 積分的貨幣價值不斷提升,收集和處理有機廢棄物的公司的財務永續性也在增強。這一有利趨勢正在加速基於源頭分類的有機廢棄物收集項目的實施,預計將在未來兩年內推動美國西部地區的短期市場成長。
聯邦和州政府為利用有機廢棄物生產可再生天然氣 (RNG) 提供獎勵
第 45Z 條規定,低碳運輸燃料的生產可享有稅額扣抵,直至 2029 年。該條款採用 GREET(溫室氣體、受管制排放和交通能源使用)模型,其中包括有機廢棄物消化途徑,從而增強了與酪農、廢水處理和垃圾掩埋沼氣相關的項目的經濟可行性。財政部於 2026 年 2 月發布的指導意見明確指出,基於牲畜糞便的途徑產生的排放量可能為負值,這將增加牲畜消化設施的稅額扣抵抵免,並加快新建設項目的融資審查。省級政府的支持,例如加拿大亞伯達向 Taurus Canada RNG 提供的 TIER津貼,也體現了類似的政策一致性,降低了擁有明確銷售管道的大規模牲畜糞便 RNG 項目的資金籌措風險。私人開發商正朝著商業營運的方向邁進,Clean Energy Fuels 公司正在對其位於德克薩斯州的大型酪農RNG 設施進行運作,並根據可再生燃料標準 (RFS) 獲得了完整的 RIN(可再生識別碼)合格。基於 ISO 框架和 RFS(可再生燃料標準)第 80 部分的檢驗有助於維護碳權額度產生的完整性。同時,加州計劃從 2029 年起逐步取消甲烷減排碳權額度,這為加快開發和採購週期創造了契機。
人口稀少的郊區和農村地區的收集和處理成本很高。
自2022年以來,部分地區的處理費和處置成本大幅上漲,這加大了價格上漲的壓力,並在不調整收入的情況下限制了服務的擴展。加州法律和零排放車輛法規增加了成本並縮短了資金周轉週期,使得人口稀少、缺乏人口密度優勢的路線更難承擔這些負擔。雖然數據工具可以用於減少不必要的停靠,降低都市區路線的燃油和人事費用,但由於距離和參與率的差異,在農村地區實施感測器和路線最佳化所帶來的節省較少。聯邦津貼有助於推出項目,但有限的資金競爭往往更有利於規模更大、更具擴充性的提案,而不是孤立的農村試點項目。這種成本結構阻礙了北美廚餘垃圾收集服務市場中人口稀少地區的專案部署。
細分市場分析
2025年,園林綠化廢棄物佔收集總量的66.2%,而由於法規和再生天然氣(RNG)信用額度有利於高能量原料,預計到2031年,食物廢棄物將以6.89%的複合年成長率成長。隨著食物廢棄物收集服務市場將得到改善。營運商正在投資包裝去除,以改善污染控制並確保厭氧消化廠的供應,從而擴大燃料產量,並提高消化殘渣產品的接收和加工收入的確定性。適用於大規模來源的州級有機垃圾分類義務繼續擴大,不再局限於早期採用者,預計這將在未來幾年內提振對商業和機構食物廢棄物資源回收的需求。由於來源分散且具有季節性,農業殘渣的佔有率仍然很小,但由於TIER津貼支持的當地畜禽糞便項目,其處理量和區域RNG供應量正在增加。
食物廢棄物的甲烷產量和信用價值正吸引資金湧入北美有機廢棄物收集服務市場的綜合包裝去除和消化設施,使其能夠確保銷售管道、穩定處理費用並與收集商簽訂長期合約。小眾生物固形物和工業產品正透過先進的乾燥和轉換技術提升價值,這些技術有助於發電和減少碳排放。雖然園林廢棄物計畫仍是市政服務的基石,但由於低能耗材料的政策獎勵較少,其成長速度低於食物廢棄物。隨著時間的推移,透過交叉污染管理和宣傳活動提高分類質量,將降低北美有機廢棄物收集服務產業的處理成本並提高回收率。
到2025年,住宅收集將佔74.3%,這反映了支撐北美有機廢棄物收集服務市場的市政合約和用戶訂閱密度。同時,商業垃圾收集預計將以7.62%的複合年成長率成長至2031年。相關法規要求大規模產生者在距離處理設施指定距離內對食物垃圾進行分類,從而推動了市場需求的製度化,自願試點計畫也正在向合約服務模式過渡。商業和公共設施正在採用標準化的收集容器尺寸和服務水平,並利用重量追蹤和污染率指標來指導使用者行為和定價。大型零售商和製造商正在建立合作夥伴關係,以實現直接處理和可再生天然氣(RNG)的利用,從而確保環境效益和成本可預測性,這增強了商業領域的業務前景。住宅收集的成長取決於便利性和宣傳活動,而能夠將公眾意識轉化為持續垃圾處理行為的項目設計可以提高北美有機廢棄物收集服務市場的資源回收率。
商業垃圾收集量受污染模式、服務頻率、樓層平面圖密度和後院工作流程等因素影響,這些因素決定了實際可用的垃圾容器選擇。在工業食品加工領域,現場拆包和直接投放設施能夠實現可預測的處理能力,從而支持投資並維持穩定的處置率。住宅項目仍然是區域氣候策略的核心。結合園林廢棄物和宣傳資料,這些項目可以擴大規模,從而改善北美有機廢棄物收集服務業的經濟效益。在整個預測期內,商業垃圾的佔比將超過住宅垃圾,儘管住宅垃圾仍將是總處理量的最大貢獻者。
其他好處:
- Excel格式的市場預測(ME)表
- 3個月的分析師支持
目錄
第1章:引言
- 研究假設和市場定義
- 調查範圍
第2章:調查方法
第3章執行摘要
第4章 市場狀況
- 市場概覽
- 市場促進因素
- 低碳燃料標準積分用於支持有機垃圾焚化發電項目
- 聯邦和州政府為利用有機廢棄物生產可再生天然氣提供激勵措施
- 地方政府應對氣候變遷的措施計畫旨在減少掩埋的甲烷排放
- 透過聯邦政府的氣候變遷基礎設施融資計畫進行基礎設施投資
- 消費者對家庭有機廢棄物路邊收集的意識和需求不斷提高。
- 對產生大量食物廢棄物。
- 市場限制因素
- 人口稀少的郊區和農村地區的收集和處理成本很高。
- 厭氧消化和堆肥設施處理能力的局限性
- 與地方政府預算限制相衝突的優先事項
- 如果沒有強制召回計劃,參與率就會很低。
- 價值供應鏈分析
- 監理情勢
- 技術展望
- 用於廢棄物追蹤的RFID智慧垃圾桶
- 人工智慧將徹底改變廢棄物分類方式。
- 利用物聯網最佳化車輛路線
- 波特五力模型
- 廢棄物收集車輛的現代化和電氣化
- 生物甲烷對有機廢棄物收集的影響分析
- 地方政府與私人企業之間的合作正在加速發展。
- 為了實現氣候目標,人們越來越關注從有機廢棄物中回收甲烷。
第5章 市場規模與成長預測
- 廢棄物類型
- 食物廢棄物(生產和消費階段)
- 園林綠化廢棄物
- 農業殘餘物
- 其他
- 最終用戶
- 住宅
- 商業(飯店餐飲、零售)
- 工業(食品加工和製造)
- 其他(農業廢棄物)
- 透過收集方法
- 上門收集
- 引入/引入系統
- 其他
- 按下技術/設備
- 人工收集系統
- 半自動系統
- 全自動系統
- 其他
- 按地區
- 美國
- 加拿大
- 墨西哥
第6章 競爭情勢
- 市場集中度
- 策略趨勢
- 市佔率分析
- 公司簡介
- Republic Services
- Waste Connections
- Recology
- Synagro
- CompostNow
- GFL Environmental Inc.
- Compost Crew
- Black Earth Compost
- Bootstrap Compost
- Denali
- Groot Industries
- Atlas Organics
- Rumpke Waste & Recycling
- Sanimax
- Veolia
- TerraCycle
- Convertus Group
- Remix Organics
- AgRecycle
- Action Carting Environmental Services, Inc
第7章 市場機會與未來展望
According to Mordor Intelligence, the North America organic waste collection service market size was valued at USD 2.66 billion in 2025 and is estimated to grow from USD 2.80 billion in 2026 to reach USD 3.62 billion by 2031, at a CAGR of 5.25% during the forecast period (2026-2031).
This report is Segmented by Waste Type (Food Waste, Yard & Landscape Waste, and More), by End-User (Residential, and More), by Collection Method (Door-To-Door Collection, and More), by Technology & Equipment (Manual Collection Systems, and More), and Geography (United States, Canada, Mexico). The Report Offers Market Size and Forecasts in Value (USD) for all the Above Segments.
North America Organic Waste Collection Services Market Trends and Insights
Low Carbon Fuel Standard Credits Supporting Organic Waste-to-Energy Projects
State-level Low Carbon Fuel Standard (LCFS) programs in California, Oregon, and Washington are driving the growth of the North America Organic Waste Collection Service market. These programs link financial incentives to renewable natural gas (RNG) and organic waste-to-energy projects. Through LCFS credit mechanisms, waste management operators are generating additional revenue by converting food, agricultural, and municipal organic waste into biogas and low-carbon transportation fuels. California, with its LCFS framework and Senate Bill 1383 mandates for organic waste diversion, is at the forefront. These initiatives motivate municipalities and private entities to bolster food waste collection and anaerobic digestion infrastructure. Meanwhile, Oregon and Washington's parallel clean fuel policies are spurring investments in organic waste recovery and renewable energy production. As LCFS credits are monetized, they enhance the financial viability of companies in organic waste collection and processing. This boost is hastening the adoption of source-separated organic waste programs, propelling short-term market growth across the western United States in the coming two years.
Federal and State Incentives for Renewable Natural Gas (RNG) Production from Organic Waste
Section 45Z provides production tax credits through 2029 for low-carbon transportation fuels, using a GREET (Greenhouse gases, Regulated Emissions, and Energy use in Transportation)-based model that includes organic waste digestion pathways, thereby strengthening project economics for dairies, wastewater, and landfill gas. Treasury guidance issued in February 2026 clarifies that emissions rates for manure pathways can be negative, increasing the credit value for livestock digesters and accelerating underwriting for new builds. Provincial support in Canada, such as Alberta's TIER grant to Taurus Canada RNG, demonstrates parallel policy alignment that de-risks capital for large-scale manure-to-RNG projects with defined offtake pathways. Private developers are moving to commercial operations, with Clean Energy Fuels commissioning a major Texas dairy RNG facility and achieving full RIN (Renewable Identification Number) eligibility under the Renewable Fuel Standard. Verification under ISO frameworks and RFS (Renewable Fuel Standard) Part 80 helps maintain integrity of credit generation, while California's schedule to phase down avoided methane crediting after 2029 creates a timing window that is front-loading development and procurement cycles.
High Collection and Processing Costs in Low-Density Suburban and Rural Areas
Some districts report sharp increases in processing fees and disposal costs since 2022, which raises rate pressure and limits service expansion without revenue adjustments. State mandates in California and zero-emission fleet rules add costs and compress the capital cycle, making it harder to absorb on sparse routes that lack density advantages. Urban routes can trim fuel and labor by removing unnecessary stops with data tools, yet rural deployment of sensors and route optimization yields smaller savings due to distance and participation variability. Federal grants help seed projects, but competition for limited funds can favor larger and more scalable proposals over isolated rural pilots. This cost structure slows program rollouts in lower-density markets within the North America organic waste collection service market.
Other drivers and restraints analyzed in the detailed report include:
- Municipal Climate Action Plans Aimed at Reducing Landfill Methane Emissions
- Infrastructure Investment Through Federal Climate and Infrastructure Funding Programs
- Limited Anaerobic Digestion and Composting Facility Capacity
For complete list of drivers and restraints, kindly check the Table Of Contents.
Segment Analysis
Yard and landscape waste accounted for 66.2% of 2025 collections, while food waste is set to grow at a 6.89% CAGR to 2031 as mandates and RNG credit values favor high-energy feedstocks. The North American organic waste collection service market benefits when food waste streams unlock avoided methane and fuel credits under the LCFS and RFS frameworks, thereby improving. Operators are investing in depackaging to improve contamination control and feed anaerobic digestion plants, thereby scaling fuel output and increasing certainty around offtake for digestate products and processing revenue. State-level organics separation mandates that apply to large generators continue to extend beyond early adopters, which builds a multi-year lift for commercial and institutional food waste diversion. Agricultural residues remain a small share due to dispersed supply and seasonality, though co-located manure projects supported by TIER grants add throughput and regional RNG supply.
Food waste's methane yield and credit intensity draw capital toward integrated depackaging and digestion facilities that can lock in offtake, stabilize tipping fees, and create long-term contracts for haulers in the North America organic waste collection service market. Niche biosolids and industrial byproducts are being valorized through advanced drying and conversion technologies that support power generation and carbon benefits. Yard waste programs remain the backbone of municipal services, but their growth pace is slower than food waste as fewer policy incentives attach to low-energy feedstocks. Over time, cross-contamination controls and education improve diversion quality, which supports lower processing costs and higher recovery in the North America organic waste collection service industry.
Residential collection accounted for 74.3% in 2025, reflecting municipal contracts and subscription density that anchor the North American organic waste collection service market, while commercial is projected to expand at a 7.62% CAGR through 2031. Regulations that require large generators to separate food scraps within defined distances of processing sites formalize demand and shift voluntary pilots into contracted service volumes. Commercial and institutional sites respond to standardized cart sizes and service levels with weight tracking and contamination metrics that guide behavior and fees. Large retailers and manufacturers are building direct processing and RNG offtake ties to secure environmental outcomes and cost predictability, which strengthens commercial pipeline visibility. Residential growth relies on convenience and outreach, and a program design that converts awareness into repeat set-outs can improve diversion performance in the North America organic waste collection service market.
Commercial volumes are also influenced by floor-plan density and back-of-house workflows that determine contamination patterns, service cadence, and viable container options. For industrial food processing, on-site depackaging and direct injection facilities can enable predictable throughput, supporting investment and stable tip rates. Residential programs remain core to local climate strategies. When bundled with yard waste and educational materials, they can deliver scale that improves route economics in the North America organic waste collection service industry. Over the forecast horizon, commercial momentum outpaces residential growth in percentage terms, but residential remains the largest contributor to total volumes.
Complete Report Scope:
- By Waste Type
- Food Waste (Pre and Post Consumer)
- Yard & Landscape Waste
- Agricultural Residues
- Others
- By End-User
- Residential
- Commercial (HoReCa, Retail)
- Industrial (Food Processing & Manufacturing)
- Others (Agri-waste)
- By Collection Method
- Door-to-Door Collection
- Drop-Off / Bring Systems
- Others
- By Technology & Equipment
- Manual Collection Systems
- Semi-Automated Systems
- Fully Automated Systems
- Others
- By Geography
- United States
- Canada
- Mexico
List of Companies Covered in this Report:
- Republic Services
- Waste Connections
- Recology
- Synagro
- CompostNow
- GFL Environmental Inc.
- Compost Crew
- Black Earth Compost
- Bootstrap Compost
- Denali
- Groot Industries
- Atlas Organics
- Rumpke Waste & Recycling
- Sanimax
- Veolia
- TerraCycle
- Convertus Group
- Remix Organics
- AgRecycle
- Action Carting Environmental Services, Inc
Additional Benefits:
- The market estimate (ME) sheet in Excel format
- 3 months of analyst support
TABLE OF CONTENTS
1 Introduction
- 1.1 Study Assumptions & Market Definition
- 1.2 Scope of the Study
2 Research Methodology
3 Executive Summary
4 Market Landscape
- 4.1 Market Overview
- 4.2 Market Drivers
- 4.2.1 Low Carbon Fuel Standard Credits Supporting Organic Waste-To-Energy Projects
- 4.2.2 Federal and State Incentives for Renewable Natural Gas Production from Organic Waste
- 4.2.3 Municipal Climate Action Plans Aimed at Reducing Landfill Methane Emissions
- 4.2.4 Infrastructure Investment Through Federal Climate and Infrastructure Funding Programs
- 4.2.5 Rising Consumer Awareness and Demand for Curbside Organic Waste Collection
- 4.2.6 Food Waste Donation Tax Incentives for Large Generators
- 4.3 Market Restraints
- 4.3.1 High Collection and Processing Costs in Low-Density Suburban and Rural Areas
- 4.3.2 Limited Anaerobic Digestion and Composting Facility Capacity
- 4.3.3 Municipal Budget Constraints and Competing Priorities
- 4.3.4 Low Participation Without Mandatory Collection Programs
- 4.4 Value / Supply-Chain Analysis
- 4.5 Regulatory Landscape
- 4.6 Technological Outlook
- 4.6.1 RFID Smart Bins for Waste Tracking
- 4.6.2 AI Revolutionizes Waste Sorting
- 4.6.3 IoT Optimizing for Fleet Routes
- 4.7 Porter's Five Forces
- 4.7.1 Threat of New Entrants
- 4.7.2 Bargaining Power of Suppliers
- 4.7.3 Bargaining Power of Buyers
- 4.7.4 Threat of Substitutes
- 4.7.5 Industry Rivalry
- 4.8 Fleet Modernization & Electrification in Waste Collection
- 4.9 Analysis of Biomethane Impact on Organic Waste Collection
- 4.10 Collaboration Between Municipalities and Private Operators Gaining Traction
- 4.11 Growing Focus on Methane Capture from Organic Waste to Meet Climate Targets
5 Market Size & Growth Forecasts (Value, In USD Billion)
- 5.1 By Waste Type
- 5.1.1 Food Waste (Pre and Post Consumer)
- 5.1.2 Yard & Landscape Waste
- 5.1.3 Agricultural Residues
- 5.1.4 Others
- 5.2 By End-User
- 5.2.1 Residential
- 5.2.2 Commercial (HoReCa, Retail)
- 5.2.3 Industrial (Food Processing & Manufacturing)
- 5.2.4 Others (Agri-waste)
- 5.3 By Collection Method
- 5.3.1 Door-to-Door Collection
- 5.3.2 Drop-Off / Bring Systems
- 5.3.3 Others
- 5.4 By Technology & Equipment
- 5.4.1 Manual Collection Systems
- 5.4.2 Semi-Automated Systems
- 5.4.3 Fully Automated Systems
- 5.4.4 Others
- 5.5 By Geography
- 5.5.1 United States
- 5.5.2 Canada
- 5.5.3 Mexico
6 Competitive Landscape
- 6.1 Market Concentration
- 6.2 Strategic Moves
- 6.3 Market Share Analysis
- 6.4 Company Profiles {(Includes Global Level Overview, Market Level Overview, Core Segments, Financials as Available, Strategic Information, Products & Services, and Recent Developments)}
- 6.4.1 Republic Services
- 6.4.2 Waste Connections
- 6.4.3 Recology
- 6.4.4 Synagro
- 6.4.5 CompostNow
- 6.4.6 GFL Environmental Inc.
- 6.4.7 Compost Crew
- 6.4.8 Black Earth Compost
- 6.4.9 Bootstrap Compost
- 6.4.10 Denali
- 6.4.11 Groot Industries
- 6.4.12 Atlas Organics
- 6.4.13 Rumpke Waste & Recycling
- 6.4.14 Sanimax
- 6.4.15 Veolia
- 6.4.16 TerraCycle
- 6.4.17 Convertus Group
- 6.4.18 Remix Organics
- 6.4.19 AgRecycle
- 6.4.20 Action Carting Environmental Services, Inc
7 Market Opportunities & Future Outlook
- 7.1 Smart Cities & IoT Integration
- 7.2 Producer Responsibility Expansion
- 7.3 Shift Toward Decentralized Organic Waste Processing

 全球食品廢棄物管理市場規模、佔有率、趨勢和成長分析報告(2026-2034年)
 2026-2030年全球升級再造材料市場
 歐洲有機廢棄物收集服務:市場佔有率分析、行業趨勢和統計數據以及成長預測(2026-2031 年)
 升級再造食品配料市場:預測至2034年-按配料類型、來源、應用、分銷管道、最終用戶和地區分類的全球分析升級再造食品配料市場:預測至2034年-按配料類型、功能、分銷管道、應用、最終用戶和地區分類的全球分析
 食品廢棄物管理市場:2026-2032年全球市場預測(依處理技術、來源、服務模式、產品/服務、廢棄物類型和應用分類)
 2026-2030年全球食品廢棄物管理市場德國有機廢棄物收集服務:市場佔有率分析、產業趨勢與統計及成長預測(2026-2031 年)美國有機廢棄物收集服務:市場佔有率分析、行業趨勢和統計數據以及成長預測(2026-2031 年)義大利有機廢棄物收集服務:市場佔有率分析、行業趨勢和統計數據以及成長預測(2026-2031 年)