

 |
市場調查報告書
商品編碼
2063891
日本有機廢棄物收集服務:市場佔有率分析、產業趨勢與統計及成長預測(2026-2031)Japan Organic Waste Collection Services - Market Share Analysis, Industry Trends & Statistics, Growth Forecasts (2026 - 2031) |
||||||
※ 本網頁內容可能與最新版本有所差異。詳細情況請與我們聯繫。
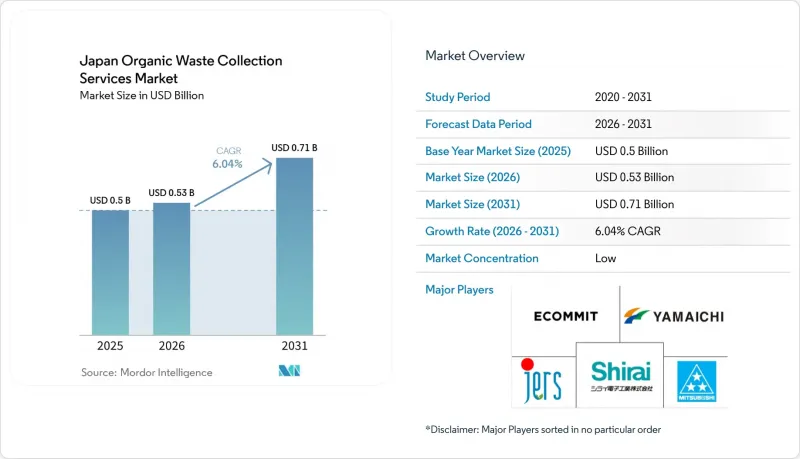
根據 Mordor Intelligence 預測,日本有機廢棄物收集服務市場規模預計在 2025 年達到 5 億美元,2026 年達到 5.3 億美元,到 2031 年達到 7.1 億美元,2026 年至 2031 年的複合年成長率為 6.04%。
本報告按廢棄物類型(食物廢棄物、園林綠化廢棄物等)、最終用戶(住宅、商業設施等)、收集方式(路邊收集等)、技術和設備(人工收集系統、半自動系統等)以及地區進行細分。市場預測以價值(美元)和數量(噸)表示。
日本有機廢棄物收集服務市場的趨勢與洞察
政府對廢棄物分類和回收制定了嚴格的規定。
2024年和2025年,隨著資源循環新措施的實施以及相關立法要求更清晰地報告回收利用情況並加強對處理結果的控制,政策推進力度加快。這些措施要求有機廢棄物收集者和處理者提高分類質量,並使用更詳細的清單和可審計的數據追蹤記錄結果。計劃於2026年左右生效的修正案將擴大高風險材料的許可製度,預計將降低有機廢棄物在接收環節出現分類錯誤和污染的風險。同時,將於2025年生效的食物損失和食物回收政策更新要求企業將可食用剩餘物與不可食用廢棄物分開,並更一致地披露數量,從而提高上游工程的品質。這些變化共同推動了對遙測、標籤和容器級檢驗的需求成長,使收集者能夠證明其分揀質量,降低處理風險,並支持國家循環經濟目標的實現。
人們越來越關注循環經濟舉措
日本已將循環經濟定位為國家戰略的基石,優先考慮將有機物作為可再生能源和土壤健康改善的來源。地方政府的案例研究表明,如果圍繞明確的規則、穩定的收集點和切實可行的成本管理來設計項目,就能擴大系統化的分類、收集和本地化處理。這些模式強調清晰的有機物回收途徑,將堆肥和沼渣中的養分返還給附近的農場,從而縮短物流距離,並增強農業循環的韌性。日本的有機廢棄物收集服務市場正受益於這項政策的調整,因為地方政府現在擁有更明確的目標、最佳實踐模板,以及更有力的預算提案依據,這些提案與有機物回收項目相關。此外,循環經濟部長級會議建議與國際資訊揭露和回收標準接軌,鼓勵企業加強其在整個廢棄物鏈中的資料收集系統。這種接軌將促進收集者和處理者進行標準化報告,進而增強對專門的廢棄物收集服務進行投資的合理性。
收集基礎設施和車輛的初始投資成本很高。
即使有補貼,新建廢棄物和回收設施的資本需求仍對市政財政造成沉重負擔。大規模能源回收和再利用廠往往需要數十年才能還清債務,即便考慮到津貼、債券和一般財政撥款也難以避免。場地準備、用地面積限制和分階段部署的要求增加了採購負擔,並可能延長投資回收期。就車輛而言,電動垃圾車和最新的壓縮式車廂有助於減少排放氣體並提高收集路線的效率,但其高昂的初始成本導致更多地依賴租賃和分階段部署。因此,財政實力雄厚的都市區和麵臨稅基萎縮的小型市政當局在部署進度上可能存在差異。營運商正在透過分階段引入小規模設備並優先開展在有機垃圾處理方面取得早期成效的試點項目來應對這一挑戰,從而為後續的資本投資階段奠定基礎。
細分市場分析
預計到2025年,食物廢棄物將佔市場佔有率的69.2%,並在2031年之前以6.78%的複合年成長率成長。這反映了監管壓力以及剩餘食物處理和揭露方式的營運變化。政策更新鼓勵零售商和餐飲企業優先捐贈可食用剩餘食物,盡可能延長保存期限,並在源頭將可食用和不可食用物品分開,從而提高分揀收集上游工程的品質。這些趨勢正在推動都市區挨家挨戶收集項目的發展,這些項目能夠維持高分揀標準和穩定的處理量,同時也促進了超級市場、便利商店連鎖和咖啡簡餐店的合約收集業務。同時,將發酵殘渣轉化為肥料和其他有用產品的項目提高了接收目的地的確定性,並改善了常規有機廢物收集路線的經濟效益。
園林綠化廢棄物和農業殘餘物的處理方式各不相同。園林廢棄物具有季節性,必須適應常規收集和堆肥設施的處理能力限制。在農村地區,作物殘餘物會被納入厭氧消化池和堆肥系統,並透過循環農業試點計畫將養分返還給農場。如果當地企業有可靠的飼料、堆肥或沼氣處理管道,也可以收集其他有機物,例如加工魚貝類產品和啤酒廠殘餘物。各地區的優先事項有所不同,但總體方向一致:更清晰的收集點、更明確的污染物處理規則以及更可預測的最終去向,尤其對於通常佔收入很大一部分的食物廢棄物而言更是如此。
到2025年,住宅垃圾將佔總需求的54.7%,並繼續構成城鎮基本垃圾收集路線密度的基礎。一些市政當局推出的住宅獎勵(例如家庭垃圾桶補貼)正在減少上門收集量和污染程度,從而最佳化路線規劃和處理能力。隨著超級市場、餐飲集團和大規模員工食堂將有機垃圾收集納入其環境、社會和治理(ESG)計畫和成本管理措施,商業垃圾收集正以7.21%的複合年成長率快速成長。商業合約增加了送往沼氣廠的廚餘垃圾路線,透過結構化安排向參與設施返還能源價值,從而增強了對定期收集和低污染垃圾流的長期需求。
食品加工業也展現出類似的成長勢頭,在追求脫碳目標的同時,致力於透過能源回收和電力再利用模式實現可靠的排放。垃圾收集商透過調整收集計劃以適應生產週期,並整合以重量為準的審計,將廢棄物資料與內部報告儀錶板連接起來,從而為這些用戶提供支援。雖然住宅的排放對於最佳化收集路線仍然至關重要,但商業領域的快速成長表明,有機廢棄物收集需要進一步融入商用廚房和全國連鎖零售系統。這一趨勢正在推動對都市區集群和更強大的數據系統進行投資,以滿足客戶的報告要求,並改善多站點營運商之間的基準比較。
其他好處:
- Excel格式的市場預測(ME)表
- 3個月的分析師支持
目錄
第1章:引言
- 研究假設和市場定義
- 調查範圍
第2章:調查方法
第3章執行摘要
第4章 市場狀況
- 市場概覽
- 市場促進因素
- 政府對廢棄物分類和回收制定了嚴格的規定。
- 人們越來越關注循環經濟計劃。
- 擴大利用有機廢棄物進行生質能發電。
- 擴建堆肥設施和沼氣廠
- 政府對有機廢棄物管理的補貼和激勵措施
- 擴大企業環境、社會及公司治理(ESG)計劃和永續發展報告要求
- 市場限制因素
- 收集基礎設施和車輛的初始投資成本很高。
- 都市區廢棄物設施用地短缺
- 有機廢棄物產生量的季節性變化會影響營運效率
- 廢棄物管理業熟練勞動力短缺
- 價值供應鏈分析
- 監理情勢
- 技術展望
- 用於廢棄物追蹤的RFID智慧垃圾桶
- 人工智慧徹底改變了廢棄物分類方式。
- 利用物聯網最佳化車輛路線
- 波特五力模型
- 廢棄物收集車輛的現代化和電氣化
- 生物甲烷對有機廢棄物收集的影響分析
- 地方政府與私人企業之間的合作正在加速發展。
- 為了實現氣候目標,人們越來越關注從有機廢棄物中回收甲烷。
第5章 市場規模及成長預測(價值:美元,數量:噸)
- 廢棄物類型
- 食物廢棄物(生產和消耗階段)
- 園林綠化廢棄物
- 農業殘餘物
- 其他
- 最終用戶
- 住宅
- 商業(飯店餐飲、零售)
- 工業(食品加工和製造)
- 其他(農業廢棄物)
- 透過收集方法
- 上門收集
- 投放和回收系統
- 其他
- 按下技術/設備
- 人工收集系統
- 半自動系統
- 全自動系統
- 其他
第6章 競爭情勢
- 市場集中度
- 策略趨勢
- 市佔率分析
- 公司簡介
- ECOMMIT Co., Ltd.
- Mitsuboshi Sangyo Ltd.
- Shirai Group
- JERS Corporation
- J&T Recycling Corporation
- Green Power Co., Ltd.
- Japan Food Ecology Center, Inc
- Yokohama City Visitors Bureau
- KITA
- NTT Business Solutions Corporation
- Veolia
- TOYO ENERGY SOLUTION CO., LTD.
- Bio Energy Corporation
- DAIEI KANKYO
- Genesis Co., Ltd.
- Joetsu Materials Corporation
- Japan Waste Co.,Ltd.
- Sanimax
- TAKEEI CORPORATION
第7章 市場機會與未來展望
According to Mordor Intelligence, the japan organic waste collection services market size is projected to be USD 0.5 billion in 2025, USD 0.53 billion in 2026, and reach USD 0.71 billion by 2031, growing at a CAGR of 6.04% from 2026 to 2031.
This report is Segmented by Waste Type (Food Waste, Yard & Landscape Waste, and More), by End-User (Residential, Commercial, and More), by Collection Method (Door-To-Door Collection, and More), by Technology & Equipment (Manual Collection Systems, Semi-Automated Systems, and More), and by Geography. The Market Forecasts are Provided in Terms of Value (USD) and Volume (Tons).
Japan Organic Waste Collection Services Market Trends and Insights
Stringent Government Regulations on Waste Segregation and Recycling
Policy momentum accelerated in 2024 and 2025 with new resource-circulation measures and related enforcement that require clearer reporting on recycling implementation and tighter controls on treatment outcomes. These measures pressure organic waste collectors and processors to improve segregation quality and document outcomes with more detailed manifests and auditable data trails. Planned updates scheduled to take effect around 2026 are also expected to broaden permit regimes for higher-risk materials, reducing mis-sorting and contamination risks in organics flows at the point of intake. In parallel, food-loss and food-recycling policy updates effective in 2025 are pushing enterprises to separate edible surplus from inedible streams and to disclose volumes more consistently, thereby improving upstream quality for separate collection. Together, these shifts translate into higher demand for telemetry, tagging, and container-level verification, enabling haulers to demonstrate segregation quality while lowering treatment risk and supporting national circularity goals.
Growing Emphasis on Circular Economy Initiatives
Japan has elevated the circular economy to a national strategic pillar, framing organics as a priority feedstock for renewable energy and soil health outcomes. Municipal case studies demonstrate that systematic separation, collection, and localized processing can scale when programs are designed around clear rules, stable offtake, and practical cost controls. These models favor defined organic pathways that return compost and digestate-derived nutrients to nearby farms, enabling short-haul logistics and more resilient agricultural loops. The Japan organic waste collection service market gains from this policy alignment because municipalities now have clearer targets, better precedent templates, and a stronger rationale for budget proposals tied to organics recovery projects. The Ministerial Council on the Circular Economy also signaled harmonization with global disclosure and recycling standards, which nudges enterprises to upgrade data capture across their waste chains. This convergence encourages standardized reporting from haulers and processors, in turn strengthening the investment case for specialized collection services for food waste.
High Initial Investment Costs for Collection Infrastructure and Vehicles
Capital requirements for new waste treatment and recycling facilities continue to strain municipal finances, even when subsidies are available. Large-scale energy recovery and recycling plants often create multi-decade debt service commitments after accounting for grants, bonds, and general revenue allocations. Site preparation, footprint constraints, and phasing requirements can add to procurement burden and extend payback periods. On the fleet side, EV refuse vehicles and modern compaction bodies can improve emissions performance and routing outcomes, but higher upfront costs increased reliance on leasing and phased deployments. As a result, adoption curves can diverge between cash-rich urban districts and smaller municipalities facing shrinking tax bases. Operators are responding by rolling out modular equipment in phases and prioritizing pilots that deliver quick wins in the organics fraction, building support for subsequent capital phases.
Other drivers and restraints analyzed in the detailed report include:
- Increasing Adoption of Biomass Energy Generation from Organic Waste
- Expansion of Composting Facilities and Biogas Plants
- Limited Land Availability for Waste Processing Facilities in Urban Areas
For complete list of drivers and restraints, kindly check the Table Of Contents.
Segment Analysis
Food waste held 69.2% share in 2025 and is forecast to grow at a 6.78% CAGR through 2031, reflecting regulatory pressure and operational changes in how surplus is handled and disclosed. Policy updates are encouraging retailers and food-service operators to prioritize donating edible surplus, extend shelf life where feasible, and separate edible from inedible streams at source, thereby improving upstream quality for separate collection. These dynamics favor urban curbside programs and contracted pickups for supermarkets, convenience chains, and cafeterias that can maintain high segregation standards and stable volumes. In parallel, projects that convert fermentation residue to fertilizer or other usable outputs strengthen offtake certainty, improving the economics of recurring organics routes.
Yard and landscape waste, as well as agricultural residues, follow distinct logistics patterns. Yard waste is seasonal and aligns with periodic collections and compost-site throughput constraints. In rural prefectures, crop residues may be integrated into digesters or compost systems that feed nutrients back to farms, often through circular-agriculture pilots. Miscellaneous organic streams, such as fish-processing byproducts or brewery residues, can also be captured where local operators have a reliable offtake for feed, compost, or biogas applications. While priorities vary by region, the overall direction remains consistent: more defined collection points, clearer contamination rules, and more predictable offtake especially for food waste, which accounts for most revenue.
Residential generators accounted for 54.7% of demand in 2025 and continue to underpin base route density in cities and towns. Household incentives in select municipalities (such as subsidies for home processing containers) can reduce curbside volumes and contamination, improving routing and capacity planning. Commercial segments are expanding faster, at a 7.21% CAGR, as supermarkets, restaurant groups, and large canteens embed organic recovery into ESG programs and cost-control initiatives. Commercial contracts increasingly route food scraps to biogas plants and use structured arrangements to return electricity value to participating sites, strengthening long-term demand for scheduled pickups and contamination-light streams.
Industrial food processors show similar momentum as they pursue decarbonization milestones and seek credible emissions reductions through energy recovery and return-power models. Collection providers support these users by synchronizing pickups with production cycles and integrating weight-based audits that connect waste data to internal reporting dashboards. Residential volumes will remain important for route efficiency, while faster commercial growth signals deeper integration of organics capture into occupational kitchens and national retail chains. This trend is steering investments toward urban transfer points and stronger data systems to meet customer reporting expectations and improve benchmarking across multi-site operators.
List of Companies Covered in this Report:
- ECOMMIT Co., Ltd.
- Mitsuboshi Sangyo Ltd.
- Shirai Group
- JERS Corporation
- J&T Recycling Corporation
- Green Power Co., Ltd.
- Japan Food Ecology Center, Inc
- Yokohama City Visitors Bureau
- KITA
- NTT Business Solutions Corporation
- Veolia
- TOYO ENERGY SOLUTION CO., LTD.
- Bio Energy Corporation
- DAIEI KANKYO
- Genesis Co., Ltd.
- Joetsu Materials Corporation
- Japan Waste Co.,Ltd.
- Sanimax
- TAKEEI CORPORATION
Additional Benefits:
- The market estimate (ME) sheet in Excel format
- 3 months of analyst support
TABLE OF CONTENTS
1 Introduction
- 1.1 Study Assumptions & Market Definition
- 1.2 Scope of the Study
2 Research Methodology
3 Executive Summary
4 Market Landscape
- 4.1 Market Overview
- 4.2 Market Drivers
- 4.2.1 Stringent Government Regulations on Waste Segregation and Recycling
- 4.2.2 Growing Emphasis on Circular Economy Initiatives
- 4.2.3 Increasing Adoption of Biomass Energy Generation from Organic Waste
- 4.2.4 Expansion of Composting Facilities and Biogas Plants
- 4.2.5 Government Subsidies and Incentives for Organic Waste Management
- 4.2.6 Growing Corporate ESG Commitments and Sustainability Reporting Requirements
- 4.3 Market Restraints
- 4.3.1 High Initial Investment Costs for Collection Infrastructure and Vehicles
- 4.3.2 Limited Land Availability for Waste Processing Facilities in Urban Areas
- 4.3.3 Seasonal Variations in Organic Waste Generation Affecting Operational Efficiency
- 4.3.4 Shortage of Skilled Workforce in the Waste Management Sector
- 4.4 Value / Supply-Chain Analysis
- 4.5 Regulatory Landscape
- 4.6 Technological Outlook
- 4.6.1 RFID Smart Bins for Waste Tracking
- 4.6.2 AI Revolutionizes Waste Sorting
- 4.6.3 IoT Optimizing for Fleet Routes
- 4.7 Porter's Five Forces
- 4.7.1 Threat of New Entrants
- 4.7.2 Bargaining Power of Suppliers
- 4.7.3 Bargaining Power of Buyers
- 4.7.4 Threat of Substitutes
- 4.7.5 Industry Rivalry
- 4.8 Fleet Modernization & Electrification in Waste Collection
- 4.9 Analysis of Biomethane Impact on Organic Waste Collection
- 4.10 Collaboration Between Municipalities and Private Operators Gaining Traction
- 4.11 Growing Focus on Methane Capture from Organic Waste to Meet Climate Targets
5 Market Size & Growth Forecasts (Value in USD & Volume in Tons)
- 5.1 By Waste Type
- 5.1.1 Food Waste (Pre and Post Consumer)
- 5.1.2 Yard & Landscape Waste
- 5.1.3 Agricultural Residues
- 5.1.4 Others
- 5.2 By End-User
- 5.2.1 Residential
- 5.2.2 Commercial (HoReCa, Retail)
- 5.2.3 Industrial (Food Processing & Manufacturing)
- 5.2.4 Others (Agri-waste)
- 5.3 By Collection Method
- 5.3.1 Door-to-Door Collection
- 5.3.2 Drop-Off / Bring Systems
- 5.3.3 Others
- 5.4 By Technology & Equipment
- 5.4.1 Manual Collection Systems
- 5.4.2 Semi-Automated Systems
- 5.4.3 Fully Automated Systems
- 5.4.4 Others
6 Competitive Landscape
- 6.1 Market Concentration
- 6.2 Strategic Moves
- 6.3 Market Share Analysis
- 6.4 Company Profiles {(Includes Global Level Overview, Market Level Overview, Core Segments, Financials as Available, Strategic Information, Products & Services, and Recent Developments)}
- 6.4.1 ECOMMIT Co., Ltd.
- 6.4.2 Mitsuboshi Sangyo Ltd.
- 6.4.3 Shirai Group
- 6.4.4 JERS Corporation
- 6.4.5 J&T Recycling Corporation
- 6.4.6 Green Power Co., Ltd.
- 6.4.7 Japan Food Ecology Center, Inc
- 6.4.8 Yokohama City Visitors Bureau
- 6.4.9 KITA
- 6.4.10 NTT Business Solutions Corporation
- 6.4.11 Veolia
- 6.4.12 TOYO ENERGY SOLUTION CO., LTD.
- 6.4.13 Bio Energy Corporation
- 6.4.14 DAIEI KANKYO
- 6.4.15 Genesis Co., Ltd.
- 6.4.16 Joetsu Materials Corporation
- 6.4.17 Japan Waste Co.,Ltd.
- 6.4.18 Sanimax
- 6.4.19 TAKEEI CORPORATION
7 Market Opportunities & Future Outlook
- 7.1 Smart Cities & IoT Integration
- 7.2 Producer Responsibility Expansion
- 7.3 Shift Toward Decentralized Organic Waste Processing
 北美有機廢棄物收集服務:市場佔有率分析、行業趨勢和統計數據以及成長預測(2026-2031 年)歐洲有機廢棄物收集服務:市場佔有率分析、行業趨勢和統計數據以及成長預測(2026-2031 年)
 升級再造食品配料市場:預測至2034年-按配料類型、功能、分銷管道、應用、最終用戶和地區分類的全球分析
 食品廢棄物管理市場:2026-2032年全球市場預測(依處理技術、來源、服務模式、產品/服務、廢棄物類型和應用分類)
 2026-2030年全球食品廢棄物管理市場德國有機廢棄物收集服務:市場佔有率分析、產業趨勢與統計及成長預測(2026-2031 年)美國有機廢棄物收集服務:市場佔有率分析、行業趨勢和統計數據以及成長預測(2026-2031 年)義大利有機廢棄物收集服務:市場佔有率分析、行業趨勢和統計數據以及成長預測(2026-2031 年)有機廢棄物收集:市場佔有率分析、產業趨勢與統計、成長預測(2026-2031)
 2026年全球食品回收市場報告