


 |
市場調查報告書
商品編碼
2099785
歐洲有機廢棄物收集服務:市場佔有率分析、行業趨勢和統計數據以及成長預測(2026-2031 年)Europe Organic Waste Collection Services - Market Share Analysis, Industry Trends & Statistics, Growth Forecasts (2026 - 2031) |
||||||

※ 本網頁內容可能與最新版本有所差異。詳細情況請與我們聯繫。
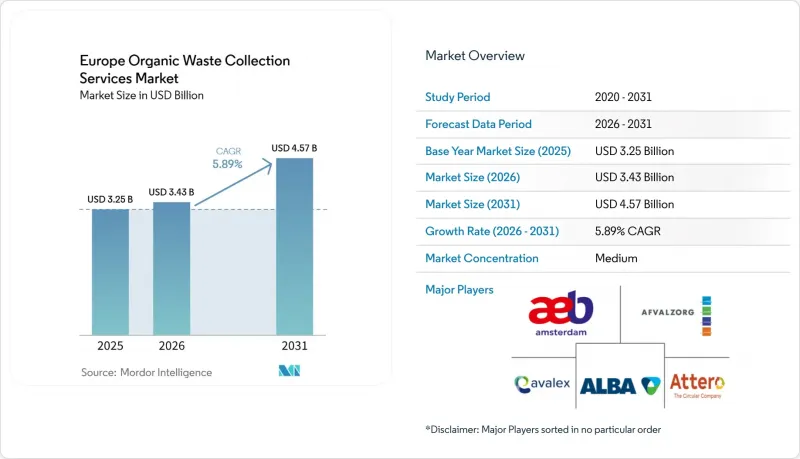
根據 Mordor Intelligence 預測,歐洲有機廢棄物收集服務市場規模預計將在 2025 年達到 32.5 億美元,2026 年達到 34.3 億美元,到 2031 年達到 45.7 億美元,2026 年至 2031 年的複合年成長率為 5.89%。
本報告按廢棄物類型(食物廢棄物、園林綠化廢棄物等)、最終用戶(住宅等)、收集方式(路邊收集等)、技術和設備(人工收集系統等)以及地區(英國、德國等)進行細分。報告提供了上述所有細分市場的規模和預測(以美元計)。
歐洲有機廢棄物收集服務市場趨勢與洞察
成員國對掩埋指令的監管以及掩埋稅的提高
歐盟關於廚餘垃圾分類收集的要求導致各地實施日期不一,採購進度錯開,使那些在當地截止日期前進行投資的企業獲得了先發優勢,尤其是在希臘、葡萄牙、羅馬尼亞以及弗蘭德斯等國家。在FLANDERS,市政合約的批准速度正在加快,以趕在2026年1月過渡期截止日期前完成。在希臘,從2026年起,掩埋稅將提高到每噸35-45歐元,即使考慮到每個綜合設施都需要進行大量的設備升級投資,這也使得消化處理的成本優勢更加明顯。這進一步凸顯了最佳化收集路線和品管收集的商業價值。一些成員國的實施差距導致了剩餘廢棄物的產生,阻礙了分類收集的推廣。這是因為掩埋稅低且執法力度不足,導致非正式的廢棄物轉移,從而減少了生物甲烷價值鏈原料的穩定供應。這份「預警報告」指出,多數成員國在有機廢棄物處理方面亟需改進。報告指出,鑑於各國處理能力的短缺和延誤情況,必鬚根據設施的運營運作分階段實施收集契約,以避免設施運轉率低下和閒置。葡萄牙的垃圾掩埋場容量掩埋凸顯了綜合運營商的作用,這些運營商能夠在分類收集系統下,將廢棄物轉化為堆肥或厭氧消化處理,同時保持污染控制。歐盟計畫於2027年進行的目標審查可能會帶來規劃上的不確定性,並導致資本投資的延遲。因此,能夠調整處理能力並分階段實施投資的營運商,既能在歐洲有機廢棄物收集服務市場持續發展,又能靈活應對政策變化。
根據 REPowerEU 的能源安全目標,對沼氣和生物甲烷的需求不斷成長。
REPowerEU提出的350億立方公尺生物甲烷目標重新定義了有機物作為能源的用途。然而,目前的產量遠低於潛在水平。根據產業數據,原料採購的缺口意味著生物甲烷的裝置容量遠超過實際產量,而產能擴張仍受到收集瓶頸的限制。在一些關鍵國家,政策模式對市場動能的影響遠大於現有工廠的數量。在法國,儘管小規模設施數量眾多,但由於競標制度和認證要求,生物甲烷產量仍在成長;而在德國,儘管擁有大規模的基礎設施和多年的專業經驗,但由於監管的不穩定性,投資增速放緩。丹麥生物甲烷的高滲透率得益於長期支持系統和新推出的二氧化碳捕集、利用與儲存(CCUS)獎勵,這表明,當收集投資與長期穩定的發展相結合時,其回報率會得到提高。在南歐,管道建設正從低水準逐步擴展,西班牙和葡萄牙都制定了目標並調動了資金籌措機制。然而,由於授權和實施方面的延誤,要使供應與電網連接計畫保持一致,就需要建立可靠的分類流程,同時進行資產升級。歐盟層級的融資機構正在審查並確保向電網注入生物甲烷的準備就緒,以降低管道連接風險。一個典型的例子是為國家輸電基礎設施和區域項目提供融資,這些項目旨在建立從收集容器到生物甲烷吸收的可預測路徑。這種協調凸顯了政策和資金籌措的一致性如何彌合歐洲有機廢棄物收集服務市場分類記錄與永續成長之間的差距。
歐盟成員國之間法規結構分散且執行情況不一
生物甲烷來源保障機制的差異以及註冊系統互不相互通性阻礙了證書跨境的順暢流通。這降低了將廢棄物豐富的地區與回收市場連接起來的能力,並使在多個成員國運營的企業的區域整合策略變得複雜。一些國家法規要求混合生物甲烷必須在國內生產,這限制了可交易證書的市場進入,並維持了可能無法達到最佳營運和資金籌措規模的小規模規模區域生態系統。各國不同的支持力度和生物甲烷目標造成了監管套利,導致資本和車輛投資傾向於流向那些擁有更可靠支持和更清晰合約模式的司法管轄區。將修訂後的《廢棄物框架指令》納入國家法律的20個月寬限期使行動較早的地區獲得優勢,而行動較慢的地區可能需要縮短規劃、採購和實施時間表,這可能會增加承包商溢價和獨立回收系統的實施風險。定義和計算方法的差異會降低迴收率和績效指標的可比性,使基準測試複雜化,並可能扭曲對收集策略成功與否的看法。
細分市場分析
食物廢棄物佔回收有機物的最大佔有率,達 62.3%,且年複合成長率 (CAGR) 為 6.89%。這反映出歐洲有機廢棄物收集服務市場優先處理適合厭氧消化的高水分廢棄物,因為這類垃圾的監管目標與生物甲烷的經濟效益相符。由於歐盟家庭食物廢棄物仍然很高,市政當局必須在收集路線和污染物控制方面保持柔軟性,同時推廣預防性計畫以實現目標。這是因為必須回收高品質的殘渣用於下游加工。雖然預計成員國的應對措施將結合捐贈獎勵和能源回收機制,但可靠的收集系統對於實現與 REPowerEU 相關的能源目標仍然至關重要,這進一步加強了收集容器、收集車輛和生物甲烷生產能力規劃之間的協調。園林綠化廢棄物具有季節性變化,通常被運送到堆肥設施,但新興項目表明,如果選擇厭氧消化,透過先進的預處理可以提高沼氣產量。農業殘餘物作為消化基質的基材不斷擴大,但由於這些廢棄物大多是在市政合約未涵蓋的農場規模設施中收集的,因此其對歐洲廢棄物廢棄物服務市場相關的都市區收集路線的影響有限。
在食物廢棄物中,加工製造過程中產生的「消費前」部分濃度更高,更容易預測,從而降低了污染風險,並符合嚴格的品質標準,便於進行消化和堆肥處理。成員國推行非生活廢棄物「按量付費」模式,收費生產前垃圾產生者在源頭實施品管,從而提高整個供應鏈的產量並減少不合格產品。地方政府正在試行透明標籤和數位化工具,指導公民正確處理垃圾,這對於維持低雜質含量堆肥和沼氣產品的市場競爭力至關重要。關於平衡捐贈和能源回收的政策辯論仍在繼續,企業需要使收集合約與減廢棄物目標保持一致,以避免可食用食物最終進入消化處理流程。歐洲與食物廢棄物相關的有機廢棄物收集服務市場的規模,得益於一系列法規、基礎設施建設以及在「品質第一」計劃下生物甲烷和堆肥分銷中不斷擴大的貨幣化機會。
隨著市政當局擴大上門垃圾收集計劃,預計到2025年,住宅垃圾將佔市場佔有率的54.8%。同時,隨著零售和餐飲業適應減量目標並加強在歐洲有機廢棄物收集服務市場中對分類收集的參與,商業餐飲服務業的複合年成長率預計將達到7.62%。由於住宅垃圾中的大部分食物廢棄物來自家庭,因此持續進行宣傳活動和污染管理對住宅垃圾服務至關重要。成功的關鍵在於使用便利的垃圾桶、可靠的收集時間表以及清晰的回饋機制,以糾正垃圾分類行為。市政當局正在實施更新的標籤和線上儀表板,用於記錄垃圾品質並共用操作員檢查的圖像,從而增強公眾信任,並為市民提供即時調整垃圾分類方法的工具。在商業餐飲服務領域,整合RFID和動態稱重功能的垃圾桶支援基於使用量的收費系統,提高合規性,並允許負責人追蹤特定設施和班次的污染情況。在生產者延伸責任制 (EPR) 的框架下,相關的廢棄物流正與更廣泛的循環經濟舉措保持一致,而提供綜合合規服務的供應商可以在歐洲有機廢棄物收集服務市場的各個類別中獲得更大的市場佔有率。
工業設施是消費前有機廢棄物的來源,通常需要單獨的物流和污染控制。因此,為這些設施提供服務的供應商正在實施與客戶環境管理系統整合的檢驗工具和報告模組。現場處理技術能夠減少有機物的體積並使其穩定,作為異地收集的補充,正日益受到關注。如果生物消化器正確實施,已有減少處理量和溫室氣體排放的案例。然而,各地區在參與率和實施準備方面仍然存在差異,較低的分類收集率與財政和行政方面的限制有關,這些限制阻礙了高品質部署的速度。事實證明,結合可靠路線、清潔收集容器計劃和快速的公民反饋機制的服務模式對於彌合政策目標與日常排放行為之間的差距至關重要,並直接促進了歐洲有機廢棄物收集服務市場的成長。
其他好處:
- Excel格式的市場預測(ME)表
- 3個月的分析師支持
目錄
第1章:引言
- 研究假設和市場定義
- 調查範圍
第2章:調查方法
第3章執行摘要
第4章 市場狀況
- 市場概覽
- 市場促進因素
- 成員國的掩埋法規和掩埋稅增加
- 根據 REPowerEU 的能源安全目標,對沼氣和生物甲烷的需求不斷成長。
- 「從農場到餐桌」策略旨在減少食物廢棄物和回收資源。
- 擴大生產者責任制(EPR)計畫將涵蓋有機廢棄物流
- 地方政府為實現氣候中和及甲烷減量目標所採取的舉措
- 收集系統的技術創新和廢棄物管理的數位化
- 市場限制因素
- 歐盟成員國之間的法律規範各不相同,導致執行上有差異。
- 收集車輛和分類設施的基礎設施投資成本高昂
- 混合有機廢棄物的污染率會影響下游製程的處理品質
- 東歐和南歐加工能力不足
- 價值供應鏈分析
- 監理情勢
- 技術展望
- 用於廢棄物追蹤的RFID智慧垃圾桶
- 人工智慧將徹底改變廢棄物分類方式。
- 利用物聯網最佳化車輛路線
- 產業吸引力—五力分析
- 新進入者的威脅
- 供應商的議價能力
- 買方的議價能力
- 替代品的威脅
- 產業競爭
- 廢棄物收集車輛的現代化和電氣化
- 生物甲烷對有機廢棄物收集的影響分析
- 地方政府與私人企業之間的合作正在加速。
- 為了實現氣候目標,人們越來越關注從有機廢棄物中回收甲烷。
第5章 市場規模與成長預測
- 廢棄物類型
- 食物廢棄物(生產和消耗階段)
- 園林綠化廢棄物
- 農業殘餘物
- 其他
- 最終用戶
- 住宅
- 商業(飯店餐飲、零售)
- 工業(食品加工和製造)
- 其他(農業廢棄物)
- 透過收集方法
- 上門收集
- 引入/引入系統
- 其他
- 按下技術/設備
- 人工收集系統
- 半自動系統
- 全自動系統
- 其他
- 按地區
- 英國
- 德國
- 法國
- 義大利
- 西班牙
- 俄羅斯
- 其他歐洲國家
第6章 競爭情勢
- 市場集中度
- 策略趨勢
- 市佔率分析
- 公司簡介
- AEB Amsterdam
- Afvalzorg
- ALBA Group
- Attero
- Avalex
- AVEA GmbH & Co. KG
- Bartscherer & Co. Recycling GmbH
- Berliner Stadtreinigungsbetriebe AoR
- Biorepack Consortium
- Blue Wings Composting
- Circulus Agtech
- Contarina SpA
- FCC Environment
- Geocycle GmbH
- GP Groot
- Gruppo Hera
- GS-Recycling Nederland
- Herambiente
- Indaver
- Interzero Holding
第7章 市場機會與未來展望
According to Mordor Intelligence, the Europe organic waste collection services market size is projected to be USD 3.25 billion in 2025, USD 3.43 billion in 2026, and reach USD 4.57 billion by 2031, growing at a CAGR of 5.89% from 2026 to 2031.
This report is Segmented by Waste Type (Food Waste, Yard & Landscape Waste, and More), by End-User (Residential, and More), by Collection Method (Door-To-Door Collection, and More), by Technology & Equipment (Manual Collection Systems, and More), and by Geography (United Kingdom, Germany, and More). The Report Offers Market Size and Forecasts in Value (USD) for all the Above Segments.
Europe Organic Waste Collection Services Market Trends and Insights
Landfill Directive Restrictions and Escalating Landfill Taxes Across Member States
The EU's requirement for separate bio-waste collection has created uneven enforcement timelines, resulting in staggered procurement windows and early-mover advantages for operators who invested ahead of local deadlines in countries such as Greece, Portugal, and Romania, and in regions like Flanders, where the January 2026 cutover is accelerating municipal contracting decisions. Greece's landfill tax progression to a EUR 35-45 per tonne range from 2026 shifts the cost parity toward digestion pathways even when accounting for significant upgrading investments per integrated facility, which strengthens the business case for route optimization and quality-controlled collection. Implementation gaps in some member states sustain residual flows and undercut separate collection growth, as modest landfill levies and enforcement limits are linked to informal transfers that reduce predictable feedstock supply for biomethane value chains. Early Warning Reports identified a need to improve bio-waste performance in most member states, and specific country-level capacity shortages and delays show that collection contracts must be sequenced with facility readiness to avoid underutilization or stranded equipment. Portugal's tight landfill capacity window emphasizes the role of integrated operators that can divert flows to composting or digestion while maintaining contamination control under separate collection schemes. A scheduled 2027 EU review of targets introduces planning uncertainty that can delay capital commitments, so operators that can flex capacity arrangements and stage investments are better positioned to weather policy recalibration while continuing growth in the Europe organic waste collection service market
Growing Biogas and Biomethane Demand Aligned with REPowerEU Energy Security Goals
REPowerEU's 35 bcm biomethane goal redefines organics as energy feedstock, yet capacity additions remain constrained by collection bottlenecks as current production is far below potential, with association data showing installed biomethane capacity that outpaces output by a notable margin due to feedstock procurement gaps. Across key countries, policy models determine momentum more than legacy plant count, with auction frameworks and certificate obligations in France lifting output despite many small units, while regulatory volatility in Germany slows investments even with a large installed base and long-standing expertise. Denmark's high biomethane penetration is supported by long-duration support schemes and emerging CCUS incentives, indicating that yields on collection investments grow when paired with long-term offtake stability. Southern Europe's pipeline is expanding from a low base, with Spain and Portugal setting targets and mobilizing funding tools, though permitting gaps and execution delays show that reliable separate collection flows must develop in parallel with upgrading assets to synchronize supply with grid-injection plans. EU-level lenders are underwriting grid-injection readiness to de-risk pipeline connections, exemplified by loans that extend to national transmission infrastructure and regional projects that create predictable pathways from bins to biomethane offtake. These linkages reinforce how cohesive policies and financing shorten the distance between separate collection performance and sustained growth in the Europe organic waste collection service market.
Fragmented Regulatory Frameworks and Implementation Gaps Across EU Member States
The coexistence of different biomethane guarantee-of-origin schemes and non-interoperable registries blocks seamless cross-border certificate flows, which reduces the ability to match waste-rich regions with offtake markets and complicates regional consolidation strategies for operators working across multiple member states. Some national rules require that biomethane for blending originate domestically, which narrows market access for tradable certificates and sustains smaller local ecosystems that may not reach optimal scale for operations and financing. Countries have set widely differing biomethane targets with varied support instruments, and these asymmetries create regulatory arbitrage that tends to shift capital and fleet investments toward jurisdictions with more reliable support and clearer contract models. The 20-month window to transpose the revised Waste Framework Directive puts early movers at an advantage, while lagging regions will need to compress planning, procurement, and rollout, potentially raising contractor premiums and execution risk for separate collection systems. Differences in definitions and calculation methods reduce comparability of recycling rates and performance metrics, which complicates benchmarking and can distort the perceived success of collection strategies.
Other drivers and restraints analyzed in the detailed report include:
- Farm to Fork Strategy Promoting Food Waste Reduction and Resource Recovery
- Extended Producer Responsibility Schemes Expanding to Organic Waste Streams
- High Infrastructure Investment Needs for Vehicles and Facilities
For complete list of drivers and restraints, kindly check the Table Of Contents.
Segment Analysis
Food waste accounts for the largest portion of collected organics at 62.3% and is advancing at a 6.89% CAGR, which reflects how regulatory targets and biomethane economics align to prioritize high-moisture streams for digestion within the Europe organic waste collection service market. The household share of EU food waste remains elevated, so municipalities need to maintain route flexibility and contamination control even as targets drive prevention programs, since collections must still capture residuals at high quality for downstream processing. Member-state adaptations will blend donation incentives with energy recovery structures, yet reliable collection remains central to energy targets tied to REPowerEU, which tightens links between bins, trucks, and biomethane capacity planning. Yard and landscape waste tends to follow seasonal patterns and often routes to composting, while emerging projects demonstrate potential for advanced pre-treatment to boost gas yields where digestion is selected. Agricultural residues continue to expand as digestion substrates, yet many of these flows are captured by farm-scale assets that sit outside municipal contracts, which moderates the influence of these streams on urban collection routes tied to the Europe organic waste collection service market.
Within food waste, pre-consumer fractions from processing and manufacturing can be more concentrated and predictable, which reduces contamination risk and aligns with offtake planning for digestion and composting under strict quality standards. Member-state moves toward pay-as-you-throw for non-households build incentives for pre-consumer generators to adopt quality controls at the source, which supports higher yields and fewer rejects across the chain. Municipalities are testing transparent labeling and citizen-facing digital tools to guide correct set-outs, which is essential to maintain marketability of compost and biogas products that depend on low impurity levels. Policy debates continue on the balance between donation and energy recovery, and operators need to align collection contracts with prevention targets to avoid unintended shifts that send edible food into digestion pathways. The Europe organic waste collection service market size linked to food waste is supported by the intersection of regulation, infrastructure rollout, and the growing monetization opportunities in biomethane and compost streams under quality-first programs.
Residential users held 54.8% share in 2025 as municipalities expanded door-to-door programs, while commercial food service is projected to post a 7.62% CAGR as retail and hospitality adapt to reduction targets and strengthen participation in separate collection across the Europe organic waste collection service market. The residential base requires sustained education and contamination management since households generate much of the EU's food waste, and performance depends on easy-to-use containers, reliable schedules, and clear feedback that corrects sorting behavior. Municipalities are rolling out updated labeling and online dashboards that record set-out quality and share images from operator inspections, which improves trust and gives citizens the tools to adjust practices in real time. In the commercial food service segment, integrated bins with RFID and dynamic weighing support pay-as-you-throw tariffs and strengthen compliance, while enabling auditors to map contamination to particular sites or shifts. Under Extended Producer Responsibility frameworks, related waste streams are being aligned to broader circular initiatives, and operators that offer integrated compliance services can capture more wallet share across categories for the Europe organic waste collection service market.
Industrial facilities contribute to pre-consumer organic outputs and often require tailored logistics and contamination controls, so operators serving these sites are embedding verification tools and reporting modules that integrate with client environmental management systems. On-site processing technologies that reduce volume and stabilize organic matter are gaining attention as complements to off-site collection, and cases show reductions in handled volume and greenhouse gas footprints when biodigesters are deployed correctly. Regional differences persist in participation and readiness, with lagging separate collection rates tied to financial and administrative constraints that limit the speed of high-quality rollout. Service models that combine route reliability with clean bin programs and responsive citizen feedback loops are proving essential to narrowing the gap between policy ambition and day-to-day set-out behavior, which directly supports growth in the Europe organic waste collection service market.
Complete Report Scope:
- By Waste Type
- Food Waste (Pre and Post Consumer)
- Yard & Landscape Waste
- Agricultural Residues
- Others
- By End-User
- Residential
- Commercial (HoReCa, Retail)
- Industrial (Food Processing & Manufacturing)
- Others (Agri-waste)
- By Collection Method
- Door-to-Door Collection
- Drop-Off / Bring Systems
- Others
- By Technology & Equipment
- Manual Collection Systems
- Semi-Automated Systems
- Fully Automated Systems
- Others
- By Geography
- United Kingdom
- Germany
- France
- Italy
- Spain
- Russia
- Rest of Europe
List of Companies Covered in this Report:
- AEB Amsterdam
- Afvalzorg
- ALBA Group
- Attero
- Avalex
- AVEA GmbH & Co. KG
- Bartscherer & Co. Recycling GmbH
- Berliner Stadtreinigungsbetriebe AoR
- Biorepack Consortium
- Blue Wings Composting
- Circulus Agtech
- Contarina S.p.A.
- FCC Environment
- Geocycle GmbH
- GP Groot
- Gruppo Hera
- GS-Recycling Nederland
- Herambiente
- Indaver
- Interzero Holding
Additional Benefits:
- The market estimate (ME) sheet in Excel format
- 3 months of analyst support
TABLE OF CONTENTS
1 Introduction
- 1.1 Study Assumptions & Market Definition
- 1.2 Scope of the Study
2 Research Methodology
3 Executive Summary
4 Market Landscape
- 4.1 Market Overview
- 4.2 Market Drivers
- 4.2.1 Landfill Directive restrictions and escalating landfill taxes across member states
- 4.2.2 Growing biogas and biomethane demand aligned with REPowerEU energy security goals
- 4.2.3 Farm to Fork Strategy promoting food waste reduction and resource recovery
- 4.2.4 Extended Producer Responsibility (EPR) schemes expanding to organic waste streams
- 4.2.5 Municipal commitments to climate neutrality and methane emission reduction targets
- 4.2.6 Technological innovation in collection systems and digitalization of waste management
- 4.3 Market Restraints
- 4.3.1 Fragmented regulatory frameworks and implementation gaps across EU member states
- 4.3.2 High infrastructure investment costs for collection vehicles and sorting facilities
- 4.3.3 Contamination rates in mixed organic waste affecting downstream processing quality
- 4.3.4 Limited processing capacity in Eastern and Southern European regions
- 4.4 Value / Supply-Chain Analysis
- 4.5 Regulatory Landscape
- 4.6 Technological Outlook
- 4.6.1 RFID Smart Bins for Waste Tracking
- 4.6.2 AI Revolutionizes Waste Sorting
- 4.6.3 IoT Optimizing for Fleet Routes
- 4.7 Industry Attractiveness - Porter's Five Forces
- 4.7.1 Threat of New Entrants
- 4.7.2 Bargaining Power of Suppliers
- 4.7.3 Bargaining Power of Buyers
- 4.7.4 Threat of Substitutes
- 4.7.5 Industry Rivalry
- 4.8 Fleet Modernization & Electrification in Waste Collection
- 4.9 Analysis of Biomethane Impact on Organic Waste Collection
- 4.10 Collaboration between municipalities and private operators gaining traction
- 4.11 Growing focus on methane capture from organic waste to meet climate targets
5 Market Size & Growth Forecasts (Value in USD Billion)
- 5.1 By Waste Type
- 5.1.1 Food Waste (Pre and Post Consumer)
- 5.1.2 Yard & Landscape Waste
- 5.1.3 Agricultural Residues
- 5.1.4 Others
- 5.2 By End-User
- 5.2.1 Residential
- 5.2.2 Commercial (HoReCa, Retail)
- 5.2.3 Industrial (Food Processing & Manufacturing)
- 5.2.4 Others (Agri-waste)
- 5.3 By Collection Method
- 5.3.1 Door-to-Door Collection
- 5.3.2 Drop-Off / Bring Systems
- 5.3.3 Others
- 5.4 By Technology & Equipment
- 5.4.1 Manual Collection Systems
- 5.4.2 Semi-Automated Systems
- 5.4.3 Fully Automated Systems
- 5.4.4 Others
- 5.5 By Geography
- 5.5.1 United Kingdom
- 5.5.2 Germany
- 5.5.3 France
- 5.5.4 Italy
- 5.5.5 Spain
- 5.5.6 Russia
- 5.5.7 Rest of Europe
6 Competitive Landscape
- 6.1 Market Concentration
- 6.2 Strategic Moves
- 6.3 Market Share Analysis
- 6.4 Company Profiles {(includes Global level Overview, Market level overview, Core Segments, Financials as available, Strategic Information, Products & Services, and Recent Developments)}
- 6.4.1 AEB Amsterdam
- 6.4.2 Afvalzorg
- 6.4.3 ALBA Group
- 6.4.4 Attero
- 6.4.5 Avalex
- 6.4.6 AVEA GmbH & Co. KG
- 6.4.7 Bartscherer & Co. Recycling GmbH
- 6.4.8 Berliner Stadtreinigungsbetriebe AoR
- 6.4.9 Biorepack Consortium
- 6.4.10 Blue Wings Composting
- 6.4.11 Circulus Agtech
- 6.4.12 Contarina S.p.A.
- 6.4.13 FCC Environment
- 6.4.14 Geocycle GmbH
- 6.4.15 GP Groot
- 6.4.16 Gruppo Hera
- 6.4.17 GS-Recycling Nederland
- 6.4.18 Herambiente
- 6.4.19 Indaver
- 6.4.20 Interzero Holding
7 Market Opportunities & Future Outlook
- 7.1 Smart Cities & IoT Integration
- 7.2 Producer Responsibility Expansion
- 7.3 Shift Toward Decentralized Organic Waste Processing

 全球食品廢棄物管理市場規模、佔有率、趨勢和成長分析報告(2026-2034年)
 2026-2030年全球升級再造材料市場
 北美有機廢棄物收集服務:市場佔有率分析、行業趨勢和統計數據以及成長預測(2026-2031 年)
 升級再造食品配料市場:預測至2034年-按配料類型、來源、應用、分銷管道、最終用戶和地區分類的全球分析升級再造食品配料市場:預測至2034年-按配料類型、功能、分銷管道、應用、最終用戶和地區分類的全球分析
 食品廢棄物管理市場:2026-2032年全球市場預測(依處理技術、來源、服務模式、產品/服務、廢棄物類型和應用分類)
 2026-2030年全球食品廢棄物管理市場德國有機廢棄物收集服務:市場佔有率分析、產業趨勢與統計及成長預測(2026-2031 年)美國有機廢棄物收集服務:市場佔有率分析、行業趨勢和統計數據以及成長預測(2026-2031 年)義大利有機廢棄物收集服務:市場佔有率分析、行業趨勢和統計數據以及成長預測(2026-2031 年)