


 |
市場調查報告書
商品編碼
1852018
菲律賓貨運與物流:市場佔有率分析、行業趨勢、統計數據和成長預測(2025-2030 年)Philippines Freight And Logistics - Market Share Analysis, Industry Trends & Statistics, Growth Forecasts (2025 - 2030) |
||||||
※ 本網頁內容可能與最新版本有所差異。詳細情況請與我們聯繫。
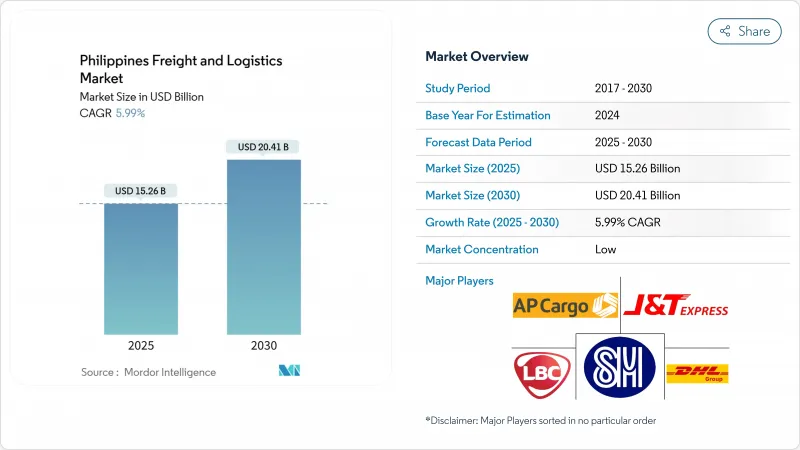
預計到 2025 年,菲律賓的貨物和物流市場規模將成長至 152.6 億美元,到 2030 年將成長至 204.1 億美元,複合年成長率為 5.99%(2025-2030 年)。
菲律賓政府斥資8.8兆比索(約1,581.9億美元)的「建設、完善、更多」計畫、外資所有權自由化以及不斷成長的電子商務需求,正在推動這一擴張。儘管公路貨運仍然是該網路的主力軍,但港口自動化和航空貨運的升級正在重塑運輸方式的選擇。外國投資者正透過合資企業進入市場,這些合資企業將全球專業知識與本地資源結合,加速了倉儲、貨運和最後一公里配送領域的技術應用。政府主導的數位化互聯互通政策,包括世界銀行提供的7.5億美元貸款,正在完善實體基礎設施,並使小型企業能夠採用平台經營模式。
菲律賓貨運及物流市場趨勢及洞察
透過「建設、完善、更多」基礎建設計劃提高公路和港口吞吐能力
耗資8.8兆菲律賓比索(約1581.9億美元)的旗艦管道項目已完成11,945公里的道路計劃,另有15,769公里正在建設中,這將使呂宋島的通行時間縮短高達50%,並將八打雁、馬尼拉、克拉克和蘇比克灣連接成一條統一的走廊。道路、港口和鐵路的協調升級可望縮短運輸時間,最佳化供應鏈調度,並提高卡車周轉率。投資者正在加快在新高速公路附近建造物流樞紐,以確保先發優勢。合約物流供應商正在根據高速公路地圖設計其網路,以減少回程空駛里程。隨著多式聯運節點的出現,整合公路運輸和沿海航運的營運商比單一運輸方式的競爭對手更具成本優勢。
港口現代化和自動化公私合作項目(例如MICT)旨在縮短船舶週轉時間
馬尼拉國際貨櫃碼頭 (MICT) 安裝了 N4 3.4 作業系統,並投入 150 億菲律賓比索(約 2.6964 億美元)進行堆場維修,泊位等待時間縮短了 35%,馬尼拉 2023 年的吞吐能力提升至 506 萬標準箱。更快的清關速度降低了卸貨費用,並減少了托運人的庫存緩衝。貨運代理商正在將即時港口數據整合到其訂艙工具中,使出口商能夠選擇擁塞程度最低的航線。設備自動化也使最後一公里運輸車隊受益,延長了閘口開放時間,支援隔夜短途運輸,並緩解了白天的交通堵塞,從而幫助車隊滿足緊迫的交貨期限。
鐵路貨運網不發達限制了多式聯運效率
儘管交通運輸預算高達披索億菲律賓比索(約24.3億美元),但貨運鐵路所佔比例仍微乎其微,2024年僅有11.7億披索(約2,103萬美元)的預算用於鐵路運輸。重工業由於不得不將大宗貨物運輸轉移到卡車,因此失去了規模經濟效益。世界銀行指出,菲律賓的物流成本比周邊國家高出20%至30%。一些私營財團正在評估連接經濟區和港口的專用貨運鐵路線路,但土地徵用仍是一大障礙。一旦鐵路走廊開始建設,那些嘗試建造公路鐵路聯運貨櫃走廊的業者可能會獲得先發優勢。
細分市場分析
2024年,批發和零售貿易將佔銷售額的30.79%,預計2025年至2030年將以6.59%的複合年成長率成長。製造業的成長主要由半導體後端加工廠、個人護理用品製造以及依賴穩定原料供應的飲料生產線擴張所驅動。建設業吸收了基礎建設的需求,從而推動了對粗骨材、鋼鐵和水泥的需求。隨著低溫運輸升級延長保存期限並提高農民收益,農業、漁業和林業預計將實現成長。
零售商和工廠都要求即時庫存簡介和協調補貨,物流合作夥伴引入物聯網感測器和API閘道器。馬士基在「創造更多」稅收優惠政策下對履約的投資表明,一體化的海運到倉儲服務正日益受到跨國製造商的青睞。石油天然氣和採礦業需要專業的巨型鑽機和危險品運輸合規性,而快速成長的「其他」頻寬,如醫療保健、教育和逆向物流,為菲律賓貨物和物流市場中擅長高價值、高服務細分領域的營運商創造了機會。
至2024年,貨運代理業務將佔總收入的63.34%,凸顯其作為菲律賓貨物和物流市場支柱的地位。卡車運輸、沿海航運、空運和管道運輸支撐著菲律賓7,600多個島嶼的供應鏈的持續運作。儘管目前由於社群電商經銷商和電商巨頭承諾提供全國隔日宅配,快遞、速遞和小包裹(CEP)產業正在萎縮,但預計2025年至2030年間,該產業仍將維持6.89%的複合年成長率。倉儲和貨運代理產業是連接上游生產和下游零售的關鍵環節。
中央包裹運輸 (CEP) 領域的蓬勃發展正在重塑競爭格局。純小包裹公司正在整合數位錢包,而傳統的第三方物流 (3PL) 公司則採用群眾外包雷射雷達模型來捍衛市場佔有率。倉庫正在部署機器人並建造多溫區,以吸引製藥和農業企業進入。貨運代理商正在利用港口自動化和海外合作關係,將報關服務與套件組裝和逆向物流等附加價值服務捆綁在一起。總而言之,這些轉變表明,菲律賓貨運和物流市場生態系統正朝著端到端編配的方向發展,而非各自為政的執行模式。
其他福利:
- Excel格式的市場預測(ME)表
- 3個月的分析師支持
目錄
第1章 引言
- 研究假設和市場定義
- 調查範圍
第2章調查方法
第3章執行摘要
第4章 市場情勢
- 市場概覽
- 人口統計數據
- 按經濟活動分類的GDP分配
- 按經濟活動分類的GDP成長
- 通貨膨脹
- 經濟表現及概況
- 電子商務產業趨勢
- 製造業趨勢
- 運輸和倉儲業GDP
- 出口趨勢
- 進口趨勢
- 燃油價格
- 物流績效
- 模態共享
- 票價趨勢
- 貨物噸位趨勢
- 基礎設施
- 法律規範(公路和鐵路)
- 法律規範(海事和航空)
- 價值鍊和通路分析
- 市場促進因素
- 透過「大建特建2」基礎建設計畫提高公路和港口吞吐能力
- 擴大漁業及農產品出口的低溫運輸能力
- 透過港口現代化和自動化公私合作項目(例如,MICT)縮短船舶週轉時間
- 放寬外資所有權限制(修訂《公共服務法》)及吸引外商直接投資進入第三方物流業
- 在呂宋島大都會區蓬勃發展的B2C電子商務領域,可提供隔日送達服務。
- 製造業的成長推動了對工業物流的需求
- 市場限制
- 鐵路貨運網不發達阻礙了多式聯運的效率
- 馬尼拉大都會區嚴重的道路壅塞推高了最後一公里運輸成本。
- 這是一個分散的行業,以中小企業為主,數位化較低。
- 颱風和地震高風險導致供應鏈中斷
- 市場創新
- 波特五力分析
- 買方的議價能力
- 供應商的議價能力
- 新進入者的威脅
- 替代品的威脅
- 競爭對手之間的競爭
第5章 市場規模與成長預測
- 終端用戶產業
- 農業、漁業、林業
- 建造
- 製造業
- 石油天然氣、採礦和採石
- 批發和零售
- 其他
- 物流職能
- 快遞、速遞和小包裹(CEP)
- 目的地
- 國內的
- 國際的
- 貨運代理
- 透過交通方式
- 航空
- 海運和內河航運
- 其他
- 貨物運輸
- 透過交通方式
- 航空
- 管道
- 路
- 海運和內河航運
- 倉儲
- 透過溫度控制
- 無溫度控制
- 溫度控制
- 其他服務
- 快遞、速遞和小包裹(CEP)
第6章 競爭情勢
- 市場集中度
- 關鍵策略舉措
- 市佔率分析
- 公司簡介
- AP Moller-Maersk
- AAI Worldwide Logistics
- AP Cargo
- Ayala Corporation(Including Airfreight 2100, Inc.)
- CMA CGM Group(Including CEVA Logistics)
- DHL Group
- DSV A/S(Including DB Schenker)
- Fast Logistics
- FedEx
- J&T Express(Including PH Global Jet Express, Inc.)
- JRS Business Corporation
- Kuehne+Nagel
- LBC Express Holdings, Inc.
- LF Global Logistics Solutions, Inc.
- Mitsui OSK Lines, Ltd.
- Ninja Van Group(Including Ninja Van Philippines)
- NYK(Nippon Yusen Kaisha)Line
- Orient Freight
- Royal Cargo
- SM Investments Corporation(Including 2GO Group, Inc.)
- United Parcel Service of America, Inc.(UPS)
第7章 市場機會與未來展望
The Philippines freight and logistics market size stands at USD 15.26 billion in 2025 and is projected to advance to USD 20.41 billion by 2030, reflecting a 5.99% CAGR (2025-2030).
The expansion gains momentum from the PHP 8.8 trillion (USD 158.19 billion) "Build, Better, More" program, liberalized foreign-ownership rules, and increased e-commerce demand. Road freight remains the backbone of the network, yet port automation and air-cargo upgrades are reshaping modal decisions. Foreign investors are entering through joint ventures that pair global expertise with local reach, accelerating technology adoption across warehousing, freight forwarding, and last-mile delivery. Government-led digital connectivity policies, including a USD 750 million World Bank loan, complement physical infrastructure and allow smaller operators to adopt platform business models.
Philippines Freight And Logistics Market Trends and Insights
Infrastructure "Build, Better, More" Program Boosting Road and Port Capacity
The PHP 8.8 trillion (USD 158.19 billion) flagship pipeline has completed 11,945 km of road projects and is constructing 15,769 km more, slashing Luzon travel times by up to 50% and linking Batangas, Manila, Clark, and Subic into a unified corridor. Harmonized road, port, and rail upgrades promise lower transit times, tighter supply-chain scheduling, and higher truck turns. Investors are fast-tracking distribution hubs near the new expressways to secure first-mover advantages. Contract logistics providers are aligning network designs with the expressway map to cut empty back-haul miles. As multimodal nodes emerge, operators that integrate trucking with coastal shipping gain cost leverage over single-mode rivals.
Port Modernization and Automation PPPs (e.g., MICT) Cutting Vessel Turn-Around Time
Manila International Container Terminal (MICT) applied an N4 3.4 operating system and yard upgrades worth PHP 15 billion (USD 269.64 million), slicing berth time by 35% and raising Manila's 2023 throughput to 5.06 million TEUs. Quicker clearances reduce demurrage penalties and lower inventory buffers for shippers. Forwarders embed real-time port data in booking tools, letting exporters choose sailings with minimal congestion. Equipment automation unlocks longer gate hours, which supports night-time drayage and eases daytime traffic, benefiting last-mile fleets working tight delivery windows.
Under-Developed Rail Freight Network Limiting Multimodal Efficiency
Freight rail remains negligible despite a PHP 135.4 billion (USD 2.43 billion) transport budget, of which only PHP 1.17 billion (USD 21.03 million) targets rail transport in 2024. Heavy industries lose scale benefits when bulk cargo must shift to trucks. Logistics costs run 20-30% higher than regional peers, the World Bank notes. Private consortia are evaluating dedicated cargo spurs between economic zones and ports, but land-acquisition hurdles persist. Operators experimenting with road-rail containers position themselves for first-mover gains once corridors break ground.
Other drivers and restraints analyzed in the detailed report include:
- Foreign-Ownership Liberalization Attracting FDI in 3PLs
- Surging B2C E-Commerce Requiring Same-/Next-Day Logistics Across Luzon Urban Corridors
- Severe Road Congestion in Metro Manila Inflating Last-Mile Costs
For complete list of drivers and restraints, kindly check the Table Of Contents.
Segment Analysis
Wholesale and retail trade represented 30.79% of 2024 revenue with a projected CAGR (2025-2030) of 6.59%, mirroring the nation's consumption-driven economy. Manufacturing is linked to the expansion of semiconductor back-end plants, personal-care production, and beverage lines that depend on predictable inbound raw-material streams. Construction absorbed the infrastructure push, buoyed demand for bulk aggregates, steel, and cement. Agriculture, fishing, and forestry are expected to grow with cold chain upgrades, facilitating longer shelf life and better farm-gate revenue.
Retailers and factories alike now seek real-time inventory snapshots and coordinated replenishment, prompting logistics partners to embed IoT sensors and API gateways. Maersk's fulfilment-center investments under CREATE MORE tax incentives illustrate how integrated ocean-to-warehouse services resonate with multinational manufacturers. Oil, gas, and mining require specialized heavy-haul rigs and hazardous-cargo compliance, while the fast-growing "others" band, healthcare, education, and reverse logistics, creates opportunities for operators proficient in high-value, high-service niches within the Philippines freight and logistics market.
Freight transport generated 63.34% of the 2024 total revenue, underscoring its role as the backbone of the Philippines freight and logistics market. Trucking, coastal shipping, air cargo, and pipelines underpin national supply-chain continuity across more than 7,600 islands. Courier, Express, and Parcel (CEP) segment, though a smaller slice today, is clocking a 6.89% CAGR between 2025-2030 as social-commerce sellers and marketplace giants promise next-day delivery nationwide. The warehousing and storage segment and freight forwarding form critical links that synchronize upstream production with downstream retail intake.
Momentum inside CEP is redrawing competitive boundaries: pure-play parcel firms are integrating digital wallets, while traditional 3PLs adopt crowdsourced rider models to protect share. Warehouse operators deploy robotics and construct multi-temperature zones to attract pharmaceutical and agrifood tenants. Forwarders leverage port automation and foreign-capital partnerships to bundle customs brokerage with value-added services such as kitting and reverse logistics. Collectively, these shifts confirm an ecosystem moving toward end-to-end orchestration rather than siloed execution in the Philippines freight and logistics market.
The Philippines Freight and Logistics Market Report is Segmented by End User Industry (Agriculture, Fishing, and Forestry, Construction, Manufacturing, Oil and Gas, Mining and Quarrying, Wholesale and Retail Trade, and More) and by Logistics Function (Courier, Express, and Parcel (CEP), Freight Forwarding, Freight Transport, Warehousing and Storage, and Other Services). The Market Forecasts are Provided in Terms of Value (USD).
List of Companies Covered in this Report:
- A.P. Moller - Maersk
- AAI Worldwide Logistics
- AP Cargo
- Ayala Corporation (Including Airfreight 2100, Inc.)
- CMA CGM Group (Including CEVA Logistics)
- DHL Group
- DSV A/S (Including DB Schenker)
- Fast Logistics
- FedEx
- J&T Express (Including PH Global Jet Express, Inc.)
- JRS Business Corporation
- Kuehne+Nagel
- LBC Express Holdings, Inc.
- LF Global Logistics Solutions, Inc.
- Mitsui O.S.K. Lines, Ltd.
- Ninja Van Group (Including Ninja Van Philippines)
- NYK (Nippon Yusen Kaisha) Line
- Orient Freight
- Royal Cargo
- SM Investments Corporation (Including 2GO Group, Inc.)
- United Parcel Service of America, Inc. (UPS)
Additional Benefits:
- The market estimate (ME) sheet in Excel format
- 3 months of analyst support
TABLE OF CONTENTS
1 Introduction
- 1.1 Study Assumptions and Market Definition
- 1.2 Scope of the Study
2 Research Methodology
3 Executive Summary
4 Market Landscape
- 4.1 Market Overview
- 4.2 Demographics
- 4.3 GDP Distribution by Economic Activity
- 4.4 GDP Growth by Economic Activity
- 4.5 Inflation
- 4.6 Economic Performance and Profile
- 4.6.1 Trends in E-Commerce Industry
- 4.6.2 Trends in Manufacturing Industry
- 4.7 Transport and Storage Sector GDP
- 4.8 Export Trends
- 4.9 Import Trends
- 4.10 Fuel Price
- 4.11 Logistics Performance
- 4.12 Modal Share
- 4.13 Freight Pricing Trends
- 4.14 Freight Tonnage Trends
- 4.15 Infrastructure
- 4.16 Regulatory Framework (Road and Rail)
- 4.17 Regulatory Framework (Sea and Air)
- 4.18 Value Chain and Distribution Channel Analysis
- 4.19 Market Drivers
- 4.19.1 Infrastructure "Build Build Build 2" Program Boosting Road and Port Capacity
- 4.19.2 Expansion of Cold-Chain Capacity for Fisheries and Agrifood Exports
- 4.19.3 Port Modernization and Automation PPPs (e.g., MICT) Cutting Vessel Turn-Around Time
- 4.19.4 Foreign-Ownership Liberalization (Public Service Act Amendments) Attracting FDI in 3PLs
- 4.19.5 Surging B2C E-commerce Requiring Same-/Next-Day Logistics Across Luzon Urban Corridors
- 4.19.6 Growing Manufacturing Sector Driving Industrial Logistics Demand
- 4.20 Market Restraints
- 4.20.1 Under-developed Rail Freight Network Limiting Multimodal Efficiency
- 4.20.2 Severe Road Congestion in Metro Manila Inflating Last-Mile Costs
- 4.20.3 Fragmented SME-Dominated Sector with Low Digitalization
- 4.20.4 High Typhoon and Seismic Risk Disrupting Supply Chains
- 4.21 Technology Innovations in the Market
- 4.22 Porter's Five Forces Analysis
- 4.22.1 Bargaining Power of Buyers
- 4.22.2 Bargaining Power of Suppliers
- 4.22.3 Threat of New Entrants
- 4.22.4 Threat of Substitutes
- 4.22.5 Competitive Rivalry
5 Market Size and Growth Forecasts (Value, USD)
- 5.1 End User Industry
- 5.1.1 Agriculture, Fishing, and Forestry
- 5.1.2 Construction
- 5.1.3 Manufacturing
- 5.1.4 Oil and Gas, Mining and Quarrying
- 5.1.5 Wholesale and Retail Trade
- 5.1.6 Others
- 5.2 Logistics Function
- 5.2.1 Courier, Express, and Parcel (CEP)
- 5.2.1.1 By Destination Type
- 5.2.1.1.1 Domestic
- 5.2.1.1.2 International
- 5.2.2 Freight Forwarding
- 5.2.2.1 By Mode of Transport
- 5.2.2.1.1 Air
- 5.2.2.1.2 Sea and Inland Waterways
- 5.2.2.1.3 Others
- 5.2.3 Freight Transport
- 5.2.3.1 By Mode of Transport
- 5.2.3.1.1 Air
- 5.2.3.1.2 Pipelines
- 5.2.3.1.3 Road
- 5.2.3.1.4 Sea and Inland Waterways
- 5.2.4 Warehousing and Storage
- 5.2.4.1 By Temperature Control
- 5.2.4.1.1 Non-Temperature Controlled
- 5.2.4.1.2 Temperature Controlled
- 5.2.5 Other Services
- 5.2.1 Courier, Express, and Parcel (CEP)
6 Competitive Landscape
- 6.1 Market Concentration
- 6.2 Key Strategic Moves
- 6.3 Market Share Analysis
- 6.4 Company Profiles (Includes Global Level Overview, Market Level Overview, Core Segments, Financials as Available, Strategic Information, Market Rank/Share for Key Companies, Products and Services, and Recent Developments)
- 6.4.1 A.P. Moller - Maersk
- 6.4.2 AAI Worldwide Logistics
- 6.4.3 AP Cargo
- 6.4.4 Ayala Corporation (Including Airfreight 2100, Inc.)
- 6.4.5 CMA CGM Group (Including CEVA Logistics)
- 6.4.6 DHL Group
- 6.4.7 DSV A/S (Including DB Schenker)
- 6.4.8 Fast Logistics
- 6.4.9 FedEx
- 6.4.10 J&T Express (Including PH Global Jet Express, Inc.)
- 6.4.11 JRS Business Corporation
- 6.4.12 Kuehne+Nagel
- 6.4.13 LBC Express Holdings, Inc.
- 6.4.14 LF Global Logistics Solutions, Inc.
- 6.4.15 Mitsui O.S.K. Lines, Ltd.
- 6.4.16 Ninja Van Group (Including Ninja Van Philippines)
- 6.4.17 NYK (Nippon Yusen Kaisha) Line
- 6.4.18 Orient Freight
- 6.4.19 Royal Cargo
- 6.4.20 SM Investments Corporation (Including 2GO Group, Inc.)
- 6.4.21 United Parcel Service of America, Inc. (UPS)
7 Market Opportunities and Future Outlook
- 7.1 White-Space and Unmet-Need Assessment
 貨運和物流市場規模、佔有率和成長分析(按運輸方式、服務、最終用戶和地區分類)-2025-2032年產業預測
 中東歐貨運與物流:市場佔有率分析、產業趨勢、統計數據與成長預測(2025-2030 年)新加坡貨運與物流:市場佔有率分析、行業趨勢、統計數據和成長預測(2025-2030 年)
 全球貨物審核與結算市場預測(2025-2030)
 2032 年碳中和解決方案市場預測:按類型、組件、部署模式、組織規模、技術、最終用戶和地區進行的全球分析
 2025年貨運和物流全球市場報告
 貨運審核與結算市場規模、佔有率及成長分析(依公司規模、最終用戶、應用及地區)-2025 年至 2032 年產業預測
 2034 年貨運與物流市場分析與預測:類型、產品、服務、技術、組件、應用、流程、模式、最終用戶2025年全球貨運車輛市場報告中國貨運與物流-市場佔有率分析、產業趨勢與統計、成長預測(2025-2030)