


 |
市場調查報告書
商品編碼
1852047
新加坡貨運與物流:市場佔有率分析、行業趨勢、統計數據和成長預測(2025-2030 年)Singapore Freight And Logistics - Market Share Analysis, Industry Trends & Statistics, Growth Forecasts (2025 - 2030) |
||||||
※ 本網頁內容可能與最新版本有所差異。詳細情況請與我們聯繫。
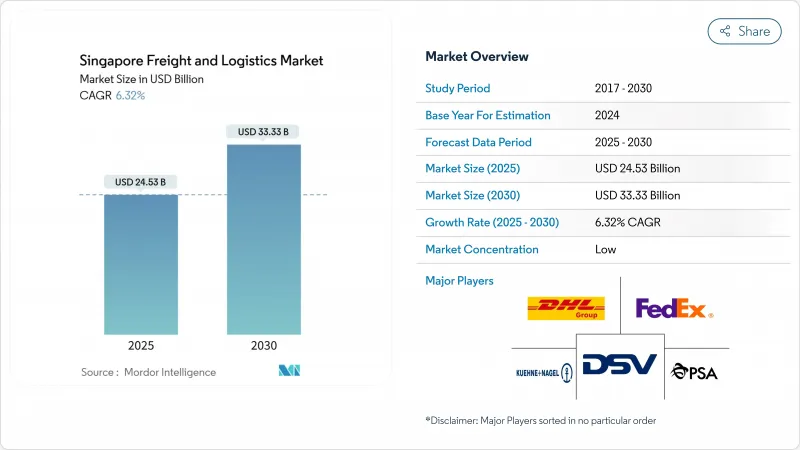
預計新加坡貨運和物流市場規模將在 2025 年達到 245.3 億美元,在 2030 年達到 333.3 億美元,同期複合年成長率為 6.32%。
這項發展勢頭得益於新加坡港務集團(PSA)旗下碼頭的強勁吞吐量、樟宜機場規劃貨運能力提升50%以及對數位化應用的持續政策支持。低溫運輸計劃、5G賦能的港口營運以及遠距直達貨運航線正推動新加坡的貨運和物流市場向高價值、時效性要求更高的貨運模式轉型。由於馬來西亞擁有全自動化的堆場設施和近乎即時的清關流程,越來越多的製造商將部分生產從中國轉移到東協,並透過馬來西亞運輸高科技和醫藥產品。儘管與馬來西亞港口的競爭日益激烈,但新加坡在可靠性、可視性和多式聯運速度方面的優勢彌補了其成本劣勢。
新加坡貨運及物流市場趨勢及洞察
大士港擴容改變了區域貨櫃流動格局
第一期工程將於2022年運作,到2024年總吞吐能力將提升至4,000萬標準箱,同時自動化起重機和自動駕駛車輛將使泊位時間縮短25%。這項耗資200億新加坡元(約151.5億美元)的建設項目最終將使吞吐能力提升至6,500萬標準箱,使新加坡的貨運和物流市場領先成本較低的馬來西亞市場。
數位化計畫 2.0 加速低溫運輸和自動化投資
政府的共同資助將推動動物聯網感測器、區塊鏈溯源和機器人揀選技術的發展。 DHL投資5億歐元(約5億5,182億美元)的醫藥中心將整合8,200平方公尺的即時溫控系統,展現數位化如何應用於高階生命科學流程。
工業用地成本上漲給營運商盈利帶來壓力。
預計到2024年,裕廊集團(JTC)的平均租金將達到每平方公尺每月16-45新加坡元(12.12-34.08美元),這將擠壓中小型貨運公司的生存空間。許多公司正將部分倉庫遷至柔佛州,同時保留新加坡用於快遞業務。大型業者則利用自動化技術提高空間利用率,以抵銷租金上漲的影響,並維持其在新加坡貨運和物流市場的地位。
細分市場分析
到了2024年,批發和零售貿易將佔銷售額的30.82%,這反映了新加坡作為分銷中心的悠久歷史。由醫藥和航太驅動的市場區隔將以6.83%的複合年成長率(CAGR)在2025年至2030年間超越其他細分領域,而對低溫運輸和時效性服務的需求成長將推動新加坡貨運和物流市場的發展。
由於東協基礎設施發展,建築物流依然蓬勃發展;農業、漁業和林業的流通依賴新加坡嚴格的食品安全制度;石油和天然氣的交易量也很強勁,這得益於新加坡作為燃料庫中心的地位。
到2024年,貨運收入將佔新加坡總收入的61.33%,鞏固其作為新加坡貨運和物流市場核心的地位。海運和內河航運將顯著提升該領域的收入,而航空貨運在2025年至2030年間的複合年成長率將達到7.13%,主要得益於半導體和疫苗的運輸需求。 2024年,公路貨運量達1.3027億噸,但仍受土地短缺的限制。管道運輸是一個穩定但已趨於成熟的細分領域,運輸石化產品達9736萬噸。
隨著跨境電商對東協地區隔日達的需求日益成長,宅配、速遞和小包裹(CEP)業務正加速發展,2025年至2030年間的複合年成長率(CAGR)將達到7.27%。倉儲業收入保持穩定,但溫控倉儲空間的成長速度是常溫倉儲的兩倍。特別是空運貨運,受惠於新加坡與美國之間的直航貨運航班,前置作業時間縮短了一整天。這些變化標誌著新加坡的貨運和物流市場正從純粹的轉運模式轉向一體化的數位化供應鏈平台。
其他福利:
- Excel格式的市場預測(ME)表
- 3個月的分析師支持
目錄
第1章 引言
- 研究假設和市場定義
- 調查範圍
第2章調查方法
第3章執行摘要
第4章 市場情勢
- 市場概覽
- 人口統計數據
- 按經濟活動分類的GDP分配
- 按經濟活動分類的GDP成長
- 通貨膨脹
- 經濟表現及概況
- 電子商務產業的趨勢
- 製造業趨勢
- 運輸和倉儲部門的GDP
- 出口趨勢
- 進口趨勢
- 燃油價格
- 物流績效
- 模態共享
- 貨運趨勢
- 貨物噸位趨勢
- 基礎設施
- 法律規範(公路和鐵路)
- 法律規範(海事和航空)
- 價值鍊和通路分析
- 市場促進因素
- 新加坡大士港擴容將提升新加坡整體海運貨運量。
- 物流產業數位化規劃2.0推動自動化與低溫運輸投資
- 製藥和航太的MRO(維護、維修和大修)生產激增,推動了對時間要求嚴格的溫控服務的需求。
- 將供應鏈從以中國為中心的模式多元化,推動新加坡成為替代樞紐。
- 99%的清關手續在10分鐘內完成,使轉運更具吸引力。
- 樟宜酵母(T5)擴建工程將機場航空貨運能力提升至450萬噸。
- 市場限制
- 工業用地和倉庫租金上漲正在擠壓企業的淨利率。
- 更嚴格的外籍勞工配額和勞動力老化導致的人手不足正在阻礙經濟成長。
- 儘管該國國土面積遼闊,但國內公路貨運能力有限。
- 巴生港和丹戎帕拉帕斯港之間的轉運流量競爭加劇
- 市場創新
- 波特五力分析
- 新進入者的威脅
- 供應商的議價能力
- 買方的議價能力
- 替代品的威脅
- 競爭對手之間的競爭
第5章 市場規模與成長預測
- 終端用戶產業
- 農業、漁業、林業
- 建造
- 製造業
- 石油天然氣、採礦和採石
- 批發和零售
- 其他
- 物流職能
- 快遞、速遞和小包裹(CEP)
- 目的地類型
- 國內的
- 國際的
- 貨運代理
- 透過交通方式
- 航空
- 海運和內河航運
- 其他
- 貨物運輸
- 透過交通方式
- 航空
- 管道
- 路
- 海運和內河航運
- 倉儲
- 透過溫度控制
- 無溫度控制
- 溫度控制
- 其他服務
- 快遞、速遞和小包裹(CEP)
第6章 競爭情勢
- 關鍵策略舉措
- 市佔率分析
- 公司簡介
- AP Moller-Maersk
- CJ Logistics Corporation
- CMA CGM Group(Including CEVA Logistics)
- CWT Pte, Ltd.
- DHL Group
- DSV A/S(Including DB Schenker)
- FedEx
- GEODIS(Including Keppel Logistics Pte Ltd.)
- Kuehne+Nagel
- Nippon Express Holdings, Inc.
- Pacific International Lines Pte, Ltd.
- Poh Tiong Choon Logistics, Ltd
- PSA International
- SATS, Ltd.
- SF Express(KEX-SF)
- Singapore Post, Ltd.
- ST Logistics Pte, Ltd.
- United Parcel Service of America, Inc.(UPS)
- Vibrant Group, Ltd.
- Yamato Holdings Co., Ltd.
- YCH Group
第7章 市場機會與未來展望
The Singapore freight and logistics market size is valued at USD 24.53 billion in 2025 and is forecast to reach USD 33.33 billion by 2030, reflecting a 6.32% CAGR through the period.
Robust throughput at PSA's terminals, a 50% uplift in Changi's planned cargo capacity, and steady policy support for digital adoption anchor this momentum. Cold-chain projects, 5G-enabled port operations, and direct long-haul freighter lanes are steering the Singapore freight and logistics market toward higher-value, time-critical flows. Manufacturers relocating some production from China to ASEAN now route an increasing share of high-tech and pharmaceutical cargo through the city-state, drawn by fully automated yard equipment and near-instant customs clearance. Competition from Malaysian ports is heightening, yet Singapore offsets cost disadvantages with superior reliability, visibility, and multimodal speed.
Singapore Freight And Logistics Market Trends and Insights
Tuas Mega-Port Capacity Expansion Transforms Regional Container Flows
Phase 1 went live in 2022 and pushed aggregate throughput past 40 million TEUs in 2024, while automated cranes and autonomous vehicles cut berth times by 25%. The SGD 20 billion (USD 15.15 billion) build-out ultimately elevates capacity to 65 million TEUs, ensuring the Singapore freight and logistics market stays ahead of lower-cost Malaysian alternatives.
Digital Plan 2.0 Accelerates Cold-Chain and Automation Investments
Government co-funding drives IoT sensors, blockchain tracing, and robotic picking. DHL's EUR 500 million (USD 551.82 million) pharma hub integrates real-time temperature control across 8,200 m2, illustrating how digitization captures premium life-science flows.
Industrial Land Cost Inflation Pressures Operator Profitability
Average JTC rentals reached SGD 16-45 (USD 12.12- 34.08) per m2 per month in 2024, squeezing smaller forwarders. Many relocate overflow storage to Johor while retaining Singapore for high-velocity cargo. Larger operators leverage automation to lift space productivity and offset rent hikes, sustaining presence in the Singapore freight and logistics market.
Other drivers and restraints analyzed in the detailed report include:
- Pharmaceutical and Aerospace MRO Output Drives Specialized Logistics Demand
- Customs Efficiency Enhancement Strengthens Transshipment Competitiveness
- Foreign Worker Policy Tightening Constrains Capacity Expansion
For complete list of drivers and restraints, kindly check the Table Of Contents.
Segment Analysis
Wholesale and retail trade represented 30.82% of 2024 turnover, a testament to Singapore's heritage as a distribution entrepot. Manufacturing, led by pharmaceuticals and aerospace, will outpace all other segments at 6.83% CAGR between 2025-2030, shifting focus toward validated cold-chain, time-critical services and boosting the Singapore freight and logistics market.
Construction logistics stays buoyant on ASEAN infrastructure builds, while agriculture, fishing, and forestry flows rely on Singapore's stringent food-safety regime. Oil and gas volumes are steady, benefiting from the city-state's role as a bunkering hub.
Freight transport generated 61.33% of 2024 revenue, cementing its place at the core of the Singapore freight and logistics market. Sea and inland waterways lifted significant segment revenue, while air freight booked a 7.13% CAGR between 2025-2030, thanks to semiconductor and vaccine movements. Road freight handled 130.27 million tons in 2024 but remains constrained by land scarcity. Pipelines moved 97.36 million tons of petrochemicals, a steady yet mature niche.
Courier, Express, and Parcel (CEP) is gathering speed, advancing 7.27% CAGR (2025-2030) as cross-border e-commerce demands next-day transit across ASEAN. Warehousing revenues stay resilient, but temperature-controlled space is growing twice as fast as ambient sheds. Freight forwarding thrives on customs speed; air forwarding in particular, benefits from direct Singapore-US freighter links that cut lead times by one full day. Together, these shifts illustrate how the Singapore freight and logistics market is evolving from pure transshipment to an integrated digital supply-chain platform.
The Singapore Freight and Logistics Market Report is Segmented by End User Industry (Agriculture, Fishing, and Forestry, Construction, Manufacturing, Wholesale and Retail Trade, Oil and Gas, Mining and Quarrying, and Others), and by Logistics Function (Courier, Express, and Parcel (CEP), Freight Forwarding, Freight Transport, Warehousing and Storage, and Other Services). The Market Forecasts are Provided in Terms of Value (USD).
List of Companies Covered in this Report:
- A.P. Moller - Maersk
- CJ Logistics Corporation
- CMA CGM Group (Including CEVA Logistics)
- CWT Pte, Ltd.
- DHL Group
- DSV A/S (Including DB Schenker)
- FedEx
- GEODIS (Including Keppel Logistics Pte Ltd.)
- Kuehne+Nagel
- Nippon Express Holdings, Inc.
- Pacific International Lines Pte, Ltd.
- Poh Tiong Choon Logistics, Ltd
- PSA International
- SATS, Ltd.
- SF Express (KEX-SF)
- Singapore Post, Ltd.
- ST Logistics Pte, Ltd.
- United Parcel Service of America, Inc. (UPS)
- Vibrant Group, Ltd.
- Yamato Holdings Co., Ltd.
- YCH Group
Additional Benefits:
- The market estimate (ME) sheet in Excel format
- 3 months of analyst support
TABLE OF CONTENTS
1 Introduction
- 1.1 Study Assumptions and Market Definition
- 1.2 Scope of the Study
2 Research Methodology
3 Executive Summary
4 Market Landscape
- 4.1 Market Overview
- 4.2 Demographics
- 4.3 GDP Distribution by Economic Activity
- 4.4 GDP Growth by Economic Activity
- 4.5 Inflation
- 4.6 Economic Performance and Profile
- 4.6.1 Trends in E-Commerce Industry
- 4.6.2 Trends in Manufacturing Industry
- 4.7 Transport and Storage Sector GDP
- 4.8 Export Trends
- 4.9 Import Trends
- 4.10 Fuel Price
- 4.11 Logistics Performance
- 4.12 Modal Share
- 4.13 Freight Pricing Trends
- 4.14 Freight Tonnage Trends
- 4.15 Infrastructure
- 4.16 Regulatory Framework (Road and Rail)
- 4.17 Regulatory Framework (Sea and Air)
- 4.18 Value Chain and Distribution Channel Analysis
- 4.19 Market Drivers
- 4.19.1 Tuas Mega-Port Capacity Expansion Fueling Overall Sea-Freight Volumes in Singapore
- 4.19.2 Logistics Industry Digital Plan 2.0 Incentivizing Automation and Cold-Chain Investments
- 4.19.3 Pharma and Aerospace MRO Output Surges, Driving Demand for Time-Critical, Temperature-Controlled Services
- 4.19.4 Supply Chain Diversification from China-Centric Models Boosting Singapore as Alternative Hub
- 4.19.5 99% of Customs Permits Cleared Within 10 Minutes Enhancing Trans-Shipment Attractiveness
- 4.19.6 Changi East (T5) Expansion Lifting Air-Cargo Capacity to 4.5 Million Tons in the Airport
- 4.20 Market Restraints
- 4.20.1 Escalating Industrial Land and Warehouse Rents Compressing Operator Margins
- 4.20.2 Manpower Crunch from Tighter Foreign-Labor Quotas and Aging Workforce Curtailing Growth
- 4.20.3 Despite a Significant Land Coverage, the Country Faces Limited Domestic Road-Freight Capacity
- 4.20.4 Rising Competition Witnessed from Port Klang and Tanjung Pelepas for Trans-Shipment Flows
- 4.21 Technology Innovations in the Market
- 4.22 Porter's Five Forces Analysis
- 4.22.1 Threat of New Entrants
- 4.22.2 Bargaining Power of Suppliers
- 4.22.3 Bargaining Power of Buyers
- 4.22.4 Threat of Substitutes
- 4.22.5 Competitive Rivalry
5 Market Size and Growth Forecasts (Value, USD)
- 5.1 End User Industry
- 5.1.1 Agriculture, Fishing, and Forestry
- 5.1.2 Construction
- 5.1.3 Manufacturing
- 5.1.4 Oil and Gas, Mining and Quarrying
- 5.1.5 Wholesale and Retail Trade
- 5.1.6 Others
- 5.2 Logistics Function
- 5.2.1 Courier, Express, and Parcel (CEP)
- 5.2.1.1 By Destination Type
- 5.2.1.1.1 Domestic
- 5.2.1.1.2 International
- 5.2.2 Freight Forwarding
- 5.2.2.1 By Mode of Transport
- 5.2.2.1.1 Air
- 5.2.2.1.2 Sea and Inland Waterways
- 5.2.2.1.3 Others
- 5.2.3 Freight Transport
- 5.2.3.1 By Mode of Transport
- 5.2.3.1.1 Air
- 5.2.3.1.2 Pipelines
- 5.2.3.1.3 Road
- 5.2.3.1.4 Sea and Inland Waterways
- 5.2.4 Warehousing and Storage
- 5.2.4.1 By Temperature Control
- 5.2.4.1.1 Non-Temperature Controlled
- 5.2.4.1.2 Temperature Controlled
- 5.2.5 Other Services
- 5.2.1 Courier, Express, and Parcel (CEP)
6 Competitive Landscape
- 6.1 Key Strategic Moves
- 6.2 Market Share Analysis
- 6.3 Company Profiles (Includes Global Level Overview, Market Level Overview, Core Segments, Financials as Available, Strategic Information, Market Rank/Share for Key Companies, Products and Services, and Recent Developments)
- 6.3.1 A.P. Moller - Maersk
- 6.3.2 CJ Logistics Corporation
- 6.3.3 CMA CGM Group (Including CEVA Logistics)
- 6.3.4 CWT Pte, Ltd.
- 6.3.5 DHL Group
- 6.3.6 DSV A/S (Including DB Schenker)
- 6.3.7 FedEx
- 6.3.8 GEODIS (Including Keppel Logistics Pte Ltd.)
- 6.3.9 Kuehne+Nagel
- 6.3.10 Nippon Express Holdings, Inc.
- 6.3.11 Pacific International Lines Pte, Ltd.
- 6.3.12 Poh Tiong Choon Logistics, Ltd
- 6.3.13 PSA International
- 6.3.14 SATS, Ltd.
- 6.3.15 SF Express (KEX-SF)
- 6.3.16 Singapore Post, Ltd.
- 6.3.17 ST Logistics Pte, Ltd.
- 6.3.18 United Parcel Service of America, Inc. (UPS)
- 6.3.19 Vibrant Group, Ltd.
- 6.3.20 Yamato Holdings Co., Ltd.
- 6.3.21 YCH Group
7 Market Opportunities and Future Outlook
- 7.1 White-Space and Unmet-Need Assessment
 貨運和物流市場規模、佔有率和成長分析(按運輸方式、服務、最終用戶和地區分類)-2025-2032年產業預測
 中東歐貨運與物流:市場佔有率分析、產業趨勢、統計數據與成長預測(2025-2030 年)菲律賓貨運與物流:市場佔有率分析、行業趨勢、統計數據和成長預測(2025-2030 年)
 全球貨物審核與結算市場預測(2025-2030)
 2032 年碳中和解決方案市場預測:按類型、組件、部署模式、組織規模、技術、最終用戶和地區進行的全球分析
 2025年貨運和物流全球市場報告
 貨運審核與結算市場規模、佔有率及成長分析(依公司規模、最終用戶、應用及地區)-2025 年至 2032 年產業預測
 2034 年貨運與物流市場分析與預測:類型、產品、服務、技術、組件、應用、流程、模式、最終用戶2025年全球貨運車輛市場報告中國貨運與物流-市場佔有率分析、產業趨勢與統計、成長預測(2025-2030)