


 |
市場調查報告書
商品編碼
1693550
美國化肥:市場佔有率分析、產業趨勢與統計、成長預測(2025-2030 年)United States Fertilizers - Market Share Analysis, Industry Trends & Statistics, Growth Forecasts (2025 - 2030) |
||||||
※ 本網頁內容可能與最新版本有所差異。詳細情況請與我們聯繫。
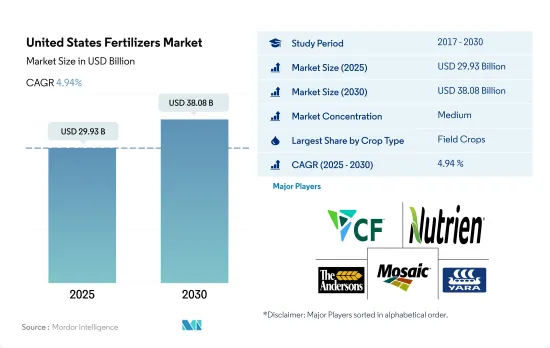
預計 2025 年美國肥料市場規模將達到 299.3 億美元,到 2030 年將達到 380.8 億美元,預測期內(2025-2030 年)的複合年成長率為 4.94%。
田間作物因種植面積大而佔市場主導地位。
- 田間作物占美國肥料市場的大部分佔有率,2022 年佔 87.2%。玉米是美國種植最廣泛的作物,大部分種植在被稱為玉米帶的地區。美國種植作物是大豆。與玉米一樣,農民主要在美國中西部各州種植大豆。
- 作物作物主要產自 10 個州,其中加州、佛羅裡達州和奧勒岡的銷量領先。 2022年,常規肥料將佔最大佔有率,達到77.6%,其次是特種肥料,佔22.4%。常規肥料佔比高是由於農民對常規肥料的採用率高,且與專用肥料相比價格較低。
- 草坪和觀賞作物占美國肥料市場的 10.3%。在美國,草坪和觀賞植物的肥料使用量正在增加,但這是一個普遍的趨勢。這種趨勢通常是由人們對修剪整齊的草坪、花園和景觀的渴望所驅動的。預計該市場從 2023 年到 2030 年的複合年成長率將達到 4.2%。
- 2022年,傳統肥料佔比最大,為77.8%。傳統肥料通常比其他替代品更具成本效益,使其成為大規模農業和商業景觀美化的實用選擇。
- 對主要田間作物的需求不斷增加、水果和草的種植面積不斷擴大以及政府強調自給自足的政策導致了溫室生產觀賞花卉等戰略的發展。預計這一發展將對該領域的成長做出重大貢獻,預計 2023 年至 2030 年期間該領域的複合年成長率為 4.7%。
美國肥料市場趨勢
由於農業用地有限,需要利用農業投入來提高農業生產力。
- 在美國,人口將從2020年的3.359億增加到2022年的3.382億。自2000年以來,耕地面積減少了近5,000萬英畝,到2022年將達到8.934億英畝。有限的農業用地表明需要透過使用農業投入來提高農業生產力。人們長期以來一直使用肥料來提高作物的產量。美國四大主要作物為玉米、棉花、大豆及小麥,2022年這四大農作物種植面積將佔主要作物面積的65.7%以上。
- 大豆和玉米是美國種植面積最大的兩種作物。 2022年大豆種植面積最大,占美國耕地面積的25.8%,其次是玉米,佔25.7%,小麥佔11.1%。這些作物大部分生長在被稱為「玉米帶」的地區,該地區涵蓋印第安納州西部、伊利諾伊州、愛荷華州、密蘇裡州、內布拉斯加州東部和堪薩斯州東部。該地區主要產玉米和大豆。根據美國農業部的數據,美國是主要的米出口國,其主要種植區有四個地區:
- 農業供應製造商正在開發創新產品,幫助農民精準施肥。這使得農民能夠降低成本,同時提高種植效率。該國田間作物擁有巨大的市場潛力,隨著政府資金和支持的增加,該領域的作物種植有望實現積極成長。
氮缺乏是美國作物最普遍的營養問題之一。
- 該國大田作物產業主要養分(氮、鉀、磷)的平均施用量約為166.61公斤/公頃。氮為45.93%,鉀為28.11%,磷為25.96%。
- 田間作物中,油菜籽/油菜籽的平均一次養分施用量為284.92公斤/公頃,為田間作物中最高。在主要養分中,氮肥施用量最高,平均施用量為229.60公斤/公頃。這是因為植物代謝需要大量的氮,而氮是葉綠素和胺基酸的主要成分。
- 在美國,玉米是第二田間作物,平均主要養分施用率為 245.40 公斤/公頃,其次是油菜籽。玉米產量約佔全國田間作物總產量的31.44%。具體來說,玉米需要大約50.06%的氮、23.77%的磷和26.17%的鉀,佔總養分施用量的大部分。
- 主要營養素在增強植物酵素的功能、促進植物細胞生長和促進重要的生化過程方面發揮著至關重要的作用。這些主要營養素的缺乏會對植物健康產生嚴重影響,阻礙生長並影響作物產量。相反,為了滿足日益成長的生產力需求,田間作物的主要養分施用量預計會增加。
美國化肥產業概況
美國肥料市場適度整合,前五大公司佔57.61%。該市場的主要企業有:CF Industries Holdings, Inc.、Nutrien Ltd.、The Andersons Inc.、The Mosaic Company 和 Yara International ASA(按字母順序排列)
其他福利
- Excel 格式的市場預測 (ME) 表
- 3個月的分析師支持
目錄
第1章執行摘要和主要發現
第2章 報告要約
第3章 引言
- 研究假設和市場定義
- 研究範圍
- 調查方法
第4章 產業主要趨勢
- 主要作物種植面積
- 田間作物
- 園藝作物
- 平均養分施用量
- 微量營養素
- 田間作物
- 園藝作物
- 主要營養素
- 田間作物
- 園藝作物
- 次要宏量營養素
- 田間作物
- 園藝作物
- 微量營養素
- 灌溉農田
- 法律規範
- 價值鍊和通路分析
第5章市場區隔
- 類型
- 複合型
- 直的
- 微量營養素
- 硼
- 銅
- 鐵
- 錳
- 鉬
- 鋅
- 其他
- 氮
- 硝酸銨
- 無水氨
- 尿素
- 其他
- 磷酸
- DAP
- MAP
- SSP
- TSP
- 鉀
- MoP
- SoP
- 其他
- 次要營養物質
- 鈣
- 鎂
- 硫
- 形式
- 傳統的
- 特別的
- CRF
- 液體肥料
- SRF
- 水溶性
- 施肥方式
- 受精
- 葉面噴布
- 土壤
- 作物類型
- 田間作物
- 園藝作物
- 草坪和觀賞植物
第6章競爭格局
- 關鍵策略趨勢
- 市場佔有率分析
- 商業狀況
- 公司簡介
- CF Industries Holdings, Inc.
- Haifa Group
- ICL Group Ltd
- Koch Industries Inc.
- Nutrien Ltd.
- Sociedad Quimica y Minera de Chile SA
- The Andersons Inc.
- The Mosaic Company
- Wilbur-Ellis Company LLC
- Yara International ASA
第7章:CEO面臨的關鍵策略問題
第 8 章 附錄
- 世界概況
- 概述
- 五力分析框架
- 全球價值鏈分析
- 市場動態(DRO)
- 資訊來源及延伸閱讀
- 圖片列表
- 關鍵見解
- 資料包
- 詞彙表
The United States Fertilizers Market size is estimated at 29.93 billion USD in 2025, and is expected to reach 38.08 billion USD by 2030, growing at a CAGR of 4.94% during the forecast period (2025-2030).
Field crops dominated the market owing to their larger cultivation area
- Field crops hold a major share of the US fertilizer market, as they accounted for 87.2% in 2022. The largest crop in the United States in terms of total production is corn, the majority of which grows in a region known as the Corn Belt. The second-largest crop grown in the United States is soybeans. Like corn, farmers primarily grow soybeans in the Midwestern states.
- Horticulture production primarily occurs in 10 states, with California, Florida, and Oregon leading the country in sales. Conventional fertilizers occupied a maximum share of 77.6% in 2022, followed by specialty fertilizers with 22.4%. The higher share of conventional fertilizers is due to the higher adoption of conventional fertilizers by farmers and their lower prices compared to specialty fertilizers.
- Turf and ornamental crops contribute to 10.3% of the US fertilizer market. The increased use of fertilizers in turf and ornamental plants in the United States is a common trend. This trend is often driven by the desire for well-manicured lawns, gardens, and landscapes. The market is expected to register a CAGR of 4.2% from 2023 to 2030.
- Conventional fertilizers occupied a maximum share of 77.8% in 2022. Conventional fertilizers are often more cost-effective than other alternatives, making them a practical choice for large-scale agriculture and commercial landscaping.
- The rising demand for major field crops, the expansion of cultivated areas for fruits and turf, and the government's emphasis on self-sufficiency have led to the development of strategies like greenhouse production of ornamental flowers. This development is expected to significantly contribute to segmental growth, with a projected CAGR of 4.7% between 2023 and 2030.
United States Fertilizers Market Trends
The limited farmland indicates the need to enhance agricultural productivity by employing agri-inputs
- In the United States, the population increased from 335.9 million in 2020 to 338.2 million in 2022. From 2000, the total farmland area decreased by almost 50 million acres, reaching a total of 893.4 million acres as of 2022. The limited farmland indicates the need to increase agricultural productivity with the use of agri inputs. Fertilizers have been used for a long time to increase the productivity of crops. The four major crops in the United States are corn, cotton, soybean, and wheat, which account for more than 65.7% of the principal crop acreage in 2022.
- Soybean and corn are the two largest crops grown in the United States. In 2022, soybeans had the highest area under cultivation, accounting for 25.8% of the total arable land in the United States, followed by corn at 25.7% and wheat at 11.1%. The majority of these crops are grown in a region known as the "Corn Belt," which covers western Indiana, Illinois, Iowa, Missouri, eastern Nebraska, and eastern Kansas. The production of corn (maize) and soybeans dominates this area. Additionally, the United States is a major exporter of rice, with most of the cultivation happening in four regions, three of which are in the South and one in California, according to the USDA.
- Manufacturers of farm inputs are developing innovative products to assist farmers with the precise application of fertilizers. This helps farmers reduce the cost of cultivation while increasing efficiency. The country's field crops have immense market potential, and with increased government funding and support, they are expected to drive positive growth in crop cultivation in this area.
Nitrogen deficiency is one of the most prevalent crop nutrient problems across cropping areas in the United States
- The average application rate of primary nutrients (nitrogen, potassium, and phosphorus) in the country's field crops industry stands at approximately 166.61 kg/hectare. Nitrogen constitutes 45.93%, potassium accounts for 28.11%, and phosphorus makes up 25.96% of the total primary nutrient application in field crops.
- In field crops, rapeseed/ canola was applied with an average primary nutrient application rate of 284.92 kg/hectare, which is the highest in field crops. In primary nutrients, nitrogen occupies first place with an average application rate of 229.60 kg/hectare. This is because nitrogen is required in large amounts for plant metabolism, and it is a major component of chlorophyll and amino acids.
- In the United States, corn/maize stands as the second-largest field crop, with an average primary nutrient application rate of 245.40 kg/hectare, followed by rapeseed/canola. Corn production constitutes approximately 31.44% of the country's total field crop output. Specifically, corn requires about 50.06% of nitrogen, 23.77% of phosphorus, and 26.17% of potash, making up the lion's share of the total nutrient application.
- Primary nutrients play a pivotal role in enhancing plant enzyme function, bolstering plant cell growth, and facilitating crucial biochemical processes. Any deficiency in these primary nutrients can significantly impact plant health, stunting growth and hampering crop yields. In response, the application of primary nutrients in field crops is expected to rise, driven by the need to meet escalating productivity demands.
United States Fertilizers Industry Overview
The United States Fertilizers Market is moderately consolidated, with the top five companies occupying 57.61%. The major players in this market are CF Industries Holdings, Inc., Nutrien Ltd., The Andersons Inc., The Mosaic Company and Yara International ASA (sorted alphabetically).
Additional Benefits:
- The market estimate (ME) sheet in Excel format
- 3 months of analyst support
TABLE OF CONTENTS
1 EXECUTIVE SUMMARY & KEY FINDINGS
2 REPORT OFFERS
3 INTRODUCTION
- 3.1 Study Assumptions & Market Definition
- 3.2 Scope of the Study
- 3.3 Research Methodology
4 KEY INDUSTRY TRENDS
- 4.1 Acreage Of Major Crop Types
- 4.1.1 Field Crops
- 4.1.2 Horticultural Crops
- 4.2 Average Nutrient Application Rates
- 4.2.1 Micronutrients
- 4.2.1.1 Field Crops
- 4.2.1.2 Horticultural Crops
- 4.2.2 Primary Nutrients
- 4.2.2.1 Field Crops
- 4.2.2.2 Horticultural Crops
- 4.2.3 Secondary Macronutrients
- 4.2.3.1 Field Crops
- 4.2.3.2 Horticultural Crops
- 4.2.1 Micronutrients
- 4.3 Agricultural Land Equipped For Irrigation
- 4.4 Regulatory Framework
- 4.5 Value Chain & Distribution Channel Analysis
5 MARKET SEGMENTATION (includes market size in Value in USD and Volume, Forecasts up to 2030 and analysis of growth prospects)
- 5.1 Type
- 5.1.1 Complex
- 5.1.2 Straight
- 5.1.2.1 Micronutrients
- 5.1.2.1.1 Boron
- 5.1.2.1.2 Copper
- 5.1.2.1.3 Iron
- 5.1.2.1.4 Manganese
- 5.1.2.1.5 Molybdenum
- 5.1.2.1.6 Zinc
- 5.1.2.1.7 Others
- 5.1.2.2 Nitrogenous
- 5.1.2.2.1 Ammonium Nitrate
- 5.1.2.2.2 Anhydrous Ammonia
- 5.1.2.2.3 Urea
- 5.1.2.2.4 Others
- 5.1.2.3 Phosphatic
- 5.1.2.3.1 DAP
- 5.1.2.3.2 MAP
- 5.1.2.3.3 SSP
- 5.1.2.3.4 TSP
- 5.1.2.4 Potassic
- 5.1.2.4.1 MoP
- 5.1.2.4.2 SoP
- 5.1.2.4.3 Others
- 5.1.2.5 Secondary Macronutrients
- 5.1.2.5.1 Calcium
- 5.1.2.5.2 Magnesium
- 5.1.2.5.3 Sulfur
- 5.2 Form
- 5.2.1 Conventional
- 5.2.2 Speciality
- 5.2.2.1 CRF
- 5.2.2.2 Liquid Fertilizer
- 5.2.2.3 SRF
- 5.2.2.4 Water Soluble
- 5.3 Application Mode
- 5.3.1 Fertigation
- 5.3.2 Foliar
- 5.3.3 Soil
- 5.4 Crop Type
- 5.4.1 Field Crops
- 5.4.2 Horticultural Crops
- 5.4.3 Turf & Ornamental
6 COMPETITIVE LANDSCAPE
- 6.1 Key Strategic Moves
- 6.2 Market Share Analysis
- 6.3 Company Landscape
- 6.4 Company Profiles
- 6.4.1 CF Industries Holdings, Inc.
- 6.4.2 Haifa Group
- 6.4.3 ICL Group Ltd
- 6.4.4 Koch Industries Inc.
- 6.4.5 Nutrien Ltd.
- 6.4.6 Sociedad Quimica y Minera de Chile SA
- 6.4.7 The Andersons Inc.
- 6.4.8 The Mosaic Company
- 6.4.9 Wilbur-Ellis Company LLC
- 6.4.10 Yara International ASA
7 KEY STRATEGIC QUESTIONS FOR FERTILIZER CEOS
8 APPENDIX
- 8.1 Global Overview
- 8.1.1 Overview
- 8.1.2 Porter's Five Forces Framework
- 8.1.3 Global Value Chain Analysis
- 8.1.4 Market Dynamics (DROs)
- 8.2 Sources & References
- 8.3 List of Tables & Figures
- 8.4 Primary Insights
- 8.5 Data Pack
- 8.6 Glossary of Terms
 2025年全球化肥料市場報告2025年全球生物炭肥料市場報告
 2025-2029年全球肥料市場
 中國化肥:市場佔有率分析、產業趨勢與統計、成長預測(2025-2030年)中東和非洲肥料:市場佔有率分析、行業趨勢和統計數據、成長預測(2025-2030 年)亞太化肥:市場佔有率分析、產業趨勢與成長預測(2025-2030 年)北美肥料:市場佔有率分析、產業趨勢與統計、成長預測(2025-2030)南美肥料:市場佔有率分析、行業趨勢和成長預測(2025-2030 年)印尼化肥:市場佔有率分析、產業趨勢與統計、成長預測(2025-2030 年)印度肥料:市場佔有率分析、產業趨勢與統計、成長預測(2025-2030)