


 |
市場調查報告書
商品編碼
1693556
印度肥料:市場佔有率分析、產業趨勢與統計、成長預測(2025-2030)India Fertilizers - Market Share Analysis, Industry Trends & Statistics, Growth Forecasts (2025 - 2030) |
||||||
※ 本網頁內容可能與最新版本有所差異。詳細情況請與我們聯繫。
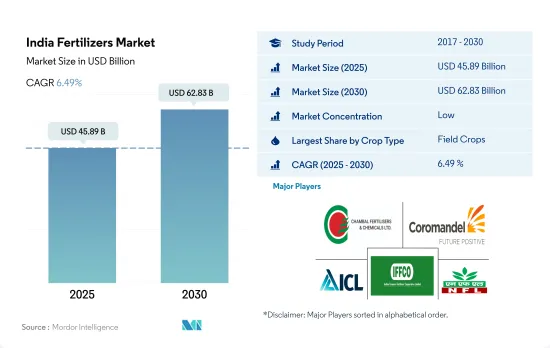
印度肥料市場規模預計在 2025 年為 458.9 億美元,預計到 2030 年將達到 628.3 億美元,預測期內(2025-2030 年)的複合年成長率為 6.49%。
米是主要的 NPK 消耗作物,預計將推動該國的化肥需求。
- 預計大田作物肥料將在 2022 年佔據 89.2% 的市場佔有率,2023 年至 2030 年的複合年成長率為 9.8%。主要田間作物水稻的種植面積大幅增加,2022 年種植面積為 4,700 萬公頃,比 2017 年增加 93.1%。鑑於水稻對 NPK 肥料的高度依賴,預計它將成為該國化肥需求的主要驅動力。
- 田間作物作物種植面積將從2017年的1.87億公頃增加到2022年的1.94億公頃。在田間作物中,穀物佔很大比例。為了滿足不斷成長的人口的糧食需求,田間作物種植面積激增,預計這將在未來幾年推動印度化肥市場的發展。
- 2022年,園藝作物肥料佔印度肥料市場的10.5%,價值50.2億美元。園藝作物面積將緩慢增加,從 2017 年的 860 萬公頃增加到 2022 年的 890 萬公頃。園藝作物種植面積的增加伴隨著肥料消費量的增加,旨在最大限度地提高產量。
- 印度的草皮和觀賞作物肥料產業雖然只佔很小一部分,但 2021 年的價值為 7,480 萬美元。政府強調自給自足,並採取了促進溫室觀賞花卉生產等舉措,顯示該產業具有潛在的成長潛力。
- 隨著主要田間作物需求的不斷成長以及水果和草皮種植面積的不斷擴大,這一領域將實現顯著成長。預計 2023 年至 2030 年田間作物的複合年成長率為 6.4%,水果和草皮的複合年成長率為 4.0%。
印度肥料市場趨勢
國內外消費需求的不斷成長是印度種植面積成長的主要驅動力
- 在研究期間,印度田間作物作物種植面積增加了6%。受國內外消費需求推動,穀物、豆類和油籽種植面積激增,對種植面積擴大發揮了關鍵作用。
- 從作物種類來看,2022年,水稻將佔印度農業的25.4%,小麥將佔17.4%,大豆將佔7.5%。水稻是印度的主糧,在全國佔據主導地位,佔印度耕地總面積的四分之一,養活了近一半的人口。它在全國各地都有種植,主要分佈在西孟加拉邦、北方邦、安得拉邦、旁遮普邦和泰米爾納德邦。然而,2022 年雨季印度米的生產量下降了 6%(1.0499 億噸)。這主要是由於賈坎德邦、中央邦和西孟加拉邦等地降雨不足,導致水稻種植面積減少。
- 旁遮普邦、西孟加拉邦、哈里亞納邦和拉賈斯坦邦將成為印度主要的小麥種植邦。 2017年至2022年間,印度的小麥種植面積增加了5%。不過,小麥產量將從去年的1.0959億噸下降到2022年的1.0774億噸。產量下降的原因是暴雨和冰雹襲擊了印度北部、中部和西部的肥沃平原。這些自然災害對小麥等已成熟的冬季作物造成嚴重破壞,對農民造成重大損失。
- 由於印度糧食種植業蓬勃發展以及國內外需求激增,預計印度化肥市場將在 2023 年至 2030 年間實現成長。
在大量營養素中,氮是田間作物最常使用的營養素,平均施用率為 223.5 公斤/公頃。
- 2021年主要養分平均施用率為125.1公斤/公頃。特別值得注意的是氮,最高平均施用量為223.5公斤/公頃。鑑於水稻等作物的密集種植,氮這種關鍵營養素發揮著至關重要的作用也就不足為奇了。然而,土壤缺乏這種養分,阻礙了全國水稻的生產。
- 正如《生物肥料和有機肥料的現狀》報告所強調的那樣,印度土壤的健康狀況令人擔憂。報告顯示,化學肥料消費量呈上升趨勢,受檢土壤中氮、磷、鉀營養缺乏的比例分別為97.0%、83.0%及71.0%。
- 主要作物中,2021年小麥、水稻、玉米養分施用量最高,分別為平均每公頃231公斤、156公斤、149公斤。小麥和稻米是我國乃至全球的主糧,但由於多種營養缺陷,產量和利潤大幅下降。除了氮、磷和鉀之外,這些作物還依賴硫、硼、鐵和鋅等微量營養素來實現最佳生長。由於營養管理在作物成功生產中發揮關鍵作用,因此市場正在不斷成長。
- 田間作物,尤其是穀物和穀類,對主要營養素有著極大的需求,尤其是氮肥。大規模種植這些作物正在消耗土壤養分,預計將在2023年至2030年期間推動肥料需求的快速成長,從而推動市場成長。
印度化肥產業概況
印度化肥市場較為分散,前五大公司佔27.78%的市佔率。市場的主要企業有:Chambal Fertilizers & Chemicals Ltd、Coromandel International Ltd.、ICL Group Ltd、Indian Farmers Fertiliser Cooperative Limited 和 National Fertilizers Ltd(按字母順序排列)
其他福利
- Excel 格式的市場預測 (ME) 表
- 3個月的分析師支持
目錄
第1章執行摘要和主要發現
第2章 報告要約
第3章 引言
- 研究假設和市場定義
- 研究範圍
- 調查方法
第4章 產業主要趨勢
- 主要作物種植面積
- 田間作物
- 園藝作物
- 平均養分施用量
- 微量營養素
- 田間作物
- 園藝作物
- 主要營養素
- 田間作物
- 園藝作物
- 次要宏量營養素
- 田間作物
- 園藝作物
- 微量營養素
- 灌溉農田
- 法律規範
- 價值鍊和通路分析
第5章市場區隔
- 類型
- 複合型
- 直的
- 微量營養素
- 硼
- 銅
- 鐵
- 錳
- 鉬
- 鋅
- 其他
- 氮
- 尿素
- 其他
- 磷酸
- DAP
- MAP
- SSP
- 其他
- 鉀
- MoP
- 次要營養物質
- 鈣
- 鎂
- 硫
- 形式
- 傳統的
- 特別的
- CRF
- 液體肥料
- SRF
- 水溶性
- 施肥方式
- 受精
- 葉面噴布
- 土壤
- 作物類型
- 田間作物
- 園藝作物
- 草坪和觀賞植物
第6章競爭格局
- 關鍵策略趨勢
- 市場佔有率分析
- 商業狀況
- 公司簡介
- Chambal Fertilizers & Chemicals Ltd
- Coromandel International Ltd.
- Gujarat Narmada Valley Fertilizers & Chemicals Ltd
- Haifa Group
- ICL Group Ltd
- Indian Farmers Fertiliser Cooperative Limited
- National Fertilizers Ltd
- Rashtriya Chemicals & Fertilizers Ltd
- Sociedad Quimica y Minera de Chile SA
- Yara International ASA
第7章:CEO面臨的關鍵策略問題
第 8 章 附錄
- 世界概況
- 概述
- 五力分析框架
- 全球價值鏈分析
- 市場動態(DRO)
- 資訊來源及延伸閱讀
- 圖片列表
- 關鍵見解
- 資料包
- 詞彙表
The India Fertilizers Market size is estimated at 45.89 billion USD in 2025, and is expected to reach 62.83 billion USD by 2030, growing at a CAGR of 6.49% during the forecast period (2025-2030).
Rice is a major NPK-consuming crop that is expected to drive the nation's fertilizer demand
- In 2022, field crop fertilizers dominated the market, accounting for 89.2%, and are projected to record a CAGR of 9.8% during 2023-2030. Rice, the leading field crop, witnessed a substantial surge in cultivation, with 47 million hectares planted in 2022, marking a 93.1% increase from 2017. Given rice's significant reliance on NPK fertilizers, it is poised to be a key driver of fertilizer demand in the country.
- The area dedicated to field crops expanded from 187 million hectares in 2017 to 194 million hectares by 2022. Cereals, within the field crop category, commanded a substantial share. This surge in field crop cultivation, driven by the need to feed a growing population, is expected to propel India's fertilizer market in the coming years.
- In 2022, horticultural crop fertilizers represented 10.5% of the Indian fertilizer market, valued at USD 5.02 billion. The area under horticulture cultivation witnessed a modest rise, reaching 8.9 million hectares in 2022 from 8.6 million hectares in 2017. This uptick in horticulture acreage is accompanied by a parallel rise in fertilizer consumption aimed at maximizing yields.
- The turf and ornamental crop fertilizer segment in India, though a small fraction, was valued at USD 74.8 million in 2021. The government's emphasis on self-sufficiency has led to initiatives like promoting greenhouse ornamental flower production, hinting at potential growth in this segment.
- With the rising demand for major field crops and the expansion of fruit and turf cultivation areas, this segment is poised for significant growth. The projected CAGR during 2023-2030 is 6.4% for field crops and 4.0% for fruits and turf.
India Fertilizers Market Trends
The rising consumer demand domestically and internationally is the major driving factor for the rising acreage in India
- During the study period, the country witnessed a 6% increase in field crop cultivation. This surge in the cultivation of cereals, pulses, and oilseeds, driven by both domestic and international consumer demand, played a pivotal role in expanding the acreage.
- Breaking down the crops, rice, wheat, and soybean dominated the country's agricultural landscape in 2022, accounting for 25.4%, 17.4%, and 7.5%, respectively. Rice, a staple in India, commands a significant share, covering a quarter of the total cropped area and feeding nearly half the population. It finds cultivation across the nation, with key states being West Bengal, Uttar Pradesh, Andhra Pradesh, Punjab, and Tamil Nadu. However, India's rice production dipped by 6% (104.99 million tons) in the kharif season of 2022, primarily due to reduced paddy acreage in states like Jharkhand, Madhya Pradesh, and West Bengal, grappling with rainfall deficits.
- Punjab, West Bengal, Haryana, and Rajasthan emerge as the primary wheat cultivators in India. From 2017 to 2022, wheat cultivation in India witnessed a 5% increase. However, the wheat output dipped to 107.74 million tonnes in 2022 from the previous year's 109.59 million tonnes. This decline can be attributed to heavy rainfall and hailstorms that battered the fertile plains of northern, central, and western India. These natural calamities inflicted significant damage on the maturing winter-planted crops, including wheat, leading to substantial losses for farmers.
- Given the robust cereal cultivation in India, bolstered by surging domestic and international demand, the Indian fertilizer market is poised for growth during 2023-2030.
Among the primary nutrients, nitrogen is the most-applied nutrient in field crops, with an average application rate of 223.5 kg per hectare
- In 2021, the average application rate for primary nutrients stood at 125.1 kg/ha. Notably, nitrogen topped the list with an average application rate of 223.5 kg/ha. Given the intensive cultivation of crops like rice in the country, it is no surprise that nitrogen, being a crucial nutrient, plays a pivotal role. However, the deficiency of this nutrient in the soil is hampering rice productivity nationwide.
- The soil health in India, as highlighted in the State of Biofertilizers and Organic Fertilizers report, is a cause for concern. It reveals a rising trend in the consumption of chemical fertilizers, with 97.0%, 83.0%, and 71.0% of tested soils showing deficiencies in nitrogen, phosphorous, and potassium, respectively.
- Among the major crops, wheat, rice, and corn/maize led the pack in nutrient application rates in 2021, with averages of 231, 156, and 149 kg/ha, respectively. Wheat and rice, being staple foods both domestically and globally, face significant yield and profit reductions due to multiple nutrient deficiencies. Apart from nitrogen, phosphorous, and potassium, these crops also rely on micronutrients like sulfur, boron, iron, and zinc for optimal growth. Given the critical role of nutrient management in successful crop production, the market is witnessing growth.
- Field crops, especially grains and cereals, have a voracious appetite for primary nutrients, particularly nitrogen fertilizers. With the extensive cultivation of these crops depleting the soil's nutrient content, the demand for fertilizers is expected to surge during 2023-2030, driving market growth.
India Fertilizers Industry Overview
The India Fertilizers Market is fragmented, with the top five companies occupying 27.78%. The major players in this market are Chambal Fertilizers & Chemicals Ltd, Coromandel International Ltd., ICL Group Ltd, Indian Farmers Fertiliser Cooperative Limited and National Fertilizers Ltd (sorted alphabetically).
Additional Benefits:
- The market estimate (ME) sheet in Excel format
- 3 months of analyst support
TABLE OF CONTENTS
1 EXECUTIVE SUMMARY & KEY FINDINGS
2 REPORT OFFERS
3 INTRODUCTION
- 3.1 Study Assumptions & Market Definition
- 3.2 Scope of the Study
- 3.3 Research Methodology
4 KEY INDUSTRY TRENDS
- 4.1 Acreage Of Major Crop Types
- 4.1.1 Field Crops
- 4.1.2 Horticultural Crops
- 4.2 Average Nutrient Application Rates
- 4.2.1 Micronutrients
- 4.2.1.1 Field Crops
- 4.2.1.2 Horticultural Crops
- 4.2.2 Primary Nutrients
- 4.2.2.1 Field Crops
- 4.2.2.2 Horticultural Crops
- 4.2.3 Secondary Macronutrients
- 4.2.3.1 Field Crops
- 4.2.3.2 Horticultural Crops
- 4.2.1 Micronutrients
- 4.3 Agricultural Land Equipped For Irrigation
- 4.4 Regulatory Framework
- 4.5 Value Chain & Distribution Channel Analysis
5 MARKET SEGMENTATION (includes market size in Value in USD and Volume, Forecasts up to 2030 and analysis of growth prospects)
- 5.1 Type
- 5.1.1 Complex
- 5.1.2 Straight
- 5.1.2.1 Micronutrients
- 5.1.2.1.1 Boron
- 5.1.2.1.2 Copper
- 5.1.2.1.3 Iron
- 5.1.2.1.4 Manganese
- 5.1.2.1.5 Molybdenum
- 5.1.2.1.6 Zinc
- 5.1.2.1.7 Others
- 5.1.2.2 Nitrogenous
- 5.1.2.2.1 Urea
- 5.1.2.2.2 Others
- 5.1.2.3 Phosphatic
- 5.1.2.3.1 DAP
- 5.1.2.3.2 MAP
- 5.1.2.3.3 SSP
- 5.1.2.3.4 Others
- 5.1.2.4 Potassic
- 5.1.2.4.1 MoP
- 5.1.2.5 Secondary Macronutrients
- 5.1.2.5.1 Calcium
- 5.1.2.5.2 Magnesium
- 5.1.2.5.3 Sulfur
- 5.2 Form
- 5.2.1 Conventional
- 5.2.2 Speciality
- 5.2.2.1 CRF
- 5.2.2.2 Liquid Fertilizer
- 5.2.2.3 SRF
- 5.2.2.4 Water Soluble
- 5.3 Application Mode
- 5.3.1 Fertigation
- 5.3.2 Foliar
- 5.3.3 Soil
- 5.4 Crop Type
- 5.4.1 Field Crops
- 5.4.2 Horticultural Crops
- 5.4.3 Turf & Ornamental
6 COMPETITIVE LANDSCAPE
- 6.1 Key Strategic Moves
- 6.2 Market Share Analysis
- 6.3 Company Landscape
- 6.4 Company Profiles
- 6.4.1 Chambal Fertilizers & Chemicals Ltd
- 6.4.2 Coromandel International Ltd.
- 6.4.3 Gujarat Narmada Valley Fertilizers & Chemicals Ltd
- 6.4.4 Haifa Group
- 6.4.5 ICL Group Ltd
- 6.4.6 Indian Farmers Fertiliser Cooperative Limited
- 6.4.7 National Fertilizers Ltd
- 6.4.8 Rashtriya Chemicals & Fertilizers Ltd
- 6.4.9 Sociedad Quimica y Minera de Chile SA
- 6.4.10 Yara International ASA
7 KEY STRATEGIC QUESTIONS FOR FERTILIZER CEOS
8 APPENDIX
- 8.1 Global Overview
- 8.1.1 Overview
- 8.1.2 Porter's Five Forces Framework
- 8.1.3 Global Value Chain Analysis
- 8.1.4 Market Dynamics (DROs)
- 8.2 Sources & References
- 8.3 List of Tables & Figures
- 8.4 Primary Insights
- 8.5 Data Pack
- 8.6 Glossary of Terms
 2032年化肥市場預測:按肥料類型、作物類型、形態、分銷管道、應用和地區分類的全球分析按類型、用途、形式和地區分類的肥料市場
 肥料市場機會、成長動力、產業趨勢分析及2025-2034年預測肥料袋市場規模、佔有率和趨勢分析報告:按材料、尺寸、封口類型、應用、地區和細分市場預測,2025-2033 年全球永續海藻肥料市場:2032 年預測 - 按產品、原料、作物類型、萃取方法、應用和地區進行分析
 2025 年至 2033 年肥料市場規模、佔有率、趨勢及預測(依產品類型、產品、產品形態、作物類型及地區分類)全球綠肥市場海藻基肥料市場機會、成長動力、產業趨勢分析及 2025 - 2034 年預測
 混合肥料的全球市場:類型·作物類型·適用法·通路·終端用戶·形態·各地區 (~2032年)
 2025年全球肥料市場報告