


 |
市場調查報告書
商品編碼
1693558
中東和非洲肥料:市場佔有率分析、行業趨勢和統計數據、成長預測(2025-2030 年)Middle East & Africa Fertilizers - Market Share Analysis, Industry Trends & Statistics, Growth Forecasts (2025 - 2030) |
||||||
※ 本網頁內容可能與最新版本有所差異。詳細情況請與我們聯繫。
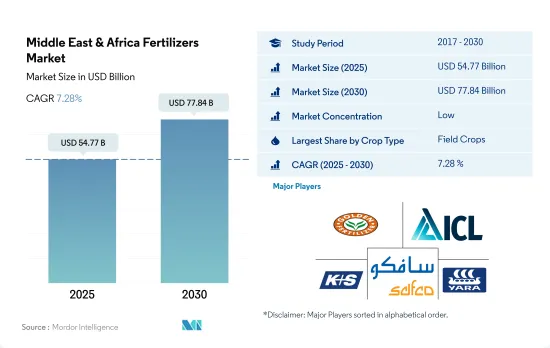
預計 2025 年中東和非洲肥料市場規模為 547.7 億美元,到 2030 年將達到 778.4 億美元,預測期內(2025-2030 年)的複合年成長率為 7.28%。
田間作物因種植面積大而佔市場主導地位。
- 預計 2023 年至 2030 年期間,整個肥料市場的複合年成長率將達到 7.0%。農業是非洲最重要的經濟活動。它們為非洲大陸約三分之二的勞動人口提供了就業機會,平均佔非洲國家國內生產總值的30-60%和出口的30.0%。
- 非洲因其擁有豐富的可耕地而被視為重要的農業生產中心。然而,非洲只有6.0%的可耕地得到灌溉。 2018年,撒哈拉以南非洲地區的平均肥料消費量為每公頃17.0公斤,遠低於全球平均的135.0公斤/公頃。
- 中東地區主要種植小麥、大麥等主糧作物。埃及和沙烏地阿拉伯在稻米、玉米、扁豆、鷹嘴豆、蔬菜和水果的生產方面也處於領先地位。另一方面,非洲擁有各種各樣的蔬菜,包括番茄、洋蔥、捲心菜、辣椒、秋葵、茄子和黃瓜。尤其是番茄和洋蔥,在北非沿海地區種植十分豐富。受歡迎的飲料作物包括茶、咖啡、可可和葡萄。
- 農業部門在經濟和社會發展中發揮著至關重要的作用,但尚未得到中東和北非地區政策制定者和相關人員的足夠重視。儘管農業對 GDP 的貢獻較低,但其對中東和北非國家永續的戰略重要性預計將在未來幾年推動化肥市場的發展。
人口成長和糧食安全問題正在推動市場發展,而這些問題需要透過在該地區使用化學肥料來解決。
- 該地區的肥料市場受到人口成長、糧食安全需求、集約化農業實踐的採用以及土壤營養缺乏等因素的驅動。預計 2023 年至 2030 年的複合年成長率為 7.0%。
- 非洲是世界上人口最多的大陸,擁有廣大的可耕地。例如,撒哈拉以南非洲地區居住著全球13%的人口,控制著全球約20%的農業用地。然而,該地區面臨嚴重的糧食短缺問題,主要是由於對化學肥料的依賴增加。
- 奈及利亞將引領非洲化肥市場,到 2022 年將佔 12.7% 的市場。奈及利亞擁有 70 多家混合廠和主要尿素生產設施,正迅速成為尿素市場上具有全球競爭力的化肥強國。產量的激增導致成本降低、供應增加,從而提高了農民的採用率。
- 眾所周知,中東地區的氣候條件不利於農業發展,嚴重依賴化肥進口來滿足國內需求。因此,該地區的化肥採用率相對較高,可滿足國內和國際需求。
- 肥料具有經濟效益,可以持續提高產量,但由於供應有限和環境條件惡劣等挑戰,肥料的使用量不斷增加。該地區面臨著滿足不斷成長的人口需求和確保糧食安全的迫切需要,進一步推動市場成長。
中東和非洲肥料市場趨勢
風蝕和水蝕使雨養土地和灌溉土地都遭到破壞,對該地區的作物種植帶來了挑戰。
- 在中東和非洲,玉米、水稻、高粱和大豆等田間作物通常在四月至五月之間種植,九月至十月之間收穫。該地區的農業部門面臨重大挑戰。土地和水資源稀缺,雨養土地因風蝕和水蝕劣化,不永續的農業實踐使情況更加惡化。大田作物是農業的主要組成部分,約佔該地區農業用地總面積的90%。 2022年,田間作物種植面積將達2.49億公頃,比2017年增加3.9%。其中,玉米的種植面積較大,佔田間作物總面積的17.8%。小麥種植面積也顯著增加,預計2022年小麥種植面積將比2017年增加4.6%。其中,2022年該地區玉米種植面積將達4,430萬公頃。
- 在非洲,奈及利亞是最大的高粱生產國,緊隨其後的是衣索比亞。高粱是奈及利亞農業的主要作物,佔該國穀物總產量的 50%,且佔穀物生產土地面積的 45% 左右。高粱耐旱耐澇,適應各種土壤條件,是中東和非洲乾旱地區保障糧食和收入安全的理想作物。
- 過去十年來該地區人口增加了23%以上。雖然由於生產能力有限,預計糧食進口量將會增加,但隨著耕地面積的擴大,農業也呈現持續成長。
乾旱天氣加速了土壤中氮的消耗,而氮是農業生產力的關鍵營養素。
- 氮、磷和鉀是植物生長必需的大量營養素。氮和磷是植物組織的主要成分—蛋白質和核酸所必需的。另一方面,鉀對收穫作物的品質有顯著的影響。田間作物平均每公頃獲得174.4公斤主要養分。
- 其中,中東及非洲地區田間作物氮、磷、鉀平均施用量分別為234.8公斤/公頃、127.4公斤/公頃、161.0公斤/公頃。中東和非洲主要種植小麥、高粱、水稻、玉米等田間作物。 2022年這些作物的主要養分平均施用量分別為144.5公斤/公頃、162.9公斤/公頃、152.6公斤/公頃和245.24公斤/公頃。
- 在主要營養元素中,氮將成為中東和非洲地區的主要消費量,到2022年將達到170萬噸。氮是作物產量最重要的營養元素,由於該地區土壤普遍缺乏氮,氮是應用最廣泛的肥料。這一優勢是由於該地區耕作面積大,約佔總面積的 95.0%,因此對主要營養物質的需求很高。強調自給自足和減少對進口的依賴是該地區田間作物市場成長的基礎。
中東和非洲肥料行業概況
中東和非洲肥料市場較為分散,前五大企業佔7.92%。該市場的主要企業有:Golden Fertilizer Company Limited、ICL Group Ltd、K+S Aktiengesellschaft、SABIC Agri-Nutrients Co. 和 Yara International ASA(按字母順序排列)
其他福利
- Excel 格式的市場預測 (ME) 表
- 3個月的分析師支持
目錄
第1章執行摘要和主要發現
第2章 報告要約
第3章 引言
- 研究假設和市場定義
- 研究範圍
- 調查方法
第4章 產業主要趨勢
- 主要作物種植面積
- 田間作物
- 園藝作物
- 平均養分施用量
- 微量營養素
- 田間作物
- 園藝作物
- 主要營養素
- 田間作物
- 園藝作物
- 次要宏量營養素
- 田間作物
- 園藝作物
- 微量營養素
- 灌溉農田
- 法律規範
- 價值鍊和通路分析
第5章市場區隔
- 類型
- 複合型
- 直的
- 微量營養素
- 硼
- 銅
- 鐵
- 錳
- 鉬
- 鋅
- 其他
- 氮
- 硝酸銨
- 尿素
- 其他
- 磷酸
- DAP
- MAP
- SSP
- TSP
- 其他
- 鉀
- MoP
- SoP
- 其他
- 次要營養物質
- 鈣
- 鎂
- 硫
- 形式
- 傳統的
- 特別的
- CRF
- 液體肥料
- SRF
- 水溶性
- 施肥方式
- 受精
- 葉面噴布
- 土壤
- 作物類型
- 田間作物
- 園藝作物
- 草坪和觀賞植物
- 原產地
- 奈及利亞
- 沙烏地阿拉伯
- 南非
- 土耳其
- 其他中東和非洲地區
第6章競爭格局
- 關鍵策略趨勢
- 市場佔有率分析
- 商業狀況
- 公司簡介
- Foskor
- Gavilon South Africa(MacroSource, LLC)
- Golden Fertilizer Company Limited
- ICL Group Ltd
- K+S Aktiengesellschaft
- Kynoch Fertilizer
- SABIC Agri-Nutrients Co.
- Safsulphur
- Unikeyterra Chemical
- Yara International ASA
第7章:CEO面臨的關鍵策略問題
第 8 章 附錄
- 世界概況
- 概述
- 五力分析框架
- 全球價值鏈分析
- 市場動態(DRO)
- 資訊來源及延伸閱讀
- 圖片列表
- 關鍵見解
- 數據包
- 詞彙表
The Middle East & Africa Fertilizers Market size is estimated at 54.77 billion USD in 2025, and is expected to reach 77.84 billion USD by 2030, growing at a CAGR of 7.28% during the forecast period (2025-2030).
Field crops dominated the market owing to their larger cultivation area
- The overall fertilizer market is estimated to register a CAGR of 7.0% from 2023 to 2030. Agriculture is by far the single most important economic activity in Africa. It provides employment for about two-thirds of the continent's working population, and for each country, it contributes an average of 30-60% of the gross domestic product and 30.0% of the value of exports.
- Africa is regarded as a key center of agricultural production because of the availability of arable land. However, only 6.0% of cultivated land in Africa is irrigated. In 2018, Sub-Saharan Africa's average fertilizer consumption stood at 17.0 kg of nutrients per hectare, significantly lower than the global average of 135.0 kg/ha.
- The Middle East predominantly cultivates staple crops like wheat and barley. Additionally, Egypt and Saudi Arabia lead in the production of rice, maize, lentils, chickpeas, vegetables, and fruits. Africa, on the other hand, boasts a diverse vegetable range, including tomatoes, onions, cabbages, peppers, okra, eggplants, and cucumbers. Notably, tomatoes and onions thrive in abundance along North Africa's coastal regions. Africa's notable beverage crops encompass tea, coffee, cocoa, and grapes.
- While the agricultural sector plays a pivotal role in economic and social development, it has not garnered sufficient attention from policymakers and stakeholders in the MENA region. Despite its modest GDP contribution, agriculture holds strategic importance for sustainable development in MENA countries, which is expected to fuel the fertilizers market in the coming years.
The growing population and concern regarding food security need to be addressed through fertilizer use in the region, drive the market
- The fertilizer market in the region is being propelled by factors such as a growing population, the need to ensure food security, the adoption of intensive agricultural practices, and nutrient deficiencies in regional soils. It is projected to witness a value CAGR of 7.0% during 2023-2030.
- Africa, with its vast arable land, boasts the highest population on the continent. For instance, the Sub-Saharan African region is home to 13% of the global population and controls roughly 20% of the world's agricultural land. However, the region grapples with significant food insecurity, largely due to its increasing reliance on fertilizers.
- Nigeria leads the fertilizer market in Africa, commanding a share of 12.7% in 2022. With over 70 blending plants and major urea production facilities, the country is poised to become a fertilizer powerhouse, even competing globally in the urea market. This surge in production has led to cost reductions and increased availability, driving higher adoption rates among farmers.
- The Middle East, known for its unfavorable climatic conditions for farming, heavily relies on fertilizer imports to meet its domestic needs. Consequently, the region witnesses a comparatively higher adoption of fertilizers to cater to both domestic and international demands.
- While fertilizers offer economic benefits and can boost yields sustainably, their usage is on the rise due to challenges like limited availability and adverse environmental conditions. The region's imperative to address the needs of a growing population and ensure food security further fuels the market's growth.
Middle East & Africa Fertilizers Market Trends
Deterioration of both rain-fed and irrigated lands due to erosion caused by wind and water will pose a challenge in cultivating crops in the region.
- In the Middle East and Africa, field crops such as corn, rice, sorghum, and soybeans are typically planted between April and May and harvested from September to October. The agricultural sector in this region faces significant challenges. Land and water resources are scarce, and both rain-fed and irrigated lands are deteriorating due to erosion from wind and water, exacerbated by unsustainable farming practices. Field crops dominate the agricultural landscape, occupying around 90% of the total agricultural land in the region. In 2022, the cultivation area for field crops reached 249 million hectares, marking a 3.9% increase from 2017. Corn alone commands a significant share, covering 17.8% of the total field crop area. Wheat cultivation also saw a notable increase, with a 4.6% increase from 2017 to 2022. Specifically, the corn cultivation area in the region reached 44.3 million hectares in 2022.
- In Africa, Nigeria takes the lead as the top sorghum producer, closely followed by Ethiopia. Sorghum, a staple cereal crop, dominates the agricultural landscape in Nigeria, accounting for 50% of the total cereal output and occupying approximately 45% of the land dedicated to cereal production. Sorghum's resilience to drought and waterlogging, coupled with its adaptability to diverse soil conditions, makes it a preferred choice for food and income security in the drier regions of the Middle East and Africa.
- The region's population has surged by over 23% in the past decade. While food imports are projected to rise due to limited production capacity, the agricultural industry has shown consistent growth, paralleled by an expansion in cultivated land.
The arid climate leads to a faster depletion of nitrogen in the soil, making it a crucial nutrient for agricultural productivity.
- Nitrogen, phosphorous, and potassium are primary nutrients crucial for plant growth. Nitrogen and phosphorous are integral to proteins and nucleic acids, key components of plant tissue. Meanwhile, potassium significantly influences the quality of harvested crops. Field crops, on average, receive an application rate of 174.4 kg per hectare for these primary nutrients.
- Specifically, the average application rates for nitrogen, phosphorous, and potassium in field crops across the Middle East & Africa stood at 234.8 kg/hectare, 127.4 kg/hectare, and 161.0 kg/hectare, respectively. The Middle East & Africa predominantly cultivate major field crops like wheat, sorghum, rice, and corn. In 2022, the average application rates for primary nutrients in these crops were 144.5 kg/hectare, 162.9 kg/hectare, 152.6 kg/hectare, and 245.24 kg/hectare, respectively.
- Of the primary nutrients, nitrogen dominates consumption in the Middle East & Africa, reaching 1.7 million metric tons in 2022. Nitrogen is the most crucial nutrient for crop yields, and given the prevalent deficiency of nitrogen in regional soils, it has become the most widely applied fertilizer. This dominance is driven by the region's substantial field crop area, comprising around 95.0% of the total, and the resulting high demand for primary nutrients. This emphasis on self-sufficiency and reducing import reliance underscores the growing market for field crops in the region.
Middle East & Africa Fertilizers Industry Overview
The Middle East & Africa Fertilizers Market is fragmented, with the top five companies occupying 7.92%. The major players in this market are Golden Fertilizer Company Limited, ICL Group Ltd, K+S Aktiengesellschaft, SABIC Agri-Nutrients Co. and Yara International ASA (sorted alphabetically).
Additional Benefits:
- The market estimate (ME) sheet in Excel format
- 3 months of analyst support
TABLE OF CONTENTS
1 EXECUTIVE SUMMARY & KEY FINDINGS
2 REPORT OFFERS
3 INTRODUCTION
- 3.1 Study Assumptions & Market Definition
- 3.2 Scope of the Study
- 3.3 Research Methodology
4 KEY INDUSTRY TRENDS
- 4.1 Acreage Of Major Crop Types
- 4.1.1 Field Crops
- 4.1.2 Horticultural Crops
- 4.2 Average Nutrient Application Rates
- 4.2.1 Micronutrients
- 4.2.1.1 Field Crops
- 4.2.1.2 Horticultural Crops
- 4.2.2 Primary Nutrients
- 4.2.2.1 Field Crops
- 4.2.2.2 Horticultural Crops
- 4.2.3 Secondary Macronutrients
- 4.2.3.1 Field Crops
- 4.2.3.2 Horticultural Crops
- 4.2.1 Micronutrients
- 4.3 Agricultural Land Equipped For Irrigation
- 4.4 Regulatory Framework
- 4.5 Value Chain & Distribution Channel Analysis
5 MARKET SEGMENTATION (includes market size in Value in USD and Volume, Forecasts up to 2030 and analysis of growth prospects)
- 5.1 Type
- 5.1.1 Complex
- 5.1.2 Straight
- 5.1.2.1 Micronutrients
- 5.1.2.1.1 Boron
- 5.1.2.1.2 Copper
- 5.1.2.1.3 Iron
- 5.1.2.1.4 Manganese
- 5.1.2.1.5 Molybdenum
- 5.1.2.1.6 Zinc
- 5.1.2.1.7 Others
- 5.1.2.2 Nitrogenous
- 5.1.2.2.1 Ammonium Nitrate
- 5.1.2.2.2 Urea
- 5.1.2.2.3 Others
- 5.1.2.3 Phosphatic
- 5.1.2.3.1 DAP
- 5.1.2.3.2 MAP
- 5.1.2.3.3 SSP
- 5.1.2.3.4 TSP
- 5.1.2.3.5 Others
- 5.1.2.4 Potassic
- 5.1.2.4.1 MoP
- 5.1.2.4.2 SoP
- 5.1.2.4.3 Others
- 5.1.2.5 Secondary Macronutrients
- 5.1.2.5.1 Calcium
- 5.1.2.5.2 Magnesium
- 5.1.2.5.3 Sulfur
- 5.2 Form
- 5.2.1 Conventional
- 5.2.2 Speciality
- 5.2.2.1 CRF
- 5.2.2.2 Liquid Fertilizer
- 5.2.2.3 SRF
- 5.2.2.4 Water Soluble
- 5.3 Application Mode
- 5.3.1 Fertigation
- 5.3.2 Foliar
- 5.3.3 Soil
- 5.4 Crop Type
- 5.4.1 Field Crops
- 5.4.2 Horticultural Crops
- 5.4.3 Turf & Ornamental
- 5.5 Country
- 5.5.1 Nigeria
- 5.5.2 Saudi Arabia
- 5.5.3 South Africa
- 5.5.4 Turkey
- 5.5.5 Rest of Middle East & Africa
6 COMPETITIVE LANDSCAPE
- 6.1 Key Strategic Moves
- 6.2 Market Share Analysis
- 6.3 Company Landscape
- 6.4 Company Profiles
- 6.4.1 Foskor
- 6.4.2 Gavilon South Africa (MacroSource, LLC)
- 6.4.3 Golden Fertilizer Company Limited
- 6.4.4 ICL Group Ltd
- 6.4.5 K+S Aktiengesellschaft
- 6.4.6 Kynoch Fertilizer
- 6.4.7 SABIC Agri-Nutrients Co.
- 6.4.8 Safsulphur
- 6.4.9 Unikeyterra Chemical
- 6.4.10 Yara International ASA
7 KEY STRATEGIC QUESTIONS FOR FERTILIZER CEOS
8 APPENDIX
- 8.1 Global Overview
- 8.1.1 Overview
- 8.1.2 Porter's Five Forces Framework
- 8.1.3 Global Value Chain Analysis
- 8.1.4 Market Dynamics (DROs)
- 8.2 Sources & References
- 8.3 List of Tables & Figures
- 8.4 Primary Insights
- 8.5 Data Pack
- 8.6 Glossary of Terms
 2026年全球生物炭肥料市場報告
 幾丁質肥料市場:2026-2032年全球市場預測(按應用、類型、原料、配方和分銷管道分類)肥料包膜市場:2026-2032年全球市場預測(以包膜化學、釋放機制、包膜養分類型、外形規格、製造流程、最終用途及通路分類)化肥市場:2026-2032年全球市場預測(依產品類型、作物類型、包裝、施用方法、最終用戶和分銷管道分類)藻類肥料市場:2026-2032年全球市場預測(依原料、產品類型、通路及應用分類)複合肥料市場:按產品類型、作物類型、物理形態和應用分類的全球市場預測,2026-2032年顆粒肥料市場:依產品類型、作物類型、配方類型、施用方法、包裝類型、使用時間、最終用戶和銷售管道分類-2026-2032年全球預測
 矽肥市場報告:按類型、形態、應用和地區分類(2026-2034年)
 ATS肥料市場規模、佔有率和成長分析:按產品類型、形態、應用、作物類型、最終用戶、分銷管道和地區分類 - 2026-2033年行業預測
 美國化肥:市場佔有率分析、產業趨勢與統計、成長預測(2026-2031)