


 |
市場調查報告書
商品編碼
1693543
南美肥料:市場佔有率分析、行業趨勢和成長預測(2025-2030 年)South America Fertilizers - Market Share Analysis, Industry Trends & Statistics, Growth Forecasts (2025 - 2030) |
||||||
價格
※ 本網頁內容可能與最新版本有所差異。詳細情況請與我們聯繫。
簡介目錄
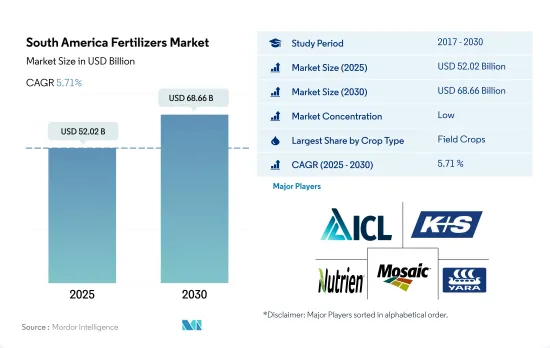
預計 2025 年南美肥料市場規模將達到 520.2 億美元,到 2030 年將達到 686.6 億美元,預測期內(2025-2030 年)的複合年成長率為 5.71%。
由於天氣模式變化和土壤養分缺乏加劇,肥料市場可望成長
- 按作物類型分類,整個肥料市場規模估計為 481 億美元,預計 2023-2030 年期間的複合年成長率為 5.6%。就數量而言,總消費量估計為 6,400 萬噸,2023 年至 2030 年的複合年成長率為 3.3%。
- 依作物類型分類,田間作物佔94.5%,其次是園藝作物,佔5.5%。作物和田間作物對該國的貿易和消費都作物,國內外需求的不斷成長推動了這一領域的成長。
- 預計2023年至2030年期間田間作物種植面積的複合年成長率為2.2%。該國種植大豆、玉米和小麥等重要作物,並積極進口化肥以滿足國內需求。
- 因此,美國、智利和拉丁美洲國家之間的自由貿易協定(FTA)是過去幾十年來南美國家水果和蔬菜產量成長的主要因素。這些自由貿易協定包括北美自由貿易組織(NAFTA)(USMCA)、中美洲自由貿易協定-多明尼加共和國以及與智利、哥倫比亞、巴拿馬和秘魯等國的雙邊協定,預計將進一步刺激該地區的化肥需求。
- 南美肥料市場的成長受到多種因素的推動,包括滿足日益成長的需求、提高作物產量和品質以及增加產量。因此,預計 2023 年至 2030 年市場規模的複合年成長率將達到 3.3%。
巴西由於黃豆等主要作物種植面積較大,化肥消費量佔比較高。
- 巴西佔南美洲國內化肥消費量的73.0%,是該地區化肥使用量最高的國家。巴西市場主要由實用肥料驅動,2022 年將佔 95.2% 的絕對佔有率。其餘 4.8% 為專用肥料。
- 阿根廷是全球小麥和大豆出口國,農業對阿根廷 GDP 的貢獻率約 5.9%。 2022年,阿根廷將佔南美肥料市場的14.6%。與巴西一樣,實踐肥料佔了96.1%的市場佔有率,專用肥料佔3.9%。在特種肥料領域,液體肥料佔據主導地位,佔44.7%,其次是水溶性肥料,佔52.6%。
- 2022 年,除巴西和阿根廷外,南美洲其他地區佔據化肥市場的 14.8%。田間作物佔 83.1% 的市場佔有率,2022 年達到 815 萬噸。預測顯示,到 2030 年,這一數量將增加至 1,053 萬噸,開始顯著的成長軌跡。
- 2022年,大豆、玉米、甘蔗等田間作物佔據了南美肥料市場的主導地位,佔據了94.2%的市場佔有率。這些作物在過去二十年中經歷了顯著的成長,預計未來將繼續成長。隨著巴西等國家擴大種植面積並努力提高產量,預計這一趨勢將持續下去。
- 受人口成長和隨之而來的糧食需求激增的推動,南美洲主糧作物種植面積穩定擴大。這一趨勢表明該地區的肥料市場預計將在 2023-2030 年期間成長。
南美洲肥料市場趨勢
政府為自給自足所做的努力對田間作物作物種植面積的增加做出了巨大貢獻。
- 南美洲田間作物種植面積明顯增加,從2017年的1.116億公頃躍升至2022年的1.261億公頃,總面積增加12.8%。預計種植面積的擴大將刺激該地區的化肥需求。田間作物佔據市場主導地位,佔96.8%的佔有率。 2022年,巴西將佔最大佔有率,為56.9%,其次是阿根廷,為29.3%。巴西是全球大豆生產和出口大國,2021年大豆產量約1.35億噸,其中出口1.055億噸,佔82%。其中,出口產品中,82%為生豆,16%為豆餅,2%為豆油。
- 大豆是南美洲種植面積最大的作物,主要產地為巴西(64.4%)和阿根廷(26.1%)。然而,該地區目前正遭受長期乾旱,主要河流的水位處於危險的低點。這造成了嚴重後果,擾亂了重要夏季作物(尤其是大豆)的收成和運輸。因此,這種情況增加了南美洲增加化學肥料施用的需求。
- 受全球強勁需求和良好盈利的推動,南方共同市場地區的大豆種植蓬勃發展。大豆及其他原料價格高企,促使生產商投資新土地和設備,進而擴大改善經營。因此,該地區田間作物種植面積將隨著國內和國際市場的成長而擴大。
南美洲田間作物平均一次養分施用量約172.73公斤/公頃。
- 在過去的二十年裡,南美洲已經成為田間作物生產的主要參與者。對於大豆、玉米、小麥和玉米來說尤其如此。產量的激增是由於耕地面積的擴大和提高產量的力度加大。值得注意的是,巴西等國家正積極擴大種植面積,這意味著作物產量將進一步增加,化肥消費量也將隨之增加。
- 營養素對於植物健康、作物生長和作物產量至關重要。氮、磷、鉀是主要營養元素,是植物生長發育的基本成分。這些營養物質的缺乏會對作物的產量和品質產生重大影響,凸顯了它們對田間作物的重要性。 2022年,南美洲田間作物大量營養元素的平均施用率為172.7公斤/公頃。其中氮肥用量最高,193.8公斤/公頃,其次是鉀肥,181.9公斤/公頃。磷含量略為落後,為142.4公斤/公頃。
- 在田間作物中,小麥、水稻和玉米預計平均養分施用量最高。具體來說,小麥的平均養分施用量預計為每公頃231公斤,水稻和玉米的平均養分施用量預計分別為每公頃156公斤和149公斤。受人口成長和隨之而來的主糧作物需求的推動,南美洲的收穫面積正在擴大。這一趨勢表明,未來幾年該地區田間作物的主要養分使用量將大幅增加。
南美洲肥料產業概況
南美肥料市場細分化,前五大企業佔37.12%。該市場的主要企業包括 ICL Group Ltd、K+S Aktiengesellschaft、Nutrien Ltd.、The Mosaic Company、Yara International ASA 等。
其他福利
- Excel 格式的市場預測 (ME) 表
- 3個月的分析師支持
目錄
第1章執行摘要和主要發現
第2章 報告要約
第3章 引言
- 研究假設和市場定義
- 研究範圍
- 調查方法
第4章 產業主要趨勢
- 主要作物種植面積
- 田間作物
- 園藝作物
- 平均養分施用量
- 微量營養素
- 田間作物
- 園藝作物
- 主要營養素
- 田間作物
- 園藝作物
- 次要宏量營養素
- 田間作物
- 園藝作物
- 微量營養素
- 灌溉農田
- 法律規範
- 價值鍊和通路分析
第5章市場區隔
- 類型
- 複合型
- 直的
- 微量營養素
- 硼
- 銅
- 鐵
- 錳
- 鉬
- 鋅
- 其他
- 氮
- 硝酸銨
- 尿素
- 其他
- 磷酸
- DAP
- MAP
- SSP
- TSP
- 其他
- 鉀
- MoP
- SoP
- 其他
- 次要營養物質
- 鈣
- 鎂
- 硫
- 形式
- 傳統的
- 特別的
- CRF
- 液體肥料
- SRF
- 水溶性
- 施肥方式
- 受精
- 葉面噴布
- 土壤
- 作物類型
- 田間作物
- 園藝作物
- 草坪和觀賞植物
- 原產地
- 阿根廷
- 巴西
- 南美洲其他地區
第6章 競爭格局
- 關鍵策略趨勢
- 市場佔有率分析
- 商業狀況
- 公司簡介
- Fertgrow
- Grupa Azoty SA(Compo Expert)
- Haifa Group
- ICL Group Ltd
- K+S Aktiengesellschaft
- Nortox
- Nutrien Ltd.
- Sociedad Quimica y Minera de Chile SA
- The Mosaic Company
- Yara International ASA
第7章:CEO面臨的關鍵策略問題
第 8 章 附錄
- 世界概況
- 概述
- 五力分析框架
- 全球價值鏈分析
- 市場動態(DRO)
- 資訊來源及延伸閱讀
- 圖片列表
- 關鍵見解
- 數據包
- 詞彙表
簡介目錄
Product Code: 92608
The South America Fertilizers Market size is estimated at 52.02 billion USD in 2025, and is expected to reach 68.66 billion USD by 2030, growing at a CAGR of 5.71% during the forecast period (2025-2030).
The fertilizer market is poised for growth due to shifting climate patterns and rising soil nutrient deficiencies
- The overall fertilizer market value by crop type has accounted for USD 48.1 billion and is estimated to record a CAGR of 5.6% during 2023-2030. By volume, the overall consumption accounted for 64.0 million metric tons and is estimated to record a CAGR of 3.3% during 2023-2030.
- By crop type, field crops are dominating the market by 94.5%, followed by horticultural crops with 5.5% of fertilizer consumption value. Both horticultural and field crops are essential to the country's trade and consumption, and the increased domestic and international demand is bolstering the segment's growth.
- The area under field crop cultivation has increased by a CAGR of 2.2% during 2023-2030. With important crops being cultivated in the country, such as soybean, corn, and wheat, the country is actively importing fertilizers to meet the domestic demand, which is driving the growth of the segments.
- Accordingly, Free trade agreements (FTAs) between the United States, Chile, and several Latin American countries have been a major factor in the increase in fruit and vegetable production in South American countries over the last few decades. These FTAs, including NAFTA (USMCA), CAFTA-DR, and bilateral agreements with countries such as Chile, Colombia, Panama, and Peru, are expected to further boost fertilizer demand in the region.
- The growth of the South American fertilizers market is being driven by various factors, including the need to meet the growing demand, improve crop yield and quality, and increase production. As a result, the market volume is expected to register a CAGR of 3.3% from 2023 to 2030.
Due to higher cultivation areas under major crops like soybeans, fertilizer consumption in Brazil leads to a higher share
- Brazil, accounting for 73.0% of South America's domestic fertilizer consumption, leads the region in fertilizer usage. The Brazilian market is predominantly driven by conventional fertilizers, which held a commanding 95.2% share in 2022. Specialty fertilizers made up the remaining 4.8%.
- Argentina, a global exporter of wheat and soybeans, sees agriculture contributing around 5.9% to its GDP. In 2022, Argentina held a 14.6% share of the South American fertilizer market. Similar to Brazil, conventional fertilizers dominated, capturing 96.1% of the market, while specialty fertilizers accounted for 3.9%. Within the specialty segment, liquid fertilizers led at 44.7%, followed by water-soluble fertilizers at 52.6%.
- The Rest of South America, excluding Brazil and Argentina, held a 14.8% share of the regional fertilizer market in 2022. Field crops, commanding an 83.1% market share by volume, reached 8.15 million metric tons in 2022. Projections indicate this volume will climb to 10.53 million metric tons by 2030, representing a significant growth trajectory.
- Field crops, including soybeans, corn, and sugarcane, dominated the South American fertilizer market in 2022, capturing 94.2% of the market share. These crops have witnessed substantial growth over the past two decades, with further increases expected. Driven by countries like Brazil expanding their cultivated areas and aiming for higher yields, this trend is set to continue.
- Driven by a rising population and the subsequent surge in food grain demand, South America has witnessed a consistent expansion in the area dedicated to major food crops. This trend points to a projected growth in the region's fertilizer market during 2023-2030.
South America Fertilizers Market Trends
The government's initiatives to achieve self-sufficiency have significantly contributed to the increase in the area under field crop cultivation.
- The cultivation area for field crops in South America witnessed a notable rise, surging from 111.6 million ha in 2017 to 126.1 million ha in 2022, marking a 12.8% increase in the total area. This expansion in cultivation is projected to drive up the demand for fertilizers in the region. Field crops dominated the market, accounting for a significant 96.8% share. In 2022, Brazil held the maximum share of the market at 56.9%, with Argentina trailing at 29.3%. Brazil, renowned as the global leader in soy production and exports, saw its soy output reach nearly 135 million tonnes in 2021. Of this, a whopping 105.5 million tonnes, constituting 82%, were exported, with 82% in raw soybean form, 16% as soybean cake, and 2% as soybean oil.
- Soybean, commanding the largest cultivated area in South America, is primarily grown in Brazil (64.4%) and Argentina (26.1%). However, the region is currently grappling with an extended drought, leading to critically low water levels in major rivers. This has severe repercussions, hampering both harvests and the transportation of crucial summer crops, especially soybeans. Consequently, these conditions are amplifying the demand for increased fertilizer application in South America.
- Driven by robust global demand and favorable profitability, soybean cultivation in the Mercosur region witnessed a surge. The surge in soy prices, along with other raw materials, has incentivized producers to invest in new lands and equipment, enabling them to scale up operations and enhance efficiency. As a result, the field crop cultivation area in the region is poised to expand in tandem with the growing domestic and international markets.
The average rate of primary nutrient application for field crops in South America is about 172.73 kg/hectare
- Over the past two decades, South America has emerged as a key player in field crop production, notably for soybeans, corn, wheat, and maize. This surge in production can be attributed to both expanded cultivation and intensified efforts to boost yields. Notably, countries like Brazil are actively expanding their cultivated areas, indicating a further uptick in crop production and a subsequent surge in fertilizer consumption.
- Nutrients are pivotal for plant health, crop growth, and crop output. Primary nutrients, namely nitrogen, phosphorus, and potassium, serve as the fundamental building blocks for plant development. Any deficiency in these nutrients can significantly impact both crop yield and quality, underscoring their importance for field crops. In 2022, the average application rate of primary nutrients for field crops in South America stood at 172.7 kg/hectare. Nitrogen topped the list with an application rate of 193.8 kg/hectare, followed by potassium at 181.9 kg/hectare. Phosphorus trailed slightly behind, with an application rate of 142.4 kg/hectare.
- Among the field crops, wheat, rice, and corn/maize are expected to have the highest average nutrient application rate. Specifically, wheat is projected to have an average nutrient application rate of 231 kg/ha, while rice and corn/maize are estimated to have average rates of 156 kg/ha and 149 kg/ha, respectively. Driven by a growing population and subsequent demand for major food crops, South America has witnessed an expansion in harvested areas. This trend points to a significant uptick in primary nutrient usage for field crops in the region in the coming years.
South America Fertilizers Industry Overview
The South America Fertilizers Market is fragmented, with the top five companies occupying 37.12%. The major players in this market are ICL Group Ltd, K+S Aktiengesellschaft, Nutrien Ltd., The Mosaic Company and Yara International ASA (sorted alphabetically).
Additional Benefits:
- The market estimate (ME) sheet in Excel format
- 3 months of analyst support
TABLE OF CONTENTS
1 EXECUTIVE SUMMARY & KEY FINDINGS
2 REPORT OFFERS
3 INTRODUCTION
- 3.1 Study Assumptions & Market Definition
- 3.2 Scope of the Study
- 3.3 Research Methodology
4 KEY INDUSTRY TRENDS
- 4.1 Acreage Of Major Crop Types
- 4.1.1 Field Crops
- 4.1.2 Horticultural Crops
- 4.2 Average Nutrient Application Rates
- 4.2.1 Micronutrients
- 4.2.1.1 Field Crops
- 4.2.1.2 Horticultural Crops
- 4.2.2 Primary Nutrients
- 4.2.2.1 Field Crops
- 4.2.2.2 Horticultural Crops
- 4.2.3 Secondary Macronutrients
- 4.2.3.1 Field Crops
- 4.2.3.2 Horticultural Crops
- 4.2.1 Micronutrients
- 4.3 Agricultural Land Equipped For Irrigation
- 4.4 Regulatory Framework
- 4.5 Value Chain & Distribution Channel Analysis
5 MARKET SEGMENTATION (includes market size in Value in USD and Volume, Forecasts up to 2030 and analysis of growth prospects)
- 5.1 Type
- 5.1.1 Complex
- 5.1.2 Straight
- 5.1.2.1 Micronutrients
- 5.1.2.1.1 Boron
- 5.1.2.1.2 Copper
- 5.1.2.1.3 Iron
- 5.1.2.1.4 Manganese
- 5.1.2.1.5 Molybdenum
- 5.1.2.1.6 Zinc
- 5.1.2.1.7 Others
- 5.1.2.2 Nitrogenous
- 5.1.2.2.1 Ammonium Nitrate
- 5.1.2.2.2 Urea
- 5.1.2.2.3 Others
- 5.1.2.3 Phosphatic
- 5.1.2.3.1 DAP
- 5.1.2.3.2 MAP
- 5.1.2.3.3 SSP
- 5.1.2.3.4 TSP
- 5.1.2.3.5 Others
- 5.1.2.4 Potassic
- 5.1.2.4.1 MoP
- 5.1.2.4.2 SoP
- 5.1.2.4.3 Others
- 5.1.2.5 Secondary Macronutrients
- 5.1.2.5.1 Calcium
- 5.1.2.5.2 Magnesium
- 5.1.2.5.3 Sulfur
- 5.2 Form
- 5.2.1 Conventional
- 5.2.2 Speciality
- 5.2.2.1 CRF
- 5.2.2.2 Liquid Fertilizer
- 5.2.2.3 SRF
- 5.2.2.4 Water Soluble
- 5.3 Application Mode
- 5.3.1 Fertigation
- 5.3.2 Foliar
- 5.3.3 Soil
- 5.4 Crop Type
- 5.4.1 Field Crops
- 5.4.2 Horticultural Crops
- 5.4.3 Turf & Ornamental
- 5.5 Country
- 5.5.1 Argentina
- 5.5.2 Brazil
- 5.5.3 Rest of South America
6 COMPETITIVE LANDSCAPE
- 6.1 Key Strategic Moves
- 6.2 Market Share Analysis
- 6.3 Company Landscape
- 6.4 Company Profiles
- 6.4.1 Fertgrow
- 6.4.2 Grupa Azoty S.A. (Compo Expert)
- 6.4.3 Haifa Group
- 6.4.4 ICL Group Ltd
- 6.4.5 K+S Aktiengesellschaft
- 6.4.6 Nortox
- 6.4.7 Nutrien Ltd.
- 6.4.8 Sociedad Quimica y Minera de Chile SA
- 6.4.9 The Mosaic Company
- 6.4.10 Yara International ASA
7 KEY STRATEGIC QUESTIONS FOR FERTILIZER CEOS
8 APPENDIX
- 8.1 Global Overview
- 8.1.1 Overview
- 8.1.2 Porter's Five Forces Framework
- 8.1.3 Global Value Chain Analysis
- 8.1.4 Market Dynamics (DROs)
- 8.2 Sources & References
- 8.3 List of Tables & Figures
- 8.4 Primary Insights
- 8.5 Data Pack
- 8.6 Glossary of Terms
02-2729-4219
+886-2-2729-4219
 緩釋肥料市場:2026-2032年全球市場預測(以包膜類型、作物類型、釋放週期、養分類型、施用方法、最終用途和銷售管道)
 2026年全球生物炭肥料市場報告幾丁質肥料市場:2026-2032年全球市場預測(按應用、類型、原料、配方和分銷管道分類)肥料包膜市場:2026-2032年全球市場預測(以包膜化學、釋放機制、包膜養分類型、外形規格、製造流程、最終用途及通路分類)化肥市場:2026-2032年全球市場預測(依產品類型、作物類型、包裝、施用方法、最終用戶和分銷管道分類)
 海藻土壤改良劑市場預測至 2034 年—按產品類型、海藻種類、形態、應用、養殖方法、通路和地區進行全球分析。藻類肥料市場:2026-2032年全球市場預測(依原料、產品類型、通路及應用分類)複合肥料市場:按產品類型、作物類型、物理形態和應用分類的全球市場預測,2026-2032年顆粒肥料市場:依產品類型、作物類型、配方類型、施用方法、包裝類型、使用時間、最終用戶和銷售管道分類-2026-2032年全球預測
 矽肥市場報告:按類型、形態、應用和地區分類(2026-2034年)
▼