


 |
市場調查報告書
商品編碼
1693542
亞太化肥:市場佔有率分析、產業趨勢與成長預測(2025-2030 年)Asia-Pacific Fertilizers - Market Share Analysis, Industry Trends & Statistics, Growth Forecasts (2025 - 2030) |
||||||
價格
※ 本網頁內容可能與最新版本有所差異。詳細情況請與我們聯繫。
簡介目錄
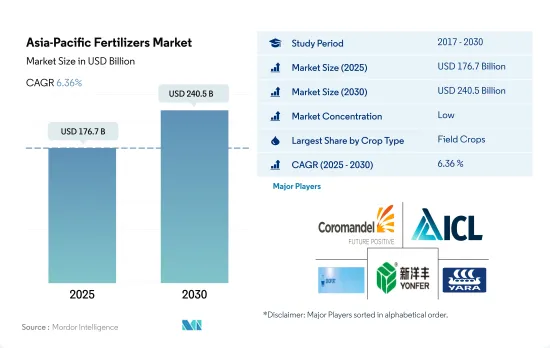
預計 2025 年亞太肥料市場規模為 1,767 億美元,到 2030 年將達到 2,405 億美元,預測期內(2025-2030 年)的複合年成長率為 6.36%。
集約化耕作和土壤養分消耗增加化肥消耗
- 亞太地區肥料市場以田間作物為主,約佔整個肥料市場的81.5%。田間作物產量佔該地區農業用地總面積的90.0%以上。該地區主要種植的田間作物、小麥、大豆、油菜籽和棉花。田間作物通常消耗最多的氮肥。穀物和穀類的種植密度很高,這會耗盡土壤養分,需要使用大量肥料來補充。
- 2022年,園藝作物佔該地區肥料市值的17.9%。中國和印度佔該地區園藝作物生產面積的70.0%以上。對新鮮水果和蔬菜的需求不斷增加,加上滿足這種需求的努力,將推動園藝作物市場的發展。
- 中國和印度擁有豐富的耕地和眾多的人口,是亞太地區農業的主要參與企業。政府對農業機械化和生產力提高的大量資金支持進一步支撐了這一成長軌跡。
- 該地區的耕地面積正在大幅增加,預計2017年至2022年將增加1,050萬公頃。農業是亞太地區經濟的重要貢獻者,為該地區五分之一的人口提供就業,涵蓋該地區一半以上的土地面積。糧食安全的提高,加上氣候條件的變化和土壤養分的挑戰,將刺激該地區的化肥市場。
人口成長導致的糧食產量和生產力的提高可能會推動市場
- 根據美國農業部的數據,中國是全球最大的化肥生產國和出口國,佔全球化肥產量的25%。 2022年中國化肥市場規模為703億美元,消費量為9,420萬噸。
- 印度是世界第二大化肥消費國,2022 年化肥消費量將達 8,140 萬噸。儘管印度是世界第三大生產國,但每年仍有 25% 的尿素、55% 的磷和 100% 的鉀需要進口。
- 印尼農業領域正在大幅擴張,耕地面積不斷增加。該國的農業產量因此增加,並成為該地區農業的重要組成部分。因此,印尼是該地區市場價值和消費量的第三大消費國,佔該地區市場價值的 5.6% 和消費量的 6.7%。
- 2022年,巴基斯坦在亞太化肥市場佔有4.2%的佔有率。田間作物佔肥料消費量的86.3%,其次是園藝作物,佔13.5%,草皮和觀賞作物僅佔0.1%。這種趨勢是由於田間作物種植面積擴大所致。
- 人口成長對糧食產量和生產力的要求更高,尤其是可供耕種的面積不斷減少等因素預計將推動市場的發展。此外,採用先進的耕作方法將增加常規肥料和專用肥料的使用。
亞太地區肥料市場趨勢
種植面積的增加是由於國內和出口需求的增加。
- 亞洲和太平洋地區種植田間作物,佔總耕地面積的 95% 以上。水稻、小麥和玉米是該地區的主要田間作物,到2022年,這三種作物的種植面積總合該地區總種植面積的38%。預計種植面積的增加將增加該國對化肥的需求。
- 亞太地區包括中國、印度、巴基斯坦和澳大利亞,是世界上最大的小麥生產區之一。中國和印度分別是世界上最大的小麥生產國和消費國。小麥是該地區的主要主食之一,推動了需求和消費的成長。值得注意的是,2018年至2022年間,小麥種植面積增加了63.86萬公頃。 2022年,中國小麥產量為1.38億噸,成為全球最大的小麥生產國,而印度的小麥產量為1.03億噸。
- 水稻是該地區最大的田間作物。到2022年,光是耕地面積就將占到農業用地總面積的約16.44%。水稻是亞洲和太平洋大部分地區的主食。預計2022年中國米產量為1.47億噸,印度米產量為1.24億噸。印度的消費量預計將達到 1.09 億噸,出口量將達到 1,950 萬噸,位居世界第一。
- 國內外對田間作物的需求迅速成長,促進了田間作物面積的擴大。預計耕地面積的大幅增加將在2023年至2030年期間對亞太地區化肥市場產生直接正面的影響。
全球農地氧化亞氮排放有28%來自中國農地。
- 2022年中國田間作物主要養分(氮、鉀、磷)平均施用量為129.1公斤/公頃,其中氮佔58.5%,鉀佔25.3%,磷佔16.1%。主要營養物質主要透過土壤方法施用。 2022 年,傳統土壤基主要營養素肥料佔據主要營養素肥料市場的主導佔有率,為 69.2%。
- 由於亞洲土壤普遍缺乏基本養分,尤其是氮肥和鉀肥,因此該地區對基本養分的需求很高。值得注意的是,亞太地區幅員遼闊,人口眾多,農藥生產和消費量居世界之冠。光是中國農地就占到全球農地氧化亞氮排放的約28%。
- 在田間作物中,小麥在 2022 年的平均主要養分施用量最高,為 214.9 公斤/公頃。在主要養分中,氮肥施用量最高,平均施用量為448.5公斤/公頃。對氮的需求如此之高是因為氮在植物代謝中的重要作用以及它存在於葉綠素和氨基酸中。
- 地表水和地下水受到氮和磷的污染,與施肥量指導不當以及作物產量過高有關。然而,人們已經明顯轉向採用高效肥料。
亞太化肥產業概況
亞太化肥市場細分化,前五大公司佔5.83%。該市場的主要企業包括 Coromandel International Ltd.、ICL Group Ltd、中化化肥控股有限公司、新陽豐農業科技有限公司、Yara International ASA 等。
其他福利
- Excel 格式的市場預測 (ME) 表
- 3個月的分析師支持
目錄
第1章執行摘要和主要發現
第2章 報告要約
第3章 引言
- 研究假設和市場定義
- 研究範圍
- 調查方法
第4章 產業主要趨勢
- 主要作物種植面積
- 田間作物
- 園藝作物
- 平均養分施用量
- 微量營養素
- 田間作物
- 園藝作物
- 主要營養素
- 田間作物
- 園藝作物
- 次要宏量營養素
- 田間作物
- 園藝作物
- 微量營養素
- 灌溉農田
- 法律規範
- 價值鍊和通路分析
第5章市場區隔
- 類型
- 複合型
- 直的
- 微量營養素
- 硼
- 銅
- 鐵
- 錳
- 鉬
- 鋅
- 其他
- 氮
- 硝酸銨
- 無水氨
- 尿素
- 其他
- 磷酸
- DAP
- MAP
- SSP
- TSP
- 其他
- 鉀
- MoP
- SoP
- 其他
- 次要營養物質
- 鈣
- 鎂
- 硫
- 形式
- 傳統的
- 特別的
- CRF
- 液體肥料
- SRF
- 水溶性
- 施肥方式
- 受精
- 葉面噴布
- 土壤
- 作物類型
- 田間作物
- 園藝作物
- 草坪和觀賞植物
- 原產地
- 澳洲
- 孟加拉
- 中國
- 印度
- 印尼
- 日本
- 巴基斯坦
- 菲律賓
- 泰國
- 越南
- 其他亞太地區
第6章競爭格局
- 關鍵策略趨勢
- 市場佔有率分析
- 商業狀況
- 公司簡介
- Coromandel International Ltd.
- Grupa Azoty SA(Compo Expert)
- Haifa Group
- Hebei Sanyuanjiuqi Fertilizer Co., Ltd.
- ICL Group Ltd
- Sinofert Holdings Limited
- Sociedad Quimica y Minera de Chile SA
- Xinyangfeng Agricultural Technology Co., Ltd.
- Yara International ASA
- Zhongchuang xingyuan chemical technology co.ltd
第7章:CEO面臨的關鍵策略問題
第 8 章 附錄
- 世界概況
- 概述
- 五力分析框架
- 全球價值鏈分析
- 市場動態(DRO)
- 資訊來源及延伸閱讀
- 圖片列表
- 關鍵見解
- 數據包
- 詞彙表
簡介目錄
Product Code: 92607
The Asia-Pacific Fertilizers Market size is estimated at 176.7 billion USD in 2025, and is expected to reach 240.5 billion USD by 2030, growing at a CAGR of 6.36% during the forecast period (2025-2030).
Intensive cultivation and soil nutrient depletion increase fertilizer consumption
- The Asia-Pacific fertilizer market is dominated by field crops, which make up around 81.5% of the overall fertilizer market. Field crop production accounts for more than 90.0% of the region's total agricultural land. The major field crops produced in the region are rice, wheat, soybean, rapeseed/canola, and cotton. Generally, field crops consume the most nitrogen fertilizers. Because grains and cereals are grown intensively, they deplete soil nutrients, necessitating the use of more fertilizers to compensate.
- In 2022, horticultural crops constituted 17.9% of the region's fertilizer market value. China and India command over 70.0% of the horticultural crop production area in the region. The rising demand for fresh fruits and vegetables, coupled with efforts to meet this demand, is poised to propel the horticultural crop market.
- China and India, with their abundant arable land and sizable populations, stand out as key agricultural players in the Asia-Pacific. The government's significant financial support for agricultural mechanization and productivity enhancement further bolsters this growth trajectory.
- The region has witnessed a notable uptick in cultivation area, with a 10.5 million ha expansion from 2017 to 2022. Agriculture employs a fifth of the region's population and occupies more than half of its land, making it a vital contributor to the Asia-Pacific economy. The imperative to enhance food security, coupled with evolving climatic conditions and soil nutrient challenges, is poised to fuel the fertilizer market in the region.
The growing population's need for higher food production and productivity may drive the market
- According to the USDA, China, the world's largest fertilizer producer and exporter, accounted for 25% of global fertilizer production. In 2022, the Chinese fertilizer market was valued at USD 70.3 billion, with a consumption of 94.2 million metric tons.
- India, the world's second-largest fertilizer consumer, consumed 81.4 million metric tons in 2022. Despite being the third-largest global producer, India relies on imports for 25% of its urea, 55% of its phosphorus, and 100% of its potash annually.
- The Indonesian agricultural sector has been experiencing a considerable expansion, which has led to an increase in arable land. This, in turn, has boosted the country's agricultural production, making it an essential player in the region's agricultural industry. As a result, Indonesia has become the third-largest consumer in terms of market value and volume consumption, accounting for 5.6% of the value and 6.7% of volume in the region.
- In 2022, Pakistan held a 4.2% share in the Asia-Pacific fertilizer market. Field crops dominated fertilizer consumption, accounting for 86.3% of the volume, followed by horticultural crops at 13.5% and turf & ornamental crops at a negligible 0.1%. This trend can be attributed to the larger land area dedicated to field crops.
- The market is expected to be driven by factors such as the growing population's need for higher food production and productivity, especially since the area available for cultivation is decreasing. Additionally, the adoption of advanced cultivation methods will increase the usage of both conventional and specialty fertilizers.
Asia-Pacific Fertilizers Market Trends
The increase in cultivation area is attributed to the growing domestic and export demand
- Field crop cultivation dominates the Asia-Pacific region, accounting for more than 95% of the total crop area. Rice, wheat, and corn are the major field crops produced in the region, together accounting for about 38% of the total crop area in 2022. The rising area under cultivation is expected to increase the need for fertilizer usage in the country.
- The Asia-Pacific region, which includes China, India, Pakistan, and Australia, is among the world's largest wheat producers. China and India are also the world's largest wheat producers and consumers. Wheat is one of the major staple foods of this region, driving the increase in demand and consumption. Notably, the area under wheat cultivation increased by 638.6 thousand ha from 2018 to 2022. In 2022, China accounted for the production of 138 million metric tons of wheat, making it the largest wheat producer in the world, and India recorded wheat production of 103 million metric tons.
- Rice is the largest cultivated field crop in the region. Its cultivation alone accounted for about 16.44% of the total agricultural land in 2022. Rice is the staple food of Asia and most parts of the Pacific region. China was projected to produce 147 million tons of rice, and India was expected to harvest 124 million tons of rice in 2022. India was also expected to consume 109 million tons while exporting a world-leading 19.5 million tons.
- The surge in both domestic and international demand for field crops has prompted an expansion in the cultivation area dedicated to these crops. This significant increase in cultivated land is expected to have a direct and positive impact on the Asia-Pacific fertilizer market throughout the 2023-2030 period.
About 28% of nitrous oxide emissions from cropland globally are from Chinese agricultural lands
- The average application rate of primary nutrients (nitrogen, potassium, and phosphorus) in field crops in China stood at 129.1 kg/ha in 2022. Nitrogen dominated the mix, accounting for 58.5%, followed by potassium at 25.3% and phosphorus at 16.1%. The primary nutrients are predominantly applied through soil-based methods. In 2022, conventional soil-based primary macronutrient fertilizers held a commanding 69.2% share of the primary macronutrient fertilizer market.
- Asia witnesses a significant demand for primary nutrients, especially nitrogen and potassium fertilizers, owing to the prevalent deficiencies in these nutrients in the region's soils. Notably, the Asia-Pacific region, with its vast land area and population, leads the global agrochemical production and consumption. China's agricultural lands alone contribute to about 28% of the world's nitrous oxide emissions from croplands.
- Among field crops, wheat recorded the highest average primary nutrient application rate at 214.9 kg/ha in 2022. Nitrogen took the lead among primary nutrients, with an average application rate of 448.5 kg/ha. This high nitrogen demand is attributed to its crucial role in plant metabolism, as well as its presence in chlorophyll and amino acids.
- The contamination of surface and groundwater with nitrogen and phosphorus has been linked to inadequate guidance on fertilizer application rates and the potential for excessive crop yields. However, there is a noticeable shift toward the adoption of highly efficient fertilizers.
Asia-Pacific Fertilizers Industry Overview
The Asia-Pacific Fertilizers Market is fragmented, with the top five companies occupying 5.83%. The major players in this market are Coromandel International Ltd., ICL Group Ltd, Sinofert Holdings Limited, Xinyangfeng Agricultural Technology Co., Ltd. and Yara International ASA (sorted alphabetically).
Additional Benefits:
- The market estimate (ME) sheet in Excel format
- 3 months of analyst support
TABLE OF CONTENTS
1 EXECUTIVE SUMMARY & KEY FINDINGS
2 REPORT OFFERS
3 INTRODUCTION
- 3.1 Study Assumptions & Market Definition
- 3.2 Scope of the Study
- 3.3 Research Methodology
4 KEY INDUSTRY TRENDS
- 4.1 Acreage Of Major Crop Types
- 4.1.1 Field Crops
- 4.1.2 Horticultural Crops
- 4.2 Average Nutrient Application Rates
- 4.2.1 Micronutrients
- 4.2.1.1 Field Crops
- 4.2.1.2 Horticultural Crops
- 4.2.2 Primary Nutrients
- 4.2.2.1 Field Crops
- 4.2.2.2 Horticultural Crops
- 4.2.3 Secondary Macronutrients
- 4.2.3.1 Field Crops
- 4.2.3.2 Horticultural Crops
- 4.2.1 Micronutrients
- 4.3 Agricultural Land Equipped For Irrigation
- 4.4 Regulatory Framework
- 4.5 Value Chain & Distribution Channel Analysis
5 MARKET SEGMENTATION (includes market size in Value in USD and Volume, Forecasts up to 2030 and analysis of growth prospects)
- 5.1 Type
- 5.1.1 Complex
- 5.1.2 Straight
- 5.1.2.1 Micronutrients
- 5.1.2.1.1 Boron
- 5.1.2.1.2 Copper
- 5.1.2.1.3 Iron
- 5.1.2.1.4 Manganese
- 5.1.2.1.5 Molybdenum
- 5.1.2.1.6 Zinc
- 5.1.2.1.7 Others
- 5.1.2.2 Nitrogenous
- 5.1.2.2.1 Ammonium Nitrate
- 5.1.2.2.2 Anhydrous Ammonia
- 5.1.2.2.3 Urea
- 5.1.2.2.4 Others
- 5.1.2.3 Phosphatic
- 5.1.2.3.1 DAP
- 5.1.2.3.2 MAP
- 5.1.2.3.3 SSP
- 5.1.2.3.4 TSP
- 5.1.2.3.5 Others
- 5.1.2.4 Potassic
- 5.1.2.4.1 MoP
- 5.1.2.4.2 SoP
- 5.1.2.4.3 Others
- 5.1.2.5 Secondary Macronutrients
- 5.1.2.5.1 Calcium
- 5.1.2.5.2 Magnesium
- 5.1.2.5.3 Sulfur
- 5.2 Form
- 5.2.1 Conventional
- 5.2.2 Speciality
- 5.2.2.1 CRF
- 5.2.2.2 Liquid Fertilizer
- 5.2.2.3 SRF
- 5.2.2.4 Water Soluble
- 5.3 Application Mode
- 5.3.1 Fertigation
- 5.3.2 Foliar
- 5.3.3 Soil
- 5.4 Crop Type
- 5.4.1 Field Crops
- 5.4.2 Horticultural Crops
- 5.4.3 Turf & Ornamental
- 5.5 Country
- 5.5.1 Australia
- 5.5.2 Bangladesh
- 5.5.3 China
- 5.5.4 India
- 5.5.5 Indonesia
- 5.5.6 Japan
- 5.5.7 Pakistan
- 5.5.8 Philippines
- 5.5.9 Thailand
- 5.5.10 Vietnam
- 5.5.11 Rest of Asia-Pacific
6 COMPETITIVE LANDSCAPE
- 6.1 Key Strategic Moves
- 6.2 Market Share Analysis
- 6.3 Company Landscape
- 6.4 Company Profiles
- 6.4.1 Coromandel International Ltd.
- 6.4.2 Grupa Azoty S.A. (Compo Expert)
- 6.4.3 Haifa Group
- 6.4.4 Hebei Sanyuanjiuqi Fertilizer Co., Ltd.
- 6.4.5 ICL Group Ltd
- 6.4.6 Sinofert Holdings Limited
- 6.4.7 Sociedad Quimica y Minera de Chile SA
- 6.4.8 Xinyangfeng Agricultural Technology Co., Ltd.
- 6.4.9 Yara International ASA
- 6.4.10 Zhongchuang xingyuan chemical technology co.ltd
7 KEY STRATEGIC QUESTIONS FOR FERTILIZER CEOS
8 APPENDIX
- 8.1 Global Overview
- 8.1.1 Overview
- 8.1.2 Porter's Five Forces Framework
- 8.1.3 Global Value Chain Analysis
- 8.1.4 Market Dynamics (DROs)
- 8.2 Sources & References
- 8.3 List of Tables & Figures
- 8.4 Primary Insights
- 8.5 Data Pack
- 8.6 Glossary of Terms
02-2729-4219
+886-2-2729-4219
 2032年化肥市場預測:按類型、配方、技術、分銷管道、應用、最終用戶和地區分類的全球分析
 硼肥市場-全球產業規模、佔有率、趨勢、機會和預測,依來源、應用、區域和競爭格局分類,2020-2030年預測全球糞肥市場-產業規模、佔有率、趨勢、機會及預測,依類型、形態、應用、區域及競爭格局分類,2020-2030年預測昆蟲肥料市場-全球產業規模、佔有率、趨勢、機會和預測,按類型、形態、應用、地區和競爭格局分類,2020-2030年預測海藻肥料市場-全球產業規模、佔有率、趨勢、機會和預測,按形態(液體和粉末)、應用(農場、花園及其他)、地區和競爭格局分類,2020-2030年預測聚合物包膜肥料市場-全球產業規模、佔有率、趨勢、機會和預測,按類型、作物類型、地區和競爭格局分類,2020-2030年預測
 矽肥市場:預測(2025-2030 年)鐵螯合物市場-2025-2030年預測
 膠囊肥料市場依營養成分、釋放機制、作物用途及地區分類
 化肥市場按產品類型、作物類型、包裝、施用方法、最終用戶和分銷管道分類-2025-2032年全球預測
▼