


 |
市場調查報告書
商品編碼
1693557
中國化肥:市場佔有率分析、產業趨勢與統計、成長預測(2025-2030年)China Fertilizers - Market Share Analysis, Industry Trends & Statistics, Growth Forecasts (2025 - 2030) |
||||||
價格
※ 本網頁內容可能與最新版本有所差異。詳細情況請與我們聯繫。
簡介目錄
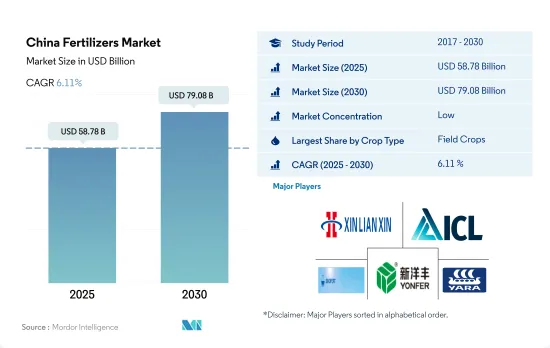
預計 2025 年中國肥料市場規模將達到 587.8 億美元,預計到 2030 年將達到 790.8 億美元,預測期內(2025-2030 年)的複合年成長率為 6.11%。
需要施肥的集約化和單一栽培
- 長期連續耕作而不輪作導致農田肥力下降,導致肥料嚴重短缺,對肥料的需求不斷增加,尤其是中國南方。人們對環境污染的擔憂日益加劇,推動了對田間作物。
- 田間作物往往是氮肥利用率最高的作物。粗放種植會使穀物和穀類消耗土壤養分,因此需要額外施肥來補充養分。在 2022 年田間作物肥料市場總量中,實踐肥料約佔 73.3%,專用肥料約佔 26.7%。
- 園藝作物全年生長,受益於噴灌和滴灌等更好的澆水方式,並且比田間作物更多地使用特種肥料,鼓勵使用水溶性肥料和液體肥料。 2021年,專用肥料約佔園藝作物用肥料市場規模的18.7%。
- 到 2022 年,草坪和觀賞產品將佔國內肥料市場總量的不到 1%。近年來,政府非常重視自給自足,並建立了許多途徑,例如溫室生產觀賞花卉,預計這些途徑將支持這一領域的成長。
- 因此,預計田間作物需求的成長和對自給自足的日益重視以減少觀賞花卉進口將在 2023 年至 2030 年期間推動該行業的成長。中國是化肥的主要生產國。
中國肥料市場趨勢
中國耕地面積的擴大是由於糧食需求的增加和實現主糧自給的目標。
- 中國田間作物種植面積將從2017年的1.305億公頃減少到2021年的1.278億公頃,佔耕地總面積的71.4%。田間作物中,玉米佔34.2%,水稻佔23.6%,小麥佔18.3%。預計耕地面積的擴大將推動該國的化肥需求。
- 中國通常將田間作物生產分為兩個季節:夏春季(4月至9月)和冬季。春季作物主要有早玉米、早稻、早小麥、棉花等,冬季作物主要有冬小麥、油菜等。但稻米和玉米是中國農業的重點作物,佔中國糧食產量的三分之一。作為世界最大的稻米生產國,中國將在2022年分配3,000萬公頃土地用於稻米種植,預計產量為2.1億噸。水稻主產區為黑龍江、湖南、江西、湖北、江蘇、四川、廣西、廣東、湖南。預計2022-23年度中國玉米產量將達2.772億噸,與前一年同期比較增加460萬噸,主要原因是單產提高。黑龍江、吉林、內蒙古等東北三省是我國主要的玉米產區。
- 春季仍然是主要的生長季節,但也面臨挑戰,尤其是在炎熱的六月和七月。米是中國數百萬人的主食,受到的影響尤其嚴重。高溫加上稀少的降雨會加劇土壤礦物質缺乏,因此需要增加施肥量。乾旱的天氣狀況也對作物產量構成威脅。
全球約28%的氧化亞氮排放排放中國的農業用地。
- 主要營養素可增強酵素活性等生化過程並促進植物細胞生長。這些營養物質的缺乏會對植物的健康、發育和作物產量產生重大影響。 2022年田間作物氮鉀磷平均施用量為159.9公斤/公頃。其中,氮佔65.23%,磷佔28.07%,鉀佔6.68%。
- 氮作為葉綠素和胺基酸的組成部分,在植物代謝中起著重要作用,是最重要的主要營養元素。 2022年平均施肥率為279.65公斤/公頃。鉀肥緊隨其後,為 105.3 公斤/公頃,磷肥則緊隨其後,為 94.9 公斤/公頃。地表水和地下水受到氮和磷的污染,是因為沒有提供農民足夠的肥料使用指引。值得注意的是,全球農業用地氧化亞氮排放量約有28%來自中國。
- 2022年,棉花、小麥、玉米和水稻成為平均養分施用量最高的作物,分別為255.41公斤/公頃、232.25公斤/公頃、198.44公斤/公頃和157.76公斤/公頃。中國是世界棉花產量第一大國,2022 年棉花產量達到驚人的 640 萬噸,同時也是最大的棉花消費國和進口國。令人印象深刻的是,中國約佔全球棉花消費量的20%,其中84%產自新疆維吾爾自治區。
- 由於迫切需要滿足不斷成長的人口的需求,預計2023年至2030年間田間作物所需的主要養分施用量將會增加。
中國肥料產業概況
中國化肥市場分散,前五大企業市佔率合計為12.84%。該市場的主要企業包括河南新聯鑫化工Group Limited、以色列化工Group Limited、中化化肥控股有限公司、新陽豐農業科技、雅苒國際有限公司等。
其他福利
- Excel 格式的市場預測 (ME) 表
- 3個月的分析師支持
目錄
第1章執行摘要和主要發現
第2章 報告要約
第3章 引言
- 研究假設和市場定義
- 研究範圍
- 調查方法
第4章 產業主要趨勢
- 主要作物種植面積
- 田間作物
- 園藝作物
- 平均養分施用量
- 微量營養素
- 田間作物
- 園藝作物
- 主要營養素
- 田間作物
- 園藝作物
- 次要宏量營養素
- 田間作物
- 園藝作物
- 微量營養素
- 灌溉農田
- 法律規範
- 價值鍊和通路分析
第5章市場區隔
- 類型
- 複合型
- 直的
- 微量營養素
- 硼
- 銅
- 鐵
- 錳
- 鉬
- 鋅
- 其他
- 氮
- 尿素
- 其他
- 磷酸
- DAP
- MAP
- SSP
- TSP
- 其他
- 鉀
- MoP
- SoP
- 其他
- 次要營養物質
- 鈣
- 鎂
- 硫
- 形式
- 傳統的
- 特別的
- CRF
- 液體肥料
- SRF
- 水溶性
- 施肥方式
- 受精
- 葉面噴布
- 土壤
- 作物類型
- 田間作物
- 園藝作物
- 草坪和觀賞植物
第6章 競爭格局
- 關鍵策略趨勢
- 市場佔有率分析
- 商業狀況
- 公司簡介
- Coromandel International Ltd.
- Grupa Azoty SA(Compo Expert)
- Hebei Monband Water Soluble Fertilizer Co. Ltd
- Hebei Sanyuanjiuqi Fertilizer Co., Ltd.
- Henan XinlianXin Chemicals Group Company Limited
- ICL Group Ltd
- Sinofert Holdings Limited
- Sociedad Quimica y Minera de Chile SA
- Xinyangfeng Agricultural Technology Co., Ltd.
- Yara International ASA
第7章:CEO面臨的關鍵策略問題
第 8 章 附錄
- 世界概況
- 概述
- 五力分析框架
- 全球價值鏈分析
- 市場動態(DRO)
- 資訊來源及延伸閱讀
- 圖片列表
- 關鍵見解
- 數據包
- 詞彙表
簡介目錄
Product Code: 92651
The China Fertilizers Market size is estimated at 58.78 billion USD in 2025, and is expected to reach 79.08 billion USD by 2030, growing at a CAGR of 6.11% during the forecast period (2025-2030).
Intensive cultivation and monoculture necessitating the fertilizers use
- Due to continuous long-term cultivation without crop rotation, farmland fertility has been depleted and has become more deficient, increasing the need for fertilizers, especially in South China. Due to growing concerns about environmental pollution, there is a rising demand for sustainable fertilizers in field crops.
- Field crops often utilize the greatest nitrogen fertilizers. Due to their extensive cultivation, grains and cereals deplete soil nutrients, requiring the application of additional fertilizers to make up for it. Conventional fertilizers accounted for about 73.3%, and specialty fertilizers accounted for about 26.7% of the total field crops fertilizer market value in 2022.
- Horticultural crops utilize more specialty fertilizers than field crops since they are grown all year long and benefit from superior watering methods like sprinkler and drip irrigation, which encourage the use of water-soluble and liquid fertilizers. About 18.7% of the market value of fertilizers used in horticultural crops was made up of specialty fertilizers in 2021.
- In 2022, less than 1% of the country's total fertilizer market was made up of turf and ornamental products. Over recent years, the government put greater emphasis on self-sufficiency and established a number of methods, such as the production of ornamental flowers in greenhouses, which are expected to support sectoral growth.
- Therefore, it is projected that the segmental growth will be boosted throughout 2023-2030 due to the rising demand from field crops and increased focus on self-sufficiency to reduce the import of ornamentals. The country is the leading producer of fertilizers.
China Fertilizers Market Trends
China's expanding cultivation area is driven by increased food demand and goal to achieve self-sufficiency in staple food
- In China, the cultivation area for field crops decreased from 130.5 million hectares in 2017 to 127.8 million hectares in 2021, representing 71.4% of the total cultivated area. Corn dominated the field crop landscape with a share of 34.2%, followed by rice and wheat at 23.6% and 18.3%, respectively. This expanding cultivation area is projected to drive up fertilizer demand in the country.
- China typically divides its field crop production into two seasons: summer/spring (April-September) and winter. Spring crops encompass early corn, early rice, early wheat, and cotton, while winter crops focus on winter wheat and rapeseed. Rice and corn, however, take precedence in China's agricultural landscape, accounting for a third of the nation's grain output. As the world's leading rice producer, China allocated 30 million hectares for rice farming in 2022, yielding a harvest of 210 million tonnes. Key rice-producing regions span Heilongjiang, Hunan, Jiangxi, Hubei, Jiangsu, Sichuan, Guangxi, Guangdong, and Yunan. China's corn production for 2022-23 is projected to hit 277.2 million tonnes, up by 4.6 million tonnes from the previous year, primarily due to improved harvests. The Northeast provinces of Heilongjiang, Jilin, and Inner Mongolia stand out as major corn-growing regions.
- While spring remains the primary cropping season, it faces some challenges, particularly during the hotter months of June and July. Rice, a staple for millions in China, is particularly affected. The combination of high temperatures and low precipitation exacerbates mineral depletion in the soil, necessitating higher fertilizer application. These dry weather conditions also pose a risk to crop yields.
About 28% of nitrous oxide emissions from cropland in the world are from China's agricultural lands
- Primary nutrients enhance biochemical processes, such as enzyme activity, and foster plant cell growth. Deficiencies in these nutrients can significantly impact plant health, development, and crop yields. In 2022, the average application rate for nitrogen, potassium, and phosphorus combined in field crops stood at 159.9 kg/hectare. Specifically, nitrogen accounted for 65.23%, phosphorus for 28.07%, and potassium for 6.68% of this average.
- Nitrogen takes the lead among primary nutrients, playing a vital role in plant metabolism as a constituent of chlorophyll and amino acids. Its average application rate in 2022 was 279.65 kg/hectare. Potash followed with 105.3 kg/hectare, and phosphorus trailed slightly at 94.9 kg/hectare. The contamination of surface and groundwater with nitrogen and phosphorus has been attributed to inadequate guidance on fertilizer application rates for farmers. Notably, around 28% of global nitrous oxide emissions from croplands originate from China.
- In 2022, cotton, wheat, corn, and rice emerged as the crops with the highest average nutrient application rates, with figures of 255.41 kg/hectare, 232.25 kg/hectare, 198.44 kg/hectare, and 157.76 kg/hectare, respectively. China led the world in cotton production, with a staggering 6.4 million metric tons in 2022. It also held the title of the largest consumer and importer of cotton. Impressively, China accounted for about 20% of global cotton consumption, with a significant 84% of its production hailing from Xinjiang.
- Given the imperative to meet the needs of a growing population, there is an anticipated increase in the application of primary nutrients in field crops between 2023 and 2030.
China Fertilizers Industry Overview
The China Fertilizers Market is fragmented, with the top five companies occupying 12.84%. The major players in this market are Henan XinlianXin Chemicals Group Company Limited, ICL Group Ltd, Sinofert Holdings Limited, Xinyangfeng Agricultural Technology Co., Ltd. and Yara International ASA (sorted alphabetically).
Additional Benefits:
- The market estimate (ME) sheet in Excel format
- 3 months of analyst support
TABLE OF CONTENTS
1 EXECUTIVE SUMMARY & KEY FINDINGS
2 REPORT OFFERS
3 INTRODUCTION
- 3.1 Study Assumptions & Market Definition
- 3.2 Scope of the Study
- 3.3 Research Methodology
4 KEY INDUSTRY TRENDS
- 4.1 Acreage Of Major Crop Types
- 4.1.1 Field Crops
- 4.1.2 Horticultural Crops
- 4.2 Average Nutrient Application Rates
- 4.2.1 Micronutrients
- 4.2.1.1 Field Crops
- 4.2.1.2 Horticultural Crops
- 4.2.2 Primary Nutrients
- 4.2.2.1 Field Crops
- 4.2.2.2 Horticultural Crops
- 4.2.3 Secondary Macronutrients
- 4.2.3.1 Field Crops
- 4.2.3.2 Horticultural Crops
- 4.2.1 Micronutrients
- 4.3 Agricultural Land Equipped For Irrigation
- 4.4 Regulatory Framework
- 4.5 Value Chain & Distribution Channel Analysis
5 MARKET SEGMENTATION (includes market size in Value in USD and Volume, Forecasts up to 2030 and analysis of growth prospects)
- 5.1 Type
- 5.1.1 Complex
- 5.1.2 Straight
- 5.1.2.1 Micronutrients
- 5.1.2.1.1 Boron
- 5.1.2.1.2 Copper
- 5.1.2.1.3 Iron
- 5.1.2.1.4 Manganese
- 5.1.2.1.5 Molybdenum
- 5.1.2.1.6 Zinc
- 5.1.2.1.7 Others
- 5.1.2.2 Nitrogenous
- 5.1.2.2.1 Urea
- 5.1.2.2.2 Others
- 5.1.2.3 Phosphatic
- 5.1.2.3.1 DAP
- 5.1.2.3.2 MAP
- 5.1.2.3.3 SSP
- 5.1.2.3.4 TSP
- 5.1.2.3.5 Others
- 5.1.2.4 Potassic
- 5.1.2.4.1 MoP
- 5.1.2.4.2 SoP
- 5.1.2.4.3 Others
- 5.1.2.5 Secondary Macronutrients
- 5.1.2.5.1 Calcium
- 5.1.2.5.2 Magnesium
- 5.1.2.5.3 Sulfur
- 5.2 Form
- 5.2.1 Conventional
- 5.2.2 Speciality
- 5.2.2.1 CRF
- 5.2.2.2 Liquid Fertilizer
- 5.2.2.3 SRF
- 5.2.2.4 Water Soluble
- 5.3 Application Mode
- 5.3.1 Fertigation
- 5.3.2 Foliar
- 5.3.3 Soil
- 5.4 Crop Type
- 5.4.1 Field Crops
- 5.4.2 Horticultural Crops
- 5.4.3 Turf & Ornamental
6 COMPETITIVE LANDSCAPE
- 6.1 Key Strategic Moves
- 6.2 Market Share Analysis
- 6.3 Company Landscape
- 6.4 Company Profiles
- 6.4.1 Coromandel International Ltd.
- 6.4.2 Grupa Azoty S.A. (Compo Expert)
- 6.4.3 Hebei Monband Water Soluble Fertilizer Co. Ltd
- 6.4.4 Hebei Sanyuanjiuqi Fertilizer Co., Ltd.
- 6.4.5 Henan XinlianXin Chemicals Group Company Limited
- 6.4.6 ICL Group Ltd
- 6.4.7 Sinofert Holdings Limited
- 6.4.8 Sociedad Quimica y Minera de Chile SA
- 6.4.9 Xinyangfeng Agricultural Technology Co., Ltd.
- 6.4.10 Yara International ASA
7 KEY STRATEGIC QUESTIONS FOR FERTILIZER CEOS
8 APPENDIX
- 8.1 Global Overview
- 8.1.1 Overview
- 8.1.2 Porter's Five Forces Framework
- 8.1.3 Global Value Chain Analysis
- 8.1.4 Market Dynamics (DROs)
- 8.2 Sources & References
- 8.3 List of Tables & Figures
- 8.4 Primary Insights
- 8.5 Data Pack
- 8.6 Glossary of Terms
02-2729-4219
+886-2-2729-4219
 美國化肥:市場佔有率分析、產業趨勢與統計、成長預測(2026-2031)越南化肥:市場佔有率分析、產業趨勢與統計、成長預測(2026-2031)非洲化肥市場:市場佔有率分析、產業趨勢與統計、成長預測(2026-2031年)
 2026-2034年肥料市場規模、佔有率、趨勢及預測(依產品類型、產品形態、作物類型及地區分類)
 化肥市場規模、佔有率和趨勢分析報告:按類型、應用、地區和細分市場預測(2026-2033 年)
 2026年全球硼肥市場報告2026年全球螯合肥料市場報告2026年全球複合肥料市場報告
 肥料棒市場 - 全球產業規模、佔有率、趨勢、機會及預測(按類型、應用、營養成分、分銷管道、地區和競爭格局分類,2021-2031年)
 全球液態硫代硫酸銨市場按等級、作物類型、應用和銷售管道分類 - 預測(2026-2032 年)
▼