


 |
市場調查報告書
商品編碼
1693540
北美肥料:市場佔有率分析、產業趨勢與統計、成長預測(2025-2030)North America Fertilizers - Market Share Analysis, Industry Trends & Statistics, Growth Forecasts (2025 - 2030) |
||||||
價格
※ 本網頁內容可能與最新版本有所差異。詳細情況請與我們聯繫。
簡介目錄
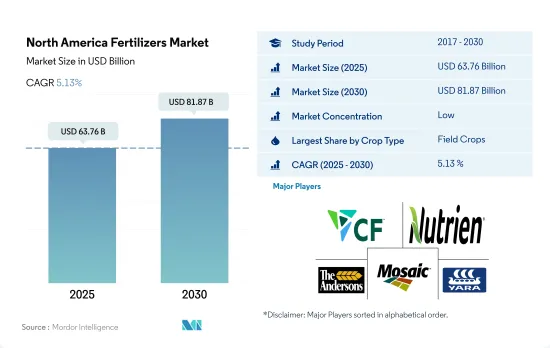
北美肥料市場規模預計在 2025 年將達到 637.6 億美元,預計到 2030 年將達到 818.7 億美元,預測期內(2025-2030 年)的複合年成長率為 5.13%。
預計增加產量和提高產量對肥料的需求不斷成長將推動市場成長。
- 北美地區的肥料使用以田間作物為主,預計2022年市場規模將達672億美元。這是由於該地區田間作物種植規模較大,佔農業用地總面積的95.0%以上。美國佔該地區可用耕地面積的69.0%,其中84.0%用於種植田間作物。
- 草坪和觀賞作物是第二大肥料市場,2022 年價值 53 億美元。隨著可支配收入和生活水準的提高,觀賞植物在屋主中越來越受歡迎,施肥對於維持這些植物的健康和外觀至關重要,預計這將推動市場成長。
- 園藝作物僅佔農業用地總量的7.3%,而至2022年,園藝作物約佔肥料市場總量的5.3%。儘管2018年至2021年園藝作物的種植面積下降了2.5%,但預計該地區對水果和蔬菜的需求將推動市場在2023年至2030年期間以6.1%的複合年成長率成長。種植面積的減少直接影響到使用更多的肥料來提高產量和滿足需求。
- 此外,為提高作物產量和品質而增加化肥使用量、耕地面積減少以及需要增加產量以滿足日益成長的需求等因素也在推動市場成長。因此,預計2023年至2030年間北美肥料市場價值將以4.9%的複合年成長率成長。
美國糧食種植面積增加推動市場成長
- 在北美,美國和墨西哥佔據化肥市場價值和數量的80.0%以上。儘管北美擁有豐富的磷酸鹽和鉀肥資源,但一半以上的氮肥和85.0%以上的鉀肥都仰賴進口。
- 美國和墨西哥是該地區最大的化肥消費國,主要原因是兩國耕地面積大,分別佔北美耕地面積的66.8%和18.7%。近年來,肥料科技進步幫助農民實現了效益最大化。
- 美國是該地區最大的市場,2022 年約佔整個化肥市場的 49.3%。美國的優勢主要在於其用於種植穀物作物的面積大,並且可以透過施肥解決各種營養缺陷問題。
- 整體而言,在北美,尤其是美國和加拿大,農業正隨著現代技術的進步而變得更加機械化。這些技術改進正在推動該地區對更有效率、更永續肥料的需求。
- 2019-2020 年的供應鏈中斷導致該地區化肥的價值和產量下降。但2020年至2021年,受化肥需求回升、投入成本上升等因素影響,化肥價格大幅上漲。
- 在北美地區,美國和墨西哥是最大的已開發國家。大多數跨國公司都位置該地區,這使得種植者和農民可以輕鬆獲得化肥產品。
北美肥料市場趨勢
補貼和其他政府財政支持正在促進田間作物。
- 北美的農場種植多種作物,以田間作物為主。玉米、棉花、水稻、大豆和小麥是該地區的主要田間作物。美國、加拿大和墨西哥對該地區的農業生產貢獻巨大。 2022年,田間作物將佔北美總種植面積的約97.6%,其中穀物和油籽佔據市場主導地位。
- 美國佔據市場主導地位,研究期間,作物種植總面積達 1.357 億公頃。大田作物和園藝佔該面積的大部分,2022年分別佔97.2%和2.8%。然而,從2018年到2019年,作物種植面積大幅下降,主要原因是不利的環境條件導致德克薩斯和休士頓等地區發生嚴重洪災。
- 種植最廣泛的作物是玉米,大部分種植在美國中西部地區,傳統上稱為“玉米帶”,大致覆蓋印第安納州西部、伊利諾伊州、愛荷華州、密蘇裡州、內布拉斯加州東部和堪薩斯州東部,這些地區主要作物玉米和大豆。它是米的主要出口國,該地區的水稻種植集中在四個主要區域。因此,該地區田間作物市場潛力的不斷增加,加上政府資金投入和保護力度的加大,預計將積極推動該地區田間作物面積的擴大。
在所有主要營養元素中,氮是田間作物最常施用的營養元素,相當於每公頃 229.8 公斤。
- 水稻、玉米、小麥和油菜籽等田間作物是該地區營養消費量最大的作物。 2022 年,水稻位居榜首,主要養分消耗量約為每公頃 140.85 公斤,緊隨其後的是油菜籽/油菜籽,消耗量為每公頃 118.40 公斤。穀物種植面積廣闊,因此需要更多的氮肥。這種密集耕作會耗盡土壤養分,因此需要增加施肥才能達到最佳生長。
- 氮肥將佔據養分使用的絕大部分,到2022年將占到約74.0%,田間作物用量將達229.8公斤/公頃。儘管如此,氮缺乏仍然是該地區的一個主要問題。因此,氮供應主要靠土壤施氮。一旦進入土壤,氮就會轉化為礦物質硝酸鹽,使植物更容易吸收。特別值得注意的是油菜籽,它在美國廣泛種植。
- 油菜籽具有工業用途,特別是在生產潤滑劑、液壓油和塑膠方面。施肥率取決於土壤品質和降雨模式,但油菜籽的氮需求通常為每英畝 100 至 150 磅。磷肥和鉀肥的施用量根據土壤的不同而不同,但 AgMRC 建議的施用量分別為每英畝 0 至 80 磅和每英畝 0 至 140 磅。
- 鑑於主要營養元素在作物營養中的關鍵作用,由於土壤貧化和淋溶等問題,預計未來幾年其施用率將大幅增加。
北美肥料行業概況。
北美肥料市場分散,前五大公司佔35.62%的市佔率。該市場的主要企業有:CF Industries Holdings, Inc.、Nutrien Ltd.、The Andersons Inc.、The Mosaic Company 和 Yara International ASA(按字母順序排列)
其他福利
- Excel 格式的市場預測 (ME) 表
- 3個月的分析師支持
目錄
第1章執行摘要和主要發現
第2章 報告要約
第3章 引言
- 研究假設和市場定義
- 研究範圍
- 調查方法
第4章 產業主要趨勢
- 主要作物種植面積
- 田間作物
- 園藝作物
- 平均養分施用量
- 微量營養素
- 田間作物
- 園藝作物
- 主要營養素
- 田間作物
- 園藝作物
- 次要宏量營養素
- 田間作物
- 園藝作物
- 微量營養素
- 灌溉農田
- 法律規範
- 價值鍊和通路分析
第5章市場區隔
- 類型
- 複合型
- 直的
- 微量營養素
- 硼
- 銅
- 鐵
- 錳
- 鉬
- 鋅
- 其他
- 氮
- 硝酸銨
- 無水氨
- 尿素
- 其他
- 磷酸
- DAP
- MAP
- SSP
- TSP
- 其他
- 鉀
- MoP
- SoP
- 其他
- 次要營養物質
- 鈣
- 鎂
- 硫
- 形式
- 傳統的
- 特別的
- CRF
- 液體肥料
- SRF
- 水溶性
- 施肥方式
- 受精
- 葉面噴布
- 土壤
- 作物類型
- 田間作物
- 園藝作物
- 草坪和觀賞植物
- 原產地
- 加拿大
- 墨西哥
- 美國
- 北美其他地區
第6章競爭格局
- 關鍵策略趨勢
- 市場佔有率分析
- 商業狀況
- 公司簡介
- CF Industries Holdings, Inc.
- Haifa Group
- ICL Group Ltd
- Koch Industries Inc.
- Nutrien Ltd.
- Sociedad Quimica y Minera de Chile SA
- The Andersons Inc.
- The Mosaic Company
- Wilbur-Ellis Company LLC
- Yara International ASA
第7章:CEO面臨的關鍵策略問題
第 8 章 附錄
- 世界概況
- 概述
- 五力分析框架
- 全球價值鏈分析
- 市場動態(DRO)
- 資訊來源及延伸閱讀
- 圖片列表
- 關鍵見解
- 資料包
- 詞彙表
簡介目錄
Product Code: 92605
The North America Fertilizers Market size is estimated at 63.76 billion USD in 2025, and is expected to reach 81.87 billion USD by 2030, growing at a CAGR of 5.13% during the forecast period (2025-2030).
The rising need of fertilizers to increase production and improve yield is anticipated to fuel the growth of the market
- Field crops dominate in fertilizer usage in North America, with a market value of USD 67.2 billion in the year 2022. This is due to the region's large-scale cultivation of field crops, which occupy over 95.0% of the total agricultural land. The United States accounts for 69.0% of the available arable land in the region, with 84.0% of it being used for field crop cultivation.
- Turf and ornamental crops are the second-largest market for fertilizers, valued at USD 5.3 billion in the year 2022. Ornamental plants are becoming increasingly popular among homeowners as disposable income and living standards rise, which is expected to fuel the growth of the market as fertilization is essential to maintain the health and appearance of these plants.
- Horticultural crops, accounting for just 7.3% of the total agricultural land, represented roughly 5.3% of the total fertilizer market value in 2022. Despite a 2.5% decrease in horticulture cultivation area between 2018 and 2021, the demand for fruits and vegetables in the region is expected to drive the market at a CAGR of 6.1% during 2023-2030. The decreased acreage directly influences the use of more fertilizers to increase production and meet demand.
- Furthermore, factors such as the increase in fertilizer usage for the improving yield and quality of the crops coupled with reducing arable land and the need to increase production to meet the growing demand are driving the growth of the market. Therefore, the North American fertilizers market value is expected to record a 4.9% CAGR during 2023-2030.
Higher cultivation areas under cereal crops in the United States propel the market growth
- In North America, the United States and Mexico constitute more than 80.0% of the fertilizers market value and volume. Even though North America has phosphate and potash resources, the region is a net importer of more than half nitrogenous and over 85.0% potash from international sources.
- The United States and Mexico are the largest consumers of fertilizers in the region, which is majorly due to the higher cultivation areas holding 66.8% and 18.7% of the total crop acreage of North America. Additional scientific and technical advancements in fertilizers in recent years have helped farmers maximize fertilizer benefits.
- The United States is the largest market in the region, accounting for about 49.3% of the total fertilizers market value in 2022. The dominance of the United States is mainly due to the higher cultivation areas under cereal crops and various nutrient deficiencies that are addressed by fertilization.
- Generally, in North America, agriculture has been mechanized with the latest technology, particularly in the United States and Canada. These technological improvements demand more efficient and sustainable fertilizers in the region.
- The supply chain disruptions in 2019-2020 declined the fertilizer value and volume in the region. However, between 2020 and 2021, the demand recovery for fertilizers and increased input costs resulted in a spike in the fertilizer value.
- In the North American region, the United States and Mexico are the biggest and most advanced economies. Most of the multinational companies are situated in the region, giving growers and farmers an advantage in terms of fertilizer product availability.
North America Fertilizers Market Trends
The financial support by the government, such as subsidies, has contributed to the expansion of field crops
- A wide array of crops are grown on North American farms, mainly covering field crops. Corn, cotton, rice, soybean, and wheat are some of the dominating field crops across the region. The United States, Canada, and Mexico are major contributors to the region's agricultural output. In 2022, field crops covered around 97.6% of the overall cultivation in North America, with cereals and oilseeds dominating the market.
- The United States dominates the market, with 135.7 million hectares of the overall area under crop cultivation during the study period. Field crops and horticulture cover the majority of the area, and they accounted for shares of 97.2% and 2.8%, respectively, in 2022. However, during 2018-2019, the country witnessed a significant dip in crop acreages, mainy due to unfavorable environmental conditions that resulted in heavy floods in areas like Texas and Houston.
- The most cultivated crop is corn, the majority of which is grown in a region known as the 'Corn Belt' traditional area in the midwestern United States, roughly covering western Indiana, Illinois, Iowa, Missouri, eastern Nebraska, and eastern Kansas, in which corn (maize) and soybeans are the dominant crops. It is the major rice exporter, and rice cultivation in the region is mainly concentrated in 4 regions, with three in the South and one in California. Therefore, the increased market potential for the region's field crop, coupled with the increased government funding and protection, is anticipated to positively drive the area under field crop cultivation in the region.
Among all the primary nutrients, nitrogen is applied in a higher quantity to field crops, which is equivalent to 229.8 kg/hectare
- Field crops, including rice, corn/maize, wheat, and rapeseed/canola, rank high in nutrient consumption in the region. In 2022, rice led the pack, consuming around 140.85 kg/hectare of primary nutrients, closely followed by rapeseed/canola at 118.40 kg/hectare. Cereals, being extensively cultivated, exhibit a higher appetite for nitrogen-based fertilizers. This intensive cultivation depletes soil nutrients, necessitating increased fertilizer application for optimal growth.
- Nitrogen dominates the primary nutrient usage, accounting for approximately 74.0% in 2022, translating to 229.8 kg/hectare for field crops. Despite this, nitrogen deficiency remains a significant concern in the region. Consequently, nitrogen supplements are predominantly provided through soil application. Once in the soil, nitrogen converts into mineral nitrate, facilitating easy absorption by plants. Notably, rapeseed, a key nitrogen consumer, enjoys widespread cultivation in the United States.
- Rapeseed finds industrial applications, notably in the production of oils for lubricants, hydraulic fluids, and plastics. While fertilizer usage hinges on soil quality and rainfall patterns, rapeseed's nitrogen requirements typically range from 100 to 150 lbs./acre. Phosphorus and potassium fertility rates exhibit soil-dependent variations, yet the recommended rates, as per AgMRC, span from 0 to 80 lbs./acre and 0 to 140 lbs./acre, respectively.
- Given the pivotal role of primary nutrients in crop nutrition, their application rates are poised for a significant uptick in the coming years, driven by concerns like soil depletion and leaching.
North America Fertilizers Industry Overview
The North America Fertilizers Market is fragmented, with the top five companies occupying 35.62%. The major players in this market are CF Industries Holdings, Inc., Nutrien Ltd., The Andersons Inc., The Mosaic Company and Yara International ASA (sorted alphabetically).
Additional Benefits:
- The market estimate (ME) sheet in Excel format
- 3 months of analyst support
TABLE OF CONTENTS
1 EXECUTIVE SUMMARY & KEY FINDINGS
2 REPORT OFFERS
3 INTRODUCTION
- 3.1 Study Assumptions & Market Definition
- 3.2 Scope of the Study
- 3.3 Research Methodology
4 KEY INDUSTRY TRENDS
- 4.1 Acreage Of Major Crop Types
- 4.1.1 Field Crops
- 4.1.2 Horticultural Crops
- 4.2 Average Nutrient Application Rates
- 4.2.1 Micronutrients
- 4.2.1.1 Field Crops
- 4.2.1.2 Horticultural Crops
- 4.2.2 Primary Nutrients
- 4.2.2.1 Field Crops
- 4.2.2.2 Horticultural Crops
- 4.2.3 Secondary Macronutrients
- 4.2.3.1 Field Crops
- 4.2.3.2 Horticultural Crops
- 4.2.1 Micronutrients
- 4.3 Agricultural Land Equipped For Irrigation
- 4.4 Regulatory Framework
- 4.5 Value Chain & Distribution Channel Analysis
5 MARKET SEGMENTATION (includes market size in Value in USD and Volume, Forecasts up to 2030 and analysis of growth prospects)
- 5.1 Type
- 5.1.1 Complex
- 5.1.2 Straight
- 5.1.2.1 Micronutrients
- 5.1.2.1.1 Boron
- 5.1.2.1.2 Copper
- 5.1.2.1.3 Iron
- 5.1.2.1.4 Manganese
- 5.1.2.1.5 Molybdenum
- 5.1.2.1.6 Zinc
- 5.1.2.1.7 Others
- 5.1.2.2 Nitrogenous
- 5.1.2.2.1 Ammonium Nitrate
- 5.1.2.2.2 Anhydrous Ammonia
- 5.1.2.2.3 Urea
- 5.1.2.2.4 Others
- 5.1.2.3 Phosphatic
- 5.1.2.3.1 DAP
- 5.1.2.3.2 MAP
- 5.1.2.3.3 SSP
- 5.1.2.3.4 TSP
- 5.1.2.3.5 Others
- 5.1.2.4 Potassic
- 5.1.2.4.1 MoP
- 5.1.2.4.2 SoP
- 5.1.2.4.3 Others
- 5.1.2.5 Secondary Macronutrients
- 5.1.2.5.1 Calcium
- 5.1.2.5.2 Magnesium
- 5.1.2.5.3 Sulfur
- 5.2 Form
- 5.2.1 Conventional
- 5.2.2 Speciality
- 5.2.2.1 CRF
- 5.2.2.2 Liquid Fertilizer
- 5.2.2.3 SRF
- 5.2.2.4 Water Soluble
- 5.3 Application Mode
- 5.3.1 Fertigation
- 5.3.2 Foliar
- 5.3.3 Soil
- 5.4 Crop Type
- 5.4.1 Field Crops
- 5.4.2 Horticultural Crops
- 5.4.3 Turf & Ornamental
- 5.5 Country
- 5.5.1 Canada
- 5.5.2 Mexico
- 5.5.3 United States
- 5.5.4 Rest of North America
6 COMPETITIVE LANDSCAPE
- 6.1 Key Strategic Moves
- 6.2 Market Share Analysis
- 6.3 Company Landscape
- 6.4 Company Profiles
- 6.4.1 CF Industries Holdings, Inc.
- 6.4.2 Haifa Group
- 6.4.3 ICL Group Ltd
- 6.4.4 Koch Industries Inc.
- 6.4.5 Nutrien Ltd.
- 6.4.6 Sociedad Quimica y Minera de Chile SA
- 6.4.7 The Andersons Inc.
- 6.4.8 The Mosaic Company
- 6.4.9 Wilbur-Ellis Company LLC
- 6.4.10 Yara International ASA
7 KEY STRATEGIC QUESTIONS FOR FERTILIZER CEOS
8 APPENDIX
- 8.1 Global Overview
- 8.1.1 Overview
- 8.1.2 Porter's Five Forces Framework
- 8.1.3 Global Value Chain Analysis
- 8.1.4 Market Dynamics (DROs)
- 8.2 Sources & References
- 8.3 List of Tables & Figures
- 8.4 Primary Insights
- 8.5 Data Pack
- 8.6 Glossary of Terms
02-2729-4219
+886-2-2729-4219
 硼肥市場-全球產業規模、佔有率、趨勢、機會和預測,依來源、應用、區域和競爭格局分類,2020-2030年預測全球糞肥市場-產業規模、佔有率、趨勢、機會及預測,依類型、形態、應用、區域及競爭格局分類,2020-2030年預測昆蟲肥料市場-全球產業規模、佔有率、趨勢、機會和預測,按類型、形態、應用、地區和競爭格局分類,2020-2030年預測海藻肥料市場-全球產業規模、佔有率、趨勢、機會和預測,按形態(液體和粉末)、應用(農場、花園及其他)、地區和競爭格局分類,2020-2030年預測聚合物包膜肥料市場-全球產業規模、佔有率、趨勢、機會和預測,按類型、作物類型、地區和競爭格局分類,2020-2030年預測
 按營養類型、形態、施用方法、作物類型、品種和地區分類的啟動肥市場規模、佔有率和成長分析 - 2025-2032 年行業預測
 矽肥市場:預測(2025-2030 年)
 膠囊肥料市場依營養成分、釋放機制、作物用途及地區分類
 化肥市場按產品類型、作物類型、包裝、施用方法、最終用戶和分銷管道分類-2025-2032年全球預測化肥市場:2025-2032年全球預測(依類型、形態、用途及通路分類)
▼