


 |
市場調查報告書
商品編碼
1822650
替代蛋白質市場機會、成長動力、產業趨勢分析及 2025 - 2034 年預測Alternative Proteins Market Opportunity, Growth Drivers, Industry Trend Analysis, and Forecast 2025 - 2034 |
||||||
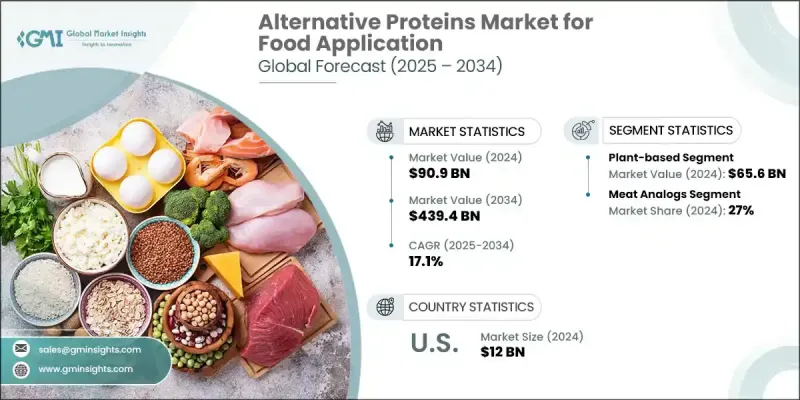
2024 年,全球食品替代蛋白質市場價值為 909 億美元,預計在環境永續意識的推動下,該市場將以 17.1% 的複合年成長率成長,到 2034 年達到 4,394 億美元。隨著消費者選擇環保的生活方式,他們正在尋找生態足跡較低的蛋白質來源。此外,對健康和飲食的擔憂促使人們轉向植物性和實驗室培育的蛋白質,這些蛋白質被認為更健康,不太可能導致慢性疾病。根據國際食品資訊委員會在 2023 年進行的一項調查,超過一半(57%)的美國人嘗試過替代蛋白質,其中最常見的是植物性碎牛肉,佔 31%,其次是牛肉替代品,佔 23%,植物性香腸佔 22%,植物性雞肉替代品佔 22%。
此外,食品生產技術的進步使替代蛋白質更易於取得且更具成本效益,加速了市場擴張。替代蛋白質市場根據來源、應用和地區進行分類。在研究期間,昆蟲類蛋白質將錄得顯著成長,這得益於其高效的資源利用率。與傳統牲畜相比,昆蟲所需的土地、水和飼料顯著減少,使其成為高度永續的蛋白質來源。此外,昆蟲飼料轉換率高,易於快速養殖,這與日益成長的可擴展且富有韌性的食品系統需求相契合。隨著人們對永續性的擔憂日益加劇,消費者不斷尋求創新的蛋白質來源,昆蟲類蛋白質因其在應對全球糧食安全挑戰的同時最大限度地減少環境影響的潛力而日益受到青睞。 2032年,由於畜牧業採用永續蛋白質來源,動物飼料應用領域將佔據顯著的替代蛋白質市場。
| 市場範圍 | |
|---|---|
| 起始年份 | 2024 |
| 預測年份 | 2025-2034 |
| 起始值 | 909億美元 |
| 預測值 | 4394億美元 |
| 複合年成長率 | 17.1% |
隨著畜產品需求的增加,農民正在探索可以補充傳統飼料的替代蛋白質。這種轉變的動機是提高飼料效率並減少與傳統飼料成分相關的環境足跡。透過將替代蛋白質整合到動物飼料中,生產商可以提高整體資源利用率並應對飼料短缺的挑戰。到2032年,歐洲替代蛋白質市場將呈現強勁的成長趨勢,這得益於消費者對永續和道德食品選擇的強勁需求。人們越來越意識到傳統蛋白質來源對環境的影響,促使歐洲消費者尋求更環保的替代方案。此外,嚴格的法規和政府鼓勵食品生產的永續性的激勵措施正在推動市場成長。健康飲食意識的興起和食品技術的創新進一步增強了替代蛋白質的吸引力,為整個地區的行業參與者創造了豐厚的商機。
目錄
第1章:方法論與範圍
第2章:執行摘要
第3章:行業洞察
- 產業生態系統分析
- 供應商格局
- 利潤率
- 每個階段的增值
- 影響價值鏈的因素
- 中斷
- 產業衝擊力
- 成長動力
- 產業陷阱與挑戰
- 市場機會
- 成長潛力分析
- 監管格局
- 北美洲
- 歐洲
- 亞太地區
- 拉丁美洲
- 中東和非洲
- 波特的分析
- PESTEL分析
- 技術和創新格局
- 當前的技術趨勢
- 新興技術
- 價格趨勢
- 按地區
- 未來市場趨勢
- 技術和創新格局
- 當前的技術趨勢
- 新興技術
- 專利態勢
- 貿易統計資料(HS 編碼)(註:僅提供重點國家的貿易統計資料)
- 主要進口國
- 主要出口國
- 永續性和環境方面
- 永續實踐
- 減少廢棄物的策略
- 生產中的能源效率
- 環保舉措
- 碳足跡考慮
第4章:競爭格局
- 介紹
- 公司市佔率分析
- 按地區
- 北美洲
- 歐洲
- 亞太地區
- 拉丁美洲
- 多邊環境協定
- 按地區
- 公司矩陣分析
- 主要市場參與者的競爭分析
- 競爭定位矩陣
- 關鍵進展
- 併購
- 夥伴關係與合作
- 新產品發布
- 擴張計劃
第5章:市場估計與預測:按來源,2021-2034
- 主要趨勢
- 植物性
- 大豆分離蛋白
- 大豆濃縮蛋白
- 發酵大豆蛋白
- 浮萍蛋白
- 其他
- 基於昆蟲
- 基於微生物
- 細菌
- 酵母菌
- 藻類
- 其他
第6章:市場估計與預測:按應用,2021-2034
- 主要趨勢
- 肉類似物
- 麵包店
- 乳製品替代品
- 穀物和零食
- 飲料
- 其他
第7章:市場估計與預測:按地區,2021-2034
- 主要趨勢
- 北美洲
- 美國
- 加拿大
- 歐洲
- 德國
- 英國
- 法國
- 西班牙
- 義大利
- 歐洲其他地區
- 亞太地區
- 中國
- 印度
- 日本
- 澳洲
- 韓國
- 亞太其他地區
- 拉丁美洲
- 巴西
- 墨西哥
- 阿根廷
- 拉丁美洲其他地區
- 中東和非洲
- 沙烏地阿拉伯
- 南非
- 阿拉伯聯合大公國
- 中東和非洲其他地區
第8章:公司簡介
- Archer Daniels Midland Company
- Cargill Inc.
- Ingredion Inc.
- Kerry Group
- Impossible Foods Inc.
- The Scoular Company
- DSM NV
- Lightlife Foods, Inc.
- Impossible Foods Inc.
- International Flavors & Fragrances, Inc.
- Glanbia plc
- Bunge Limited
- Axiom Foods Inc.
Global Alternative Protein Market for food application was valued at USD 90.9 billion in 2024 and is estimated to grow at a CAGR of 17.1% to reach USD 439.4 billion by 2034, driven by the awareness of environmental sustainability. As consumers opt for an eco-friendly lifestyle, they are seeking protein sources with a lower ecological footprint. Additionally, concerns over health and diet are prompting a shift towards plant-based and lab-grown proteins, which are perceived as healthier and less likely to cause chronic diseases. According to a survey conducted by the International Food Information Council in 2023, over half (57%) of Americans have tried alternative proteins, with plant-based ground beef being the most common at 31%, followed by beef alternatives at 23%, plant-based sausage at 22%, and plant-based chicken alternatives at 22%.
Further, technological advancements in food production are making alternative proteins more accessible and cost-effective, accelerating market expansion. The alternative protein market is classified based on source, application, and region. The insect-based segment will record a significant growth rate over the study period, driven by its efficiency in resource utilization. Insects require significantly less land, water, and feed than traditional livestock, making them a highly sustainable protein source. Additionally, insects have a high feed conversion rate and can be cultivated quickly, which aligns with the growing need for scalable and resilient food systems. As sustainability concerns mount and consumers seek innovative protein sources, insect-based options are gaining traction due to their potential to address global food security challenges while minimizing environmental impact. The animal feed application segment will clutch a noticeable alternative protein market share by 2032, owing to the adoption of sustainable protein sources within the livestock industry.
| Market Scope | |
|---|---|
| Start Year | 2024 |
| Forecast Year | 2025-2034 |
| Start Value | $90.9 Billion |
| Forecast Value | $439.4 Billion |
| CAGR | 17.1% |
As the demand for livestock products increases, farmers are exploring alternative proteins that can supplement traditional feed. This shift is motivated by the desire to enhance feed efficiency and reduce the environmental footprint associated with conventional feed ingredients. By integrating alternative proteins into animal feed, producers can improve overall resource utilization and address the challenges of feed scarcity. Europe alternative protein market will demonstrate a strong growth trend through 2032, driven by robust consumer demand for sustainable and ethical food choices. The increasing awareness of the environmental impact of traditional protein sources has led European consumers to seek more eco-friendly alternatives. Additionally, stringent regulations and government incentives promoting sustainability in food production are fueling market growth. The rise in health-conscious eating and innovations in food technology further bolster the appeal of alternative proteins, creating lucrative opportunities for the industry players across the region.
Table of Contents
Chapter 1 Methodology & Scope
- 1.1 Market scope and definition
- 1.2 Research design
- 1.2.1 Research approach
- 1.2.2 Data collection methods
- 1.3 Data mining sources
- 1.3.1 Global
- 1.3.2 Regional/Country
- 1.4 Base estimates and calculations
- 1.4.1 Base year calculation
- 1.4.2 Key trends for market estimation
- 1.5 Primary research and validation
- 1.5.1 Primary sources
- 1.6 Forecast model
- 1.7 Research assumptions and limitations
Chapter 2 Executive Summary
- 2.1 Industry 360° synopsis
- 2.2 Key market trends
- 2.2.1 Source trends
- 2.2.2 Application trends
- 2.2.3 Regional
- 2.3 TAM Analysis, 2025-2034
- 2.4 CXO perspectives: Strategic imperatives
- 2.4.1 Executive decision points
- 2.4.2 Critical success factors
- 2.5 Future outlook and strategic recommendations
Chapter 3 Industry Insights
- 3.1 Industry ecosystem analysis
- 3.1.1 Supplier landscape
- 3.1.2 Profit margin
- 3.1.3 Value addition at each stage
- 3.1.4 Factor affecting the value chain
- 3.1.5 Disruptions
- 3.2 Industry impact forces
- 3.2.1 Growth drivers
- 3.2.2 Industry pitfalls and challenges
- 3.2.3 Market opportunities
- 3.3 Growth potential analysis
- 3.4 Regulatory landscape
- 3.4.1 North America
- 3.4.2 Europe
- 3.4.3 Asia Pacific
- 3.4.4 Latin America
- 3.4.5 Middle East & Africa
- 3.5 Porter's analysis
- 3.6 PESTEL analysis
- 3.7 Technology and Innovation landscape
- 3.7.1 Current technological trends
- 3.7.2 Emerging technologies
- 3.8 Price trends
- 3.8.1 By region
- 3.9 Future market trends
- 3.10 Technology and Innovation landscape
- 3.10.1 Current technological trends
- 3.10.2 Emerging technologies
- 3.11 Patent Landscape
- 3.12 Trade statistics (HS code) (Note: the trade statistics will be provided for key countries only)
- 3.12.1 Major importing countries
- 3.12.2 Major exporting countries
- 3.13 Sustainability and environmental aspects
- 3.13.1 Sustainable practices
- 3.13.2 Waste reduction strategies
- 3.13.3 Energy efficiency in production
- 3.13.4 Eco-friendly initiatives
- 3.14 Carbon footprint consideration
Chapter 4 Competitive Landscape, 2024
- 4.1 Introduction
- 4.2 Company market share analysis
- 4.2.1 By region
- 4.2.1.1 North America
- 4.2.1.2 Europe
- 4.2.1.3 Asia Pacific
- 4.2.1.4 LATAM
- 4.2.1.5 MEA
- 4.2.1 By region
- 4.3 Company matrix analysis
- 4.4 Competitive analysis of major market players
- 4.5 Competitive positioning matrix
- 4.6 Key developments
- 4.6.1 Mergers & acquisitions
- 4.6.2 Partnerships & collaborations
- 4.6.3 New product launches
- 4.6.4 Expansion plans
Chapter 5 Market Estimates and Forecast, By Source, 2021-2034 (USD Billion) (Kilo Tons)
- 5.1 Key trends
- 5.2 Plant-based
- 5.2.1 Soy Protein Isolates
- 5.2.2 Soy Protein Concentrates
- 5.2.3 Fermented Soy Protein
- 5.2.4 Duckweed Protein
- 5.2.5 Others
- 5.3 Insect-based
- 5.4 Microbial-based
- 5.4.1 Bacteria
- 5.4.2 Yeast
- 5.4.3 Algae
- 5.4.4 Others
Chapter 6 Market Estimates and Forecast, By Application, 2021-2034 (USD Billion) (Kilo Tons)
- 6.1 Key trends
- 6.2 Meat analogs
- 6.3 Bakery
- 6.4 Dairy alternatives
- 6.5 Cereals & snacks
- 6.6 Beverages
- 6.7 Others
Chapter 7 Market Estimates and Forecast, By Region, 2021-2034 (USD Billion) (Kilo Tons)
- 7.1 Key trends
- 7.2 North America
- 7.2.1 U.S.
- 7.2.2 Canada
- 7.3 Europe
- 7.3.1 Germany
- 7.3.2 UK
- 7.3.3 France
- 7.3.4 Spain
- 7.3.5 Italy
- 7.3.6 Rest of Europe
- 7.4 Asia Pacific
- 7.4.1 China
- 7.4.2 India
- 7.4.3 Japan
- 7.4.4 Australia
- 7.4.5 South Korea
- 7.4.6 Rest of Asia Pacific
- 7.5 Latin America
- 7.5.1 Brazil
- 7.5.2 Mexico
- 7.5.3 Argentina
- 7.5.4 Rest of Latin America
- 7.6 Middle East and Africa
- 7.6.1 Saudi Arabia
- 7.6.2 South Africa
- 7.6.3 UAE
- 7.6.4 Rest of Middle East and Africa
Chapter 8 Company Profiles
- 8.1 Archer Daniels Midland Company
- 8.2 Cargill Inc.
- 8.3 Ingredion Inc.
- 8.4 Kerry Group
- 8.5 Impossible Foods Inc.
- 8.6 The Scoular Company
- 8.7 DSM NV
- 8.8 Lightlife Foods, Inc.
- 8.9 Impossible Foods Inc.
- 8.10 International Flavors & Fragrances, Inc.
- 8.11 Glanbia plc
- 8.12 Bunge Limited
- 8.13 Axiom Foods Inc.
 替代蛋白市場-全球產業規模、佔有率、趨勢、機會、預測:按產品類型、應用、地區和競爭格局分類,2021-2031年
 替代飼料蛋白市場-2026-2031年預測
 下一代乳製品替代品市場預測至2032年:按產品類型、配方、特性、分銷管道、成分、應用和地區分類的全球分析植物來源和替代蛋白食品市場預測至2032年:按蛋白質來源、產品類型、形式、分銷管道、應用、最終用戶和地區分類的全球分析食用昆蟲及替代蛋白來源市場預測至2032年:全球原料、昆蟲種類、產品形態、通路、應用、最終用戶及區域分析
 替代蛋白市場機會、成長促進因素、產業趨勢分析及預測(2025-2034年)替代海鮮市場預測至2032年:按產品類型、產品形態、來源、物種、分銷管道和地區分類的全球分析植物性和替代蛋白市場預測至2032年:按產品類型、蛋白質類型、形態、分銷管道和地區分類的全球分析
 替代蛋白質的全球市場(~2035年):各類型原料,各用途類型,各性質類型,各形態類型,各地區,產業趨勢,預測2032 年替代蛋白質市場預測:按來源、形式、性質、應用和地區分類的全球分析